![Absolute Strength Indicator for MetaTrader 5 Download – Free – [TFlab]](https://cdn.tradingfinder.com/image/277113/4-25-en-absolute-mt5-1.webp)
![Absolute Strength Indicator for MetaTrader 5 Download – Free – [TFlab] 0](https://cdn.tradingfinder.com/image/277113/4-25-en-absolute-mt5-1.webp)
![Absolute Strength Indicator for MetaTrader 5 Download – Free – [TFlab] 1](https://cdn.tradingfinder.com/image/277101/4-25-en-absolute-mt5-2.webp)
![Absolute Strength Indicator for MetaTrader 5 Download – Free – [TFlab] 2](https://cdn.tradingfinder.com/image/277114/4-25-en-absolute-mt5-3.webp)
![Absolute Strength Indicator for MetaTrader 5 Download – Free – [TFlab] 3](https://cdn.tradingfinder.com/image/277112/4-25-en-absolute-mt5-4.webp)
The Absolute Strength Indicator is a widely used tool among MetaTrader 5 indicators that helps identify the relative strength of buyers and sellers in the market.
It is particularly useful for traders who employ trend-based trading strategies, providing precise analysis of dominant trends and market strength assessment.
Unlike the RSI indicator, which presents an overall market strength, the Absolute Strength Indicator separately identifies the strength of buyers and sellers, offering a more detailed market analysis.
Absolute Strength Indicator Specifications
The table below summarizes the key details of the Absolute Strength Indicator.
Indicator Categories: | Oscillators MT5 Indicators Volatility MT5 Indicators Currency Strength MT5 Indicators |
Platforms: | MetaTrader 5 Indicators |
Trading Skills: | Intermediate |
Indicator Types: | Leading MT5 Indicators Reversal MT5 Indicators |
Timeframe: | Multi-Timeframe MT5 Indicators |
Trading Style: | Intraday MT5 Indicators |
Trading Instruments: | Forex MT5 Indicators Crypto MT5 Indicators Stock MT5 Indicators |
Indicator Overview
The Absolute Strength Indicator is displayed in a separate window below the price chart and consists of two solid lines and two dashed lines. Each of these lines represents the strength of buyers and sellers across different timeframes.
- The green line represents buyer strength.
- The red line represents seller strength.
This indicator provides a comprehensive view of market strength, allowing traders to identify trends effectively.
Indicator in a Bullish Trend
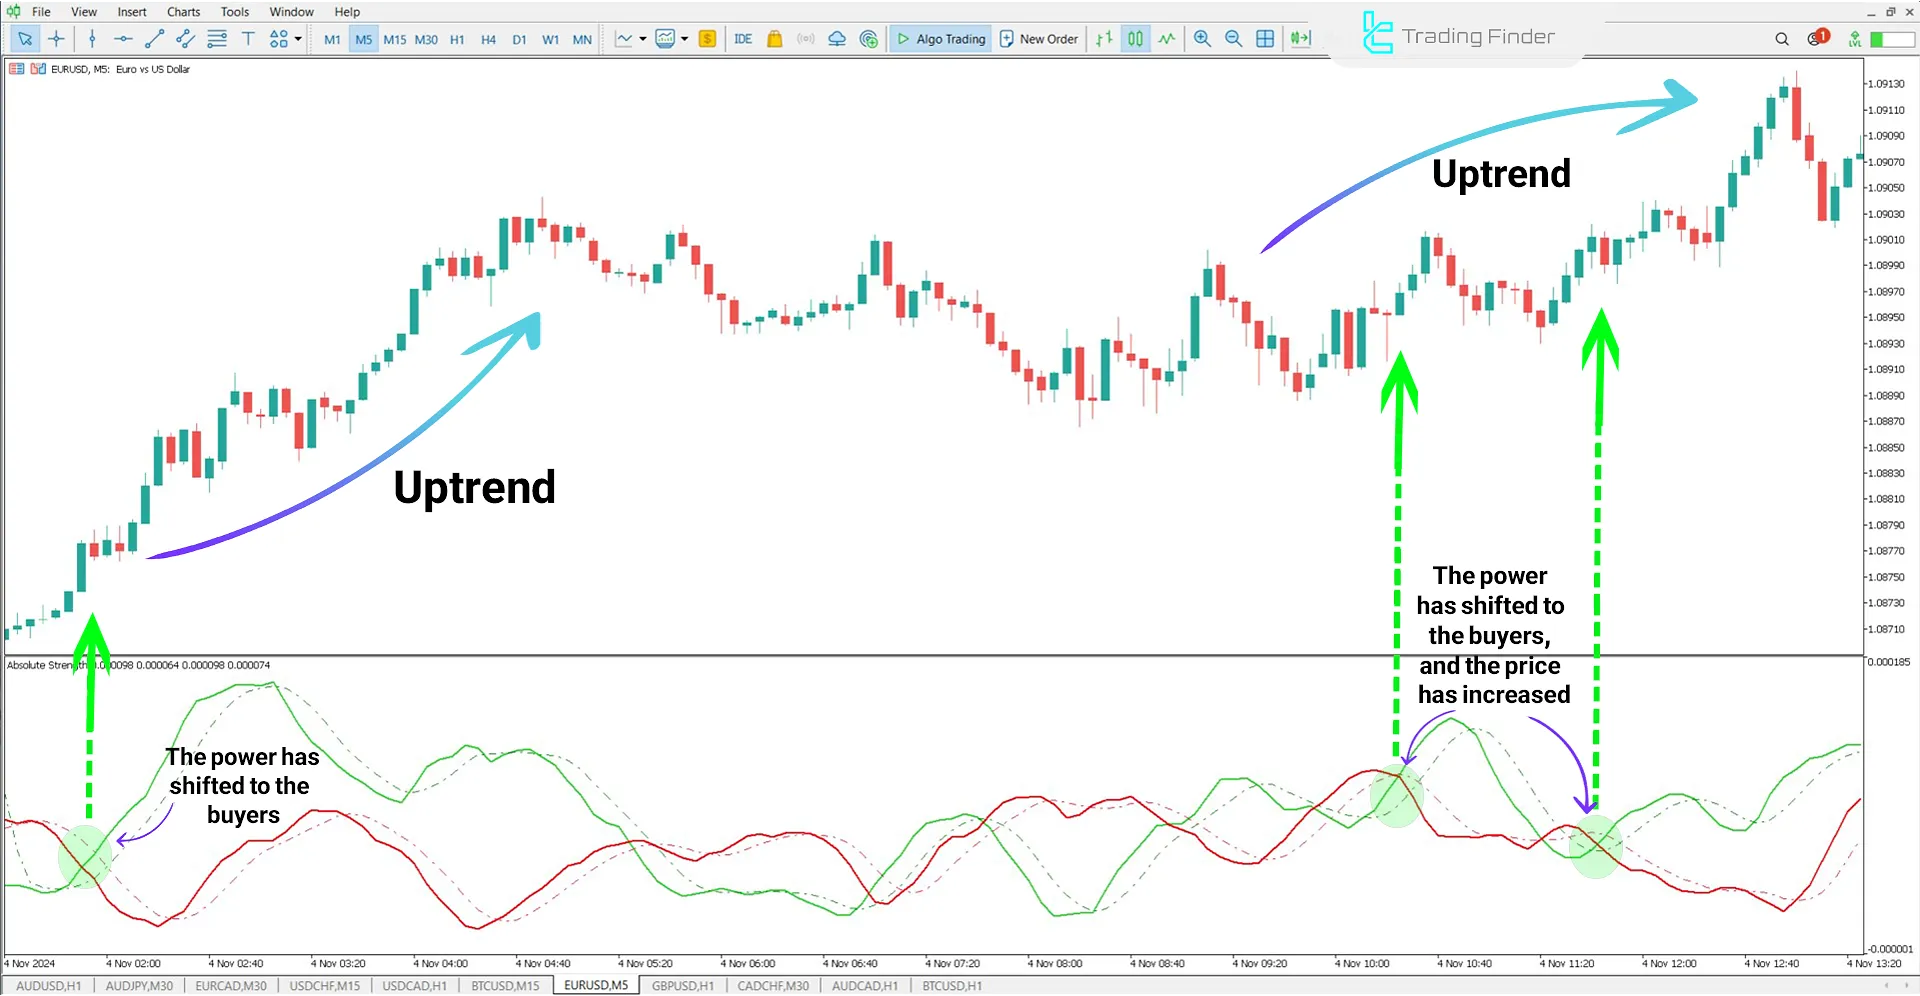
When the green line is above the red line, it indicates a bullish trend, confirming the dominance of buyers in the market.
In the chart below, theEUR/USD currency pair is shown in a 5-minute timeframe. Each time the green line breaks upward, the price increases, and traders can enter a buy position.

Indicator in a Bearish Trend
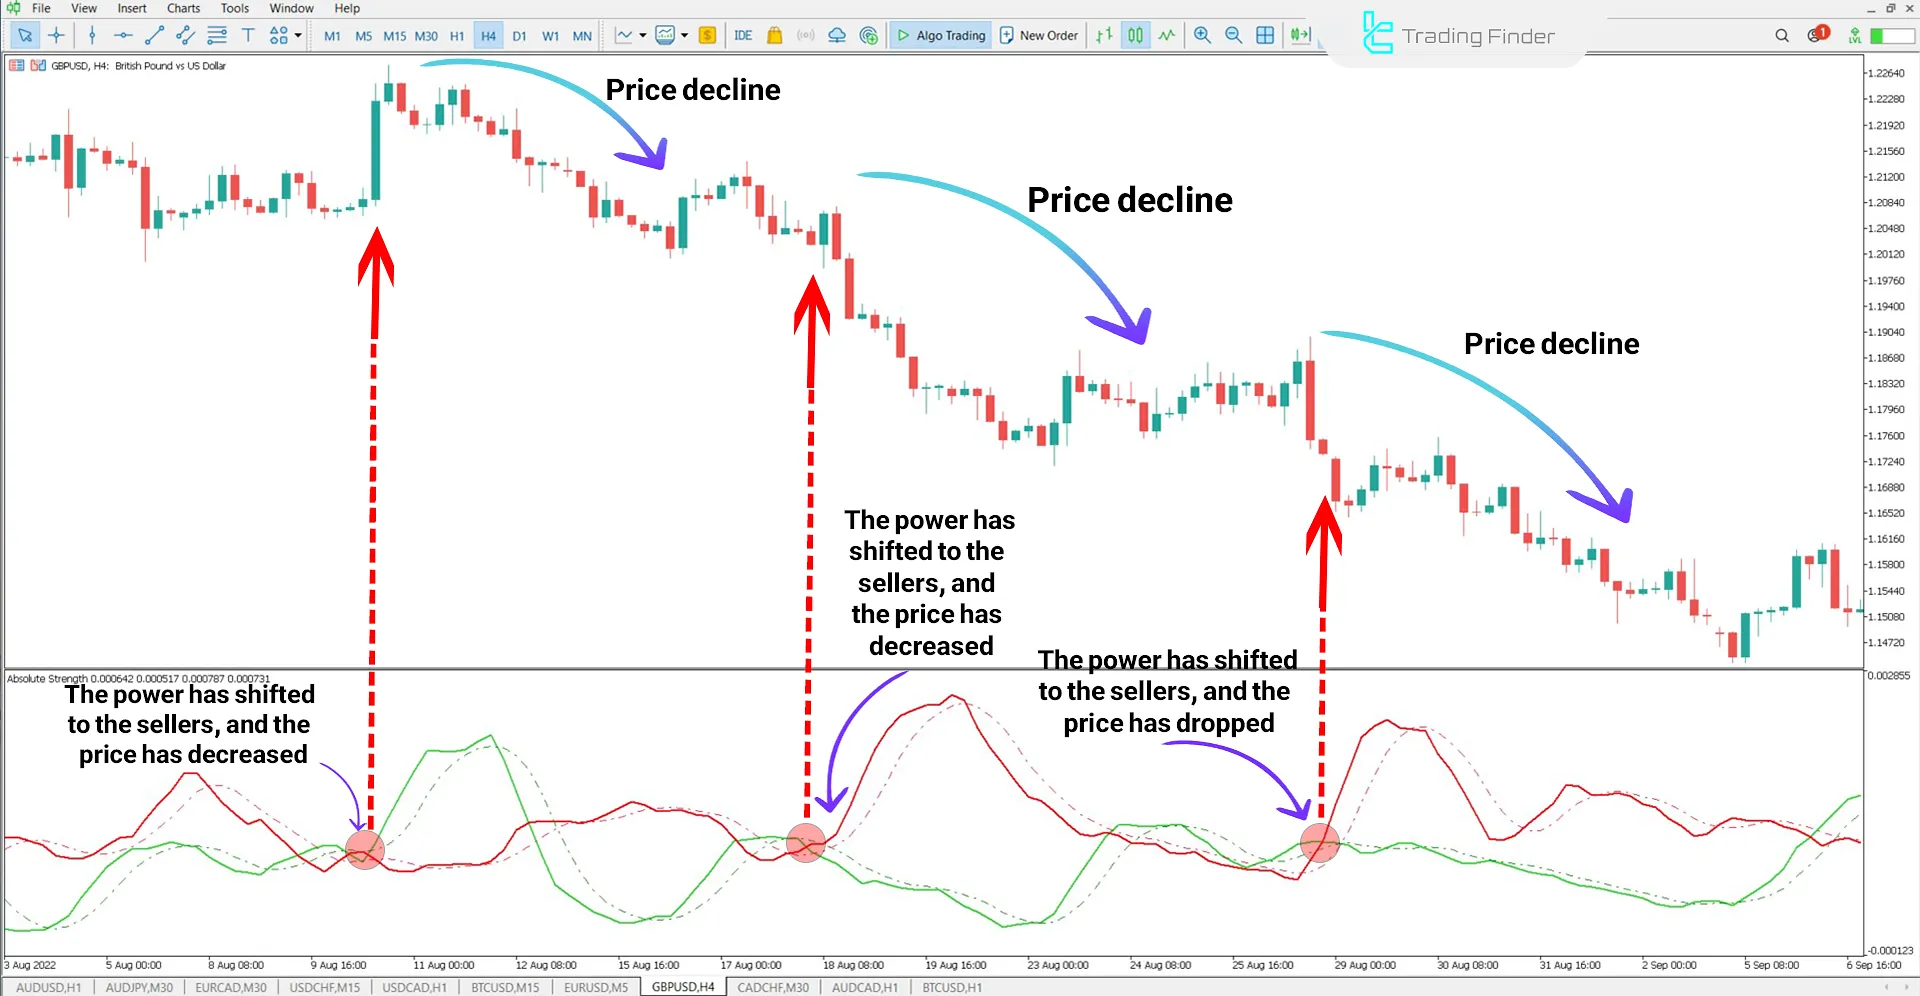
In the following bearish trend example, the GBP/USD currency pair is displayed in a 4-hour timeframe.
When the red line is above the green line, it signifies that sellers have gained control over the market. Traders, depending on their strategy and confirmation signals, can enter a sell position.

Indicator Settings
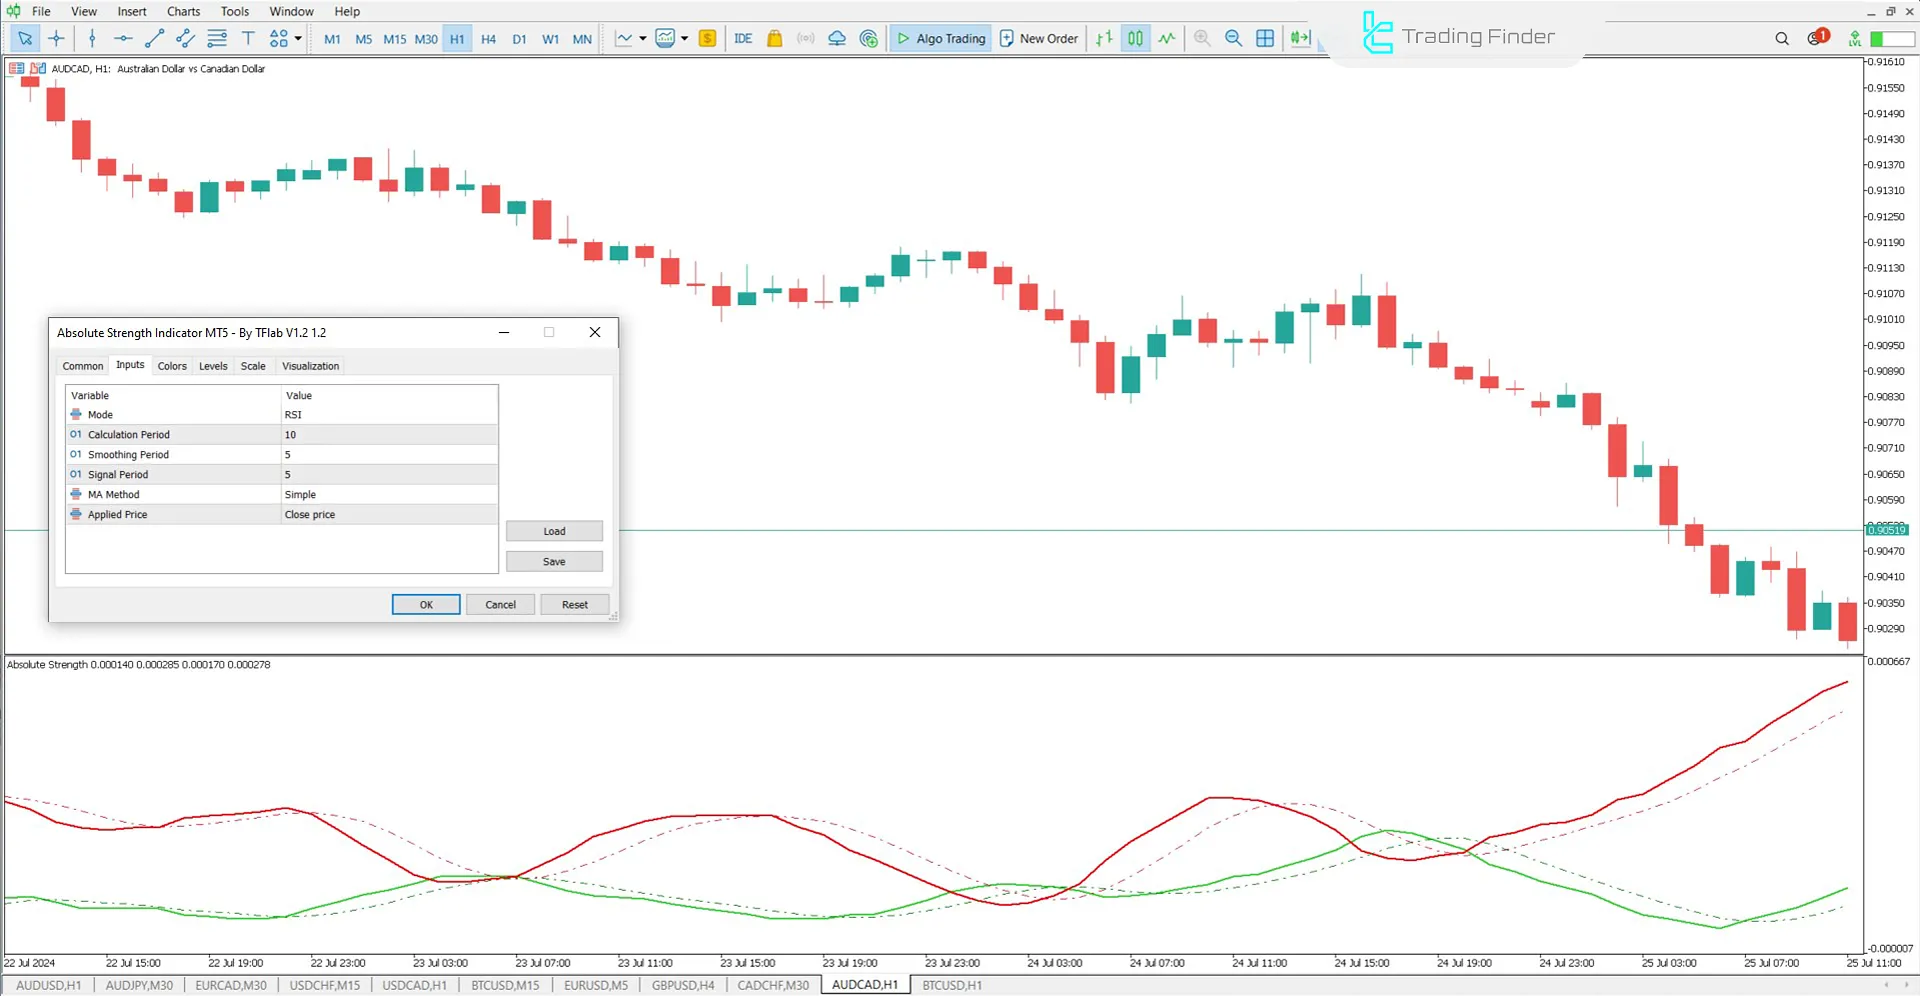
The image below displays the settings panel for the Absolute Strength Indicator:

- Mode: Strength calculation mode
- Period: Overall indicator calculation period
- Smoothing Period: Determines how frequently crossovers occur based on trend strength
- Signal Period: Moving average calculation period (dotted line)
- MA Method: Selection of calculation methodology
- Applied Price: Specifies which price type the indicator applies to
Conclusion
The Absolute Strength Indicator is one of the Currency Strength indicators MetaTrader 5. By plotting the green line for buyer strength and the red line for seller strength, it provides a clear view of market control and the relative dominance of buyers or sellers.
When the green line is above the red line, it indicates an uptrend and can be used as a buy signal. Conversely, when the red line is above the green line, a downtrend is dominant, providing a sell signal.
Absolute Strength MT5 PDF
Absolute Strength MT5 PDF
Click to download Absolute Strength MT5 PDFWhat is the difference between the Absolute Strength Indicator and the RSI?
Unlike the RSI, which presents overall market strength, the Absolute Strength Indicator separately analyzes the strength of buyers and sellers. This makes it easier for traders to determine which side has control at any given time.
How can traders use the Absolute Strength Indicator for trend analysis?
This indicator plots two separate lines to represent buyer and seller strength:
- If the green line is above the red line, it signals a bullish trend.
- If the red line is above the green line, it indicates a bearish trend.


