![AI Channels Clustering Indicator for MetaTrader 5 - Free Download [TradingFinder]](https://cdn.tradingfinder.com/image/569874/2-156-en-ai-channels-clustering-mt5-1.webp)
![AI Channels Clustering Indicator for MetaTrader 5 - Free Download [TradingFinder] 0](https://cdn.tradingfinder.com/image/569874/2-156-en-ai-channels-clustering-mt5-1.webp)
![AI Channels Clustering Indicator for MetaTrader 5 - Free Download [TradingFinder] 1](https://cdn.tradingfinder.com/image/569882/2-156-en-ai-channels-clustering-mt5-2.webp)
![AI Channels Clustering Indicator for MetaTrader 5 - Free Download [TradingFinder] 2](https://cdn.tradingfinder.com/image/569887/2-156-en-ai-channels-clustering-mt5-3.webp)
![AI Channels Clustering Indicator for MetaTrader 5 - Free Download [TradingFinder] 3](https://cdn.tradingfinder.com/image/569888/2-156-en-ai-channels-clustering-mt5-4.webp)
The AI Channels Clustering Indicator processes price data based on the K-means Clustering algorithm. By analyzing a series of recent prices, it categorizes them into statistical clusters.
Each cluster has a centroid that reflects the price behavior of that group. Using these centroids, the indicator plots three colored channel ranges on the chart: minimum, median, and maximum.
AI Channels Clustering Indicator Table
The main features of the AI Channels Clustering Indicator are presented in the table below:
Indicator Categories: | Signal & Forecast MT5 Indicators Trading Assist MT5 Indicators Bands & Channels MT5 Indicators |
Platforms: | MetaTrader 5 Indicators |
Trading Skills: | Intermediate |
Indicator Types: | Reversal MT5 Indicators |
Timeframe: | Multi-Timeframe MT5 Indicators |
Trading Style: | Day Trading MT5 Indicators |
Trading Instruments: | Forex MT5 Indicators Crypto MT5 Indicators Stock MT5 Indicators Commodity MT5 Indicators Indices MT5 Indicators Share Stock MT5 Indicators |
AI Channels Clustering Indicator at a Glance
The AI Channels Clustering Indicator, using the K-means algorithm, transforms price data into dynamic channels that act as key support and resistance levels in technical analysis.
The Denoise Channels feature filters out short-term and insignificant movements, displaying the main market direction as follows:
- Upper and lower channels displayed as colored bands, marking dynamic support and resistance zones;
- The middle yellow line serves as the centroid of price movement;
- Colored bands between the lines reflect the trend strength through variations in transparency and color.
Indicator in an Uptrend
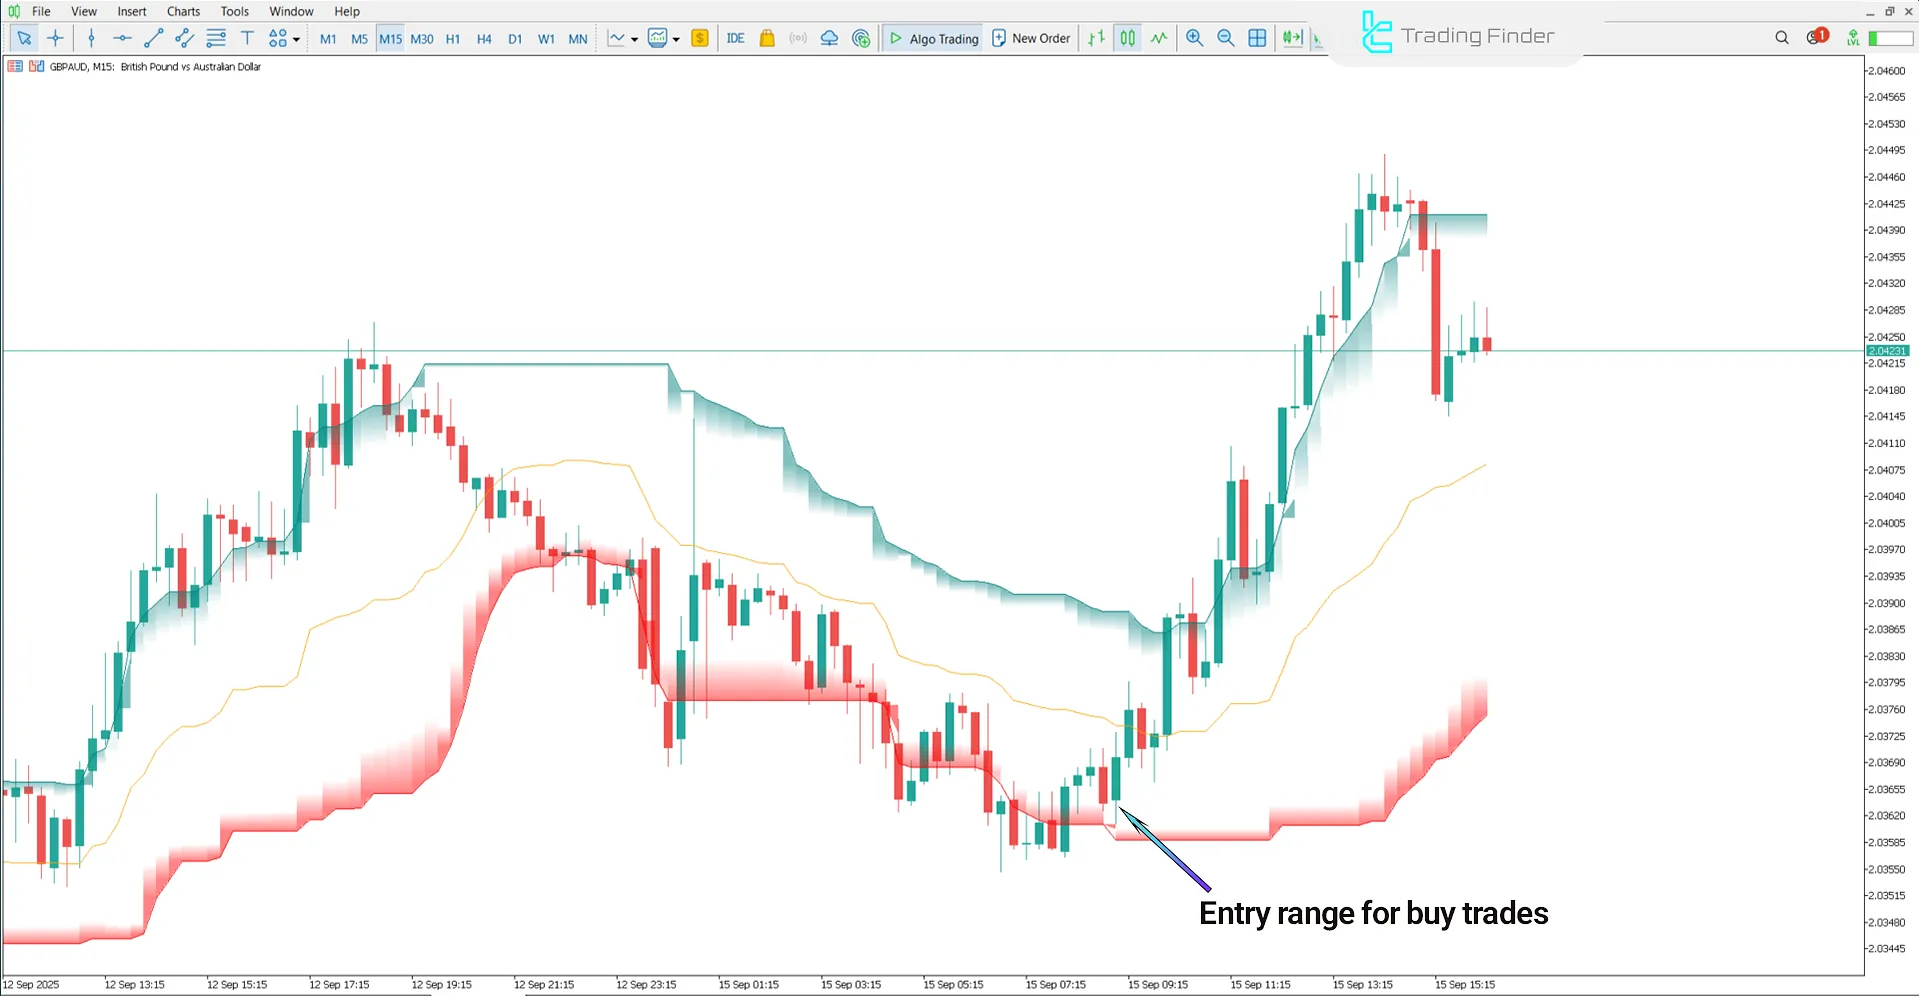
In an uptrend, a breakout above the upper boundary of the AI Channels Clustering Indicator signals the beginning or continuation of a bullish move.
Furthermore, the formation of a wide dispersion area in the upper part of the channel indicates stronger bullish volatility and momentum.

Indicator in a Downtrend
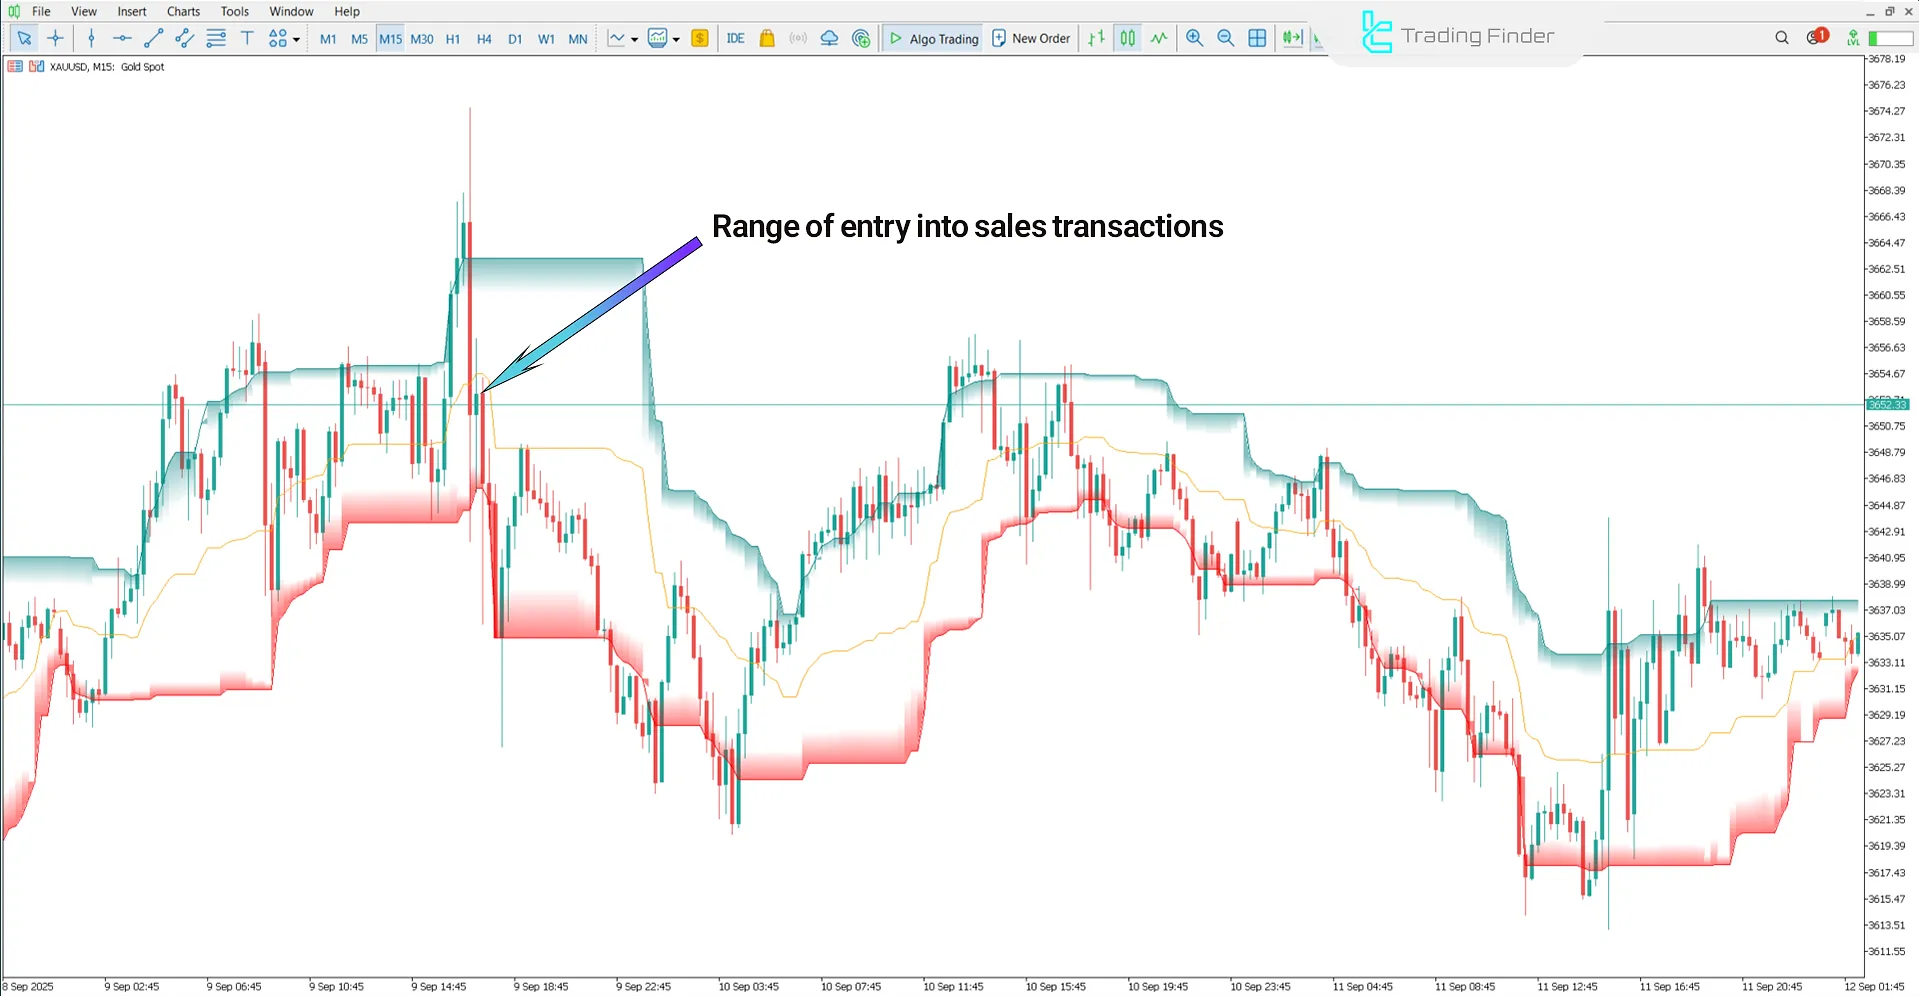
In a downtrend, a breakout below the lower boundary of the AI Channels Clustering Indicator reflects seller dominance and the start of bearish pressure.
This scenario usually creates a reliable zone for entering short positions. Additionally, wide cluster dispersion in the lower part of the channel indicates heightened volatility and the continuation of the bearish trend.

AI Channels Clustering Indicator Settings
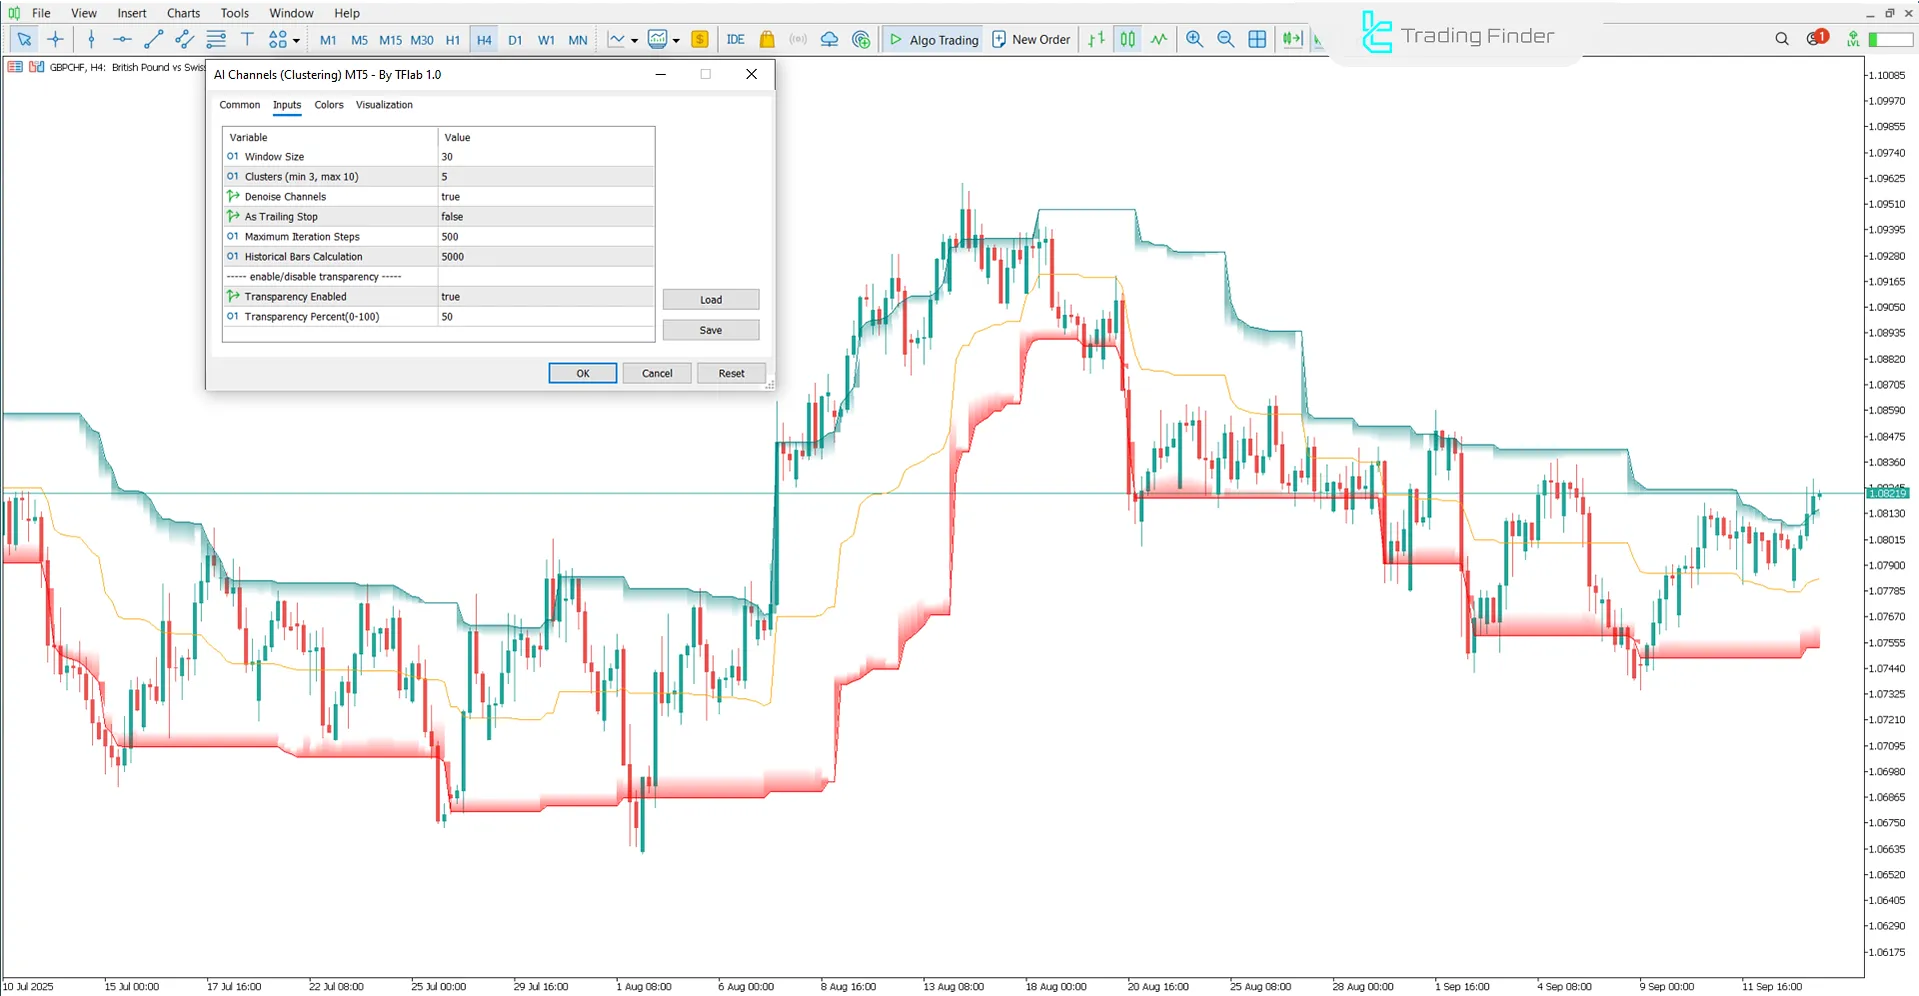
The image below shows the settings panel of the AI Channels Clustering Indicator in MetaTrader 5:

- Window Size: Number of recent candlesticks
- Clusters (min 3, max 10): Number of price clusters in the K-means algorithm
- Denoise Channels: Enables noise reduction for smoother channel display
- As Trailing Stop: Sets the indicator in default Trailing Stop mode
- Maximum Iteration Steps: Maximum number of iterations to determine centroids
- Historical Bars Calculation: Number of historical candlesticks used in the calculation
- Transparency Enabled: Enables transparency for channel coloring
- Transparency Percent (0-100): Percentage of channel transparency
Conclusion
The AI Channels Clustering Indicator plots dynamic channels that define support and resistance levels and provides clearer market trend signals by filtering out short-term noise.
Additionally, its capability to function as a Trailing Stop helps manage floating risk. Finally, wide cluster dispersion indicates strong volatility, enhances breakout reliability, and highlights market momentum.
AI Channels Clustering Indicator for MetaTrader 5 PDF
AI Channels Clustering Indicator for MetaTrader 5 PDF
Click to download AI Channels Clustering Indicator for MetaTrader 5 PDFIs the AI Channels Clustering Indicator applicable to different timeframes?
Yes; this trading tool is multi-timeframe and can be applied from short-term (scalping) to long-term (swing) trading.
How are entry or exit signals identified in the AI Channels Clustering Indicator?
In this trading tool, when price reaches the upper or lower cluster boundaries and a divergence or breakout is simultaneously confirmed, a valid entry or exit signal is generated.


