


![AI SuperTrend Clustering Oscillator for MT5 Download – Free – [TradingFinder]](https://cdn.tradingfinder.com/image/610960/13-252-en-ai-supertrend-clustering-oscillator-mt5-01.webp)
![AI SuperTrend Clustering Oscillator for MT5 Download – Free – [TradingFinder] 1](https://cdn.tradingfinder.com/image/610962/13-252-en-ai-supertrend-clustering-oscillator-mt5-02.webp)
![AI SuperTrend Clustering Oscillator for MT5 Download – Free – [TradingFinder] 2](https://cdn.tradingfinder.com/image/610961/13-252-en-ai-supertrend-clustering-oscillator-mt5-03.webp)
![AI SuperTrend Clustering Oscillator for MT5 Download – Free – [TradingFinder] 3](https://cdn.tradingfinder.com/image/610959/13-252-en-ai-supertrend-clustering-oscillator-mt5-04.webp)
The AI SuperTrend Clustering Oscillator is designed based on a combination of SuperTrend logic and the statistical K-Means clustering method.
This tool analyzes the difference between the current price and multiple calculated SuperTrend values, categorizing the data into three main groups: bullish, bearish, and consensus clusters.
The result of this process is displayed as colored bands within the oscillator, allowing for quick recognition of the market condition.
Specification Table of AI SuperTrend Clustering Oscillator
The table below shows the specifications of the AI SuperTrend Clustering Oscillator:
Indicator Categories: | Signal & Forecast MT5 Indicators Machine Learning Indicators for MetaTrader 5 AI Indicators for MetaTrader 5 |
Platforms: | MetaTrader 5 Indicators |
Trading Skills: | Elementary |
Indicator Types: | Reversal MT5 Indicators |
Timeframe: | Multi-Timeframe MT5 Indicators |
Trading Style: | Swing Trading MT5 Indicators Scalper MT5 Indicators Day Trading MT5 Indicators |
Trading Instruments: | Forex MT5 Indicators Crypto MT5 Indicators Stock MT5 Indicators |
AI SuperTrend Clustering Oscillator at a Glance
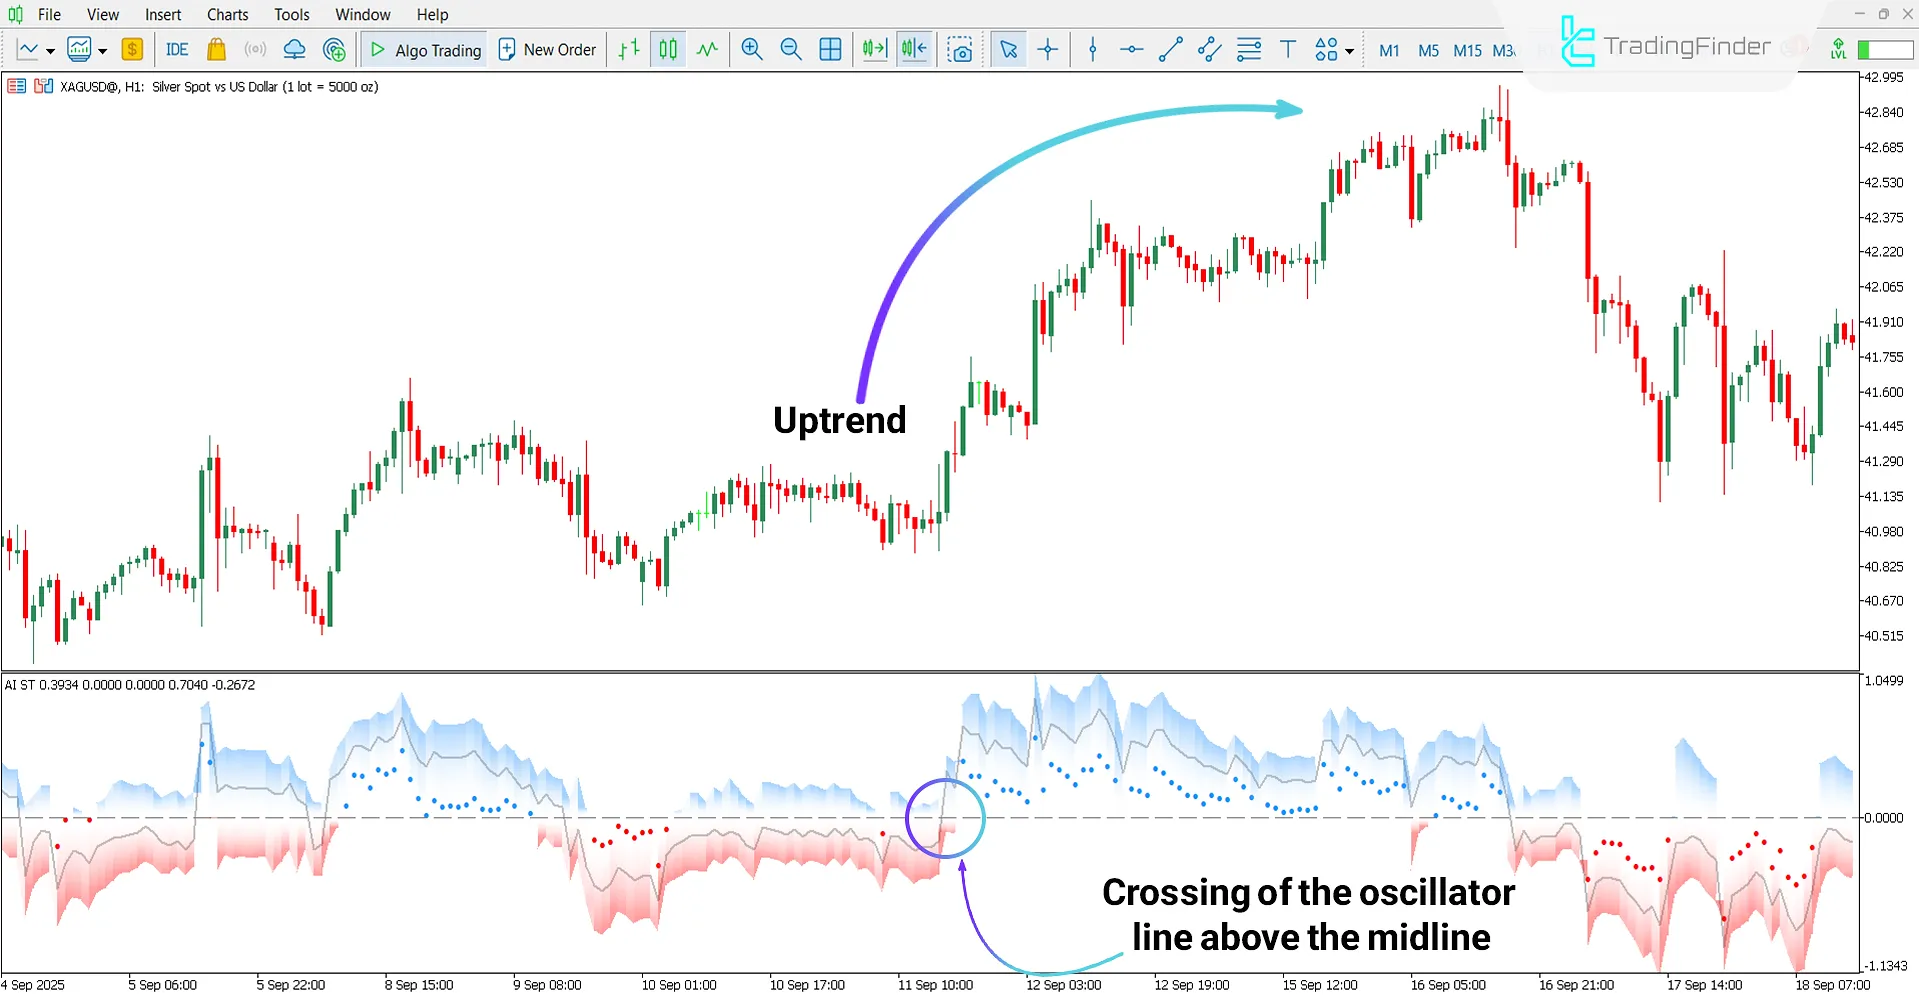
At the lower part of the chart, the AI SuperTrend Clustering Oscillator generates three distinct outputs, as follows:
- Consensus Output: The central gray line represents the indicator’s consensus and the main market direction;
- Bullish Output: The oscillator line moves upward above the midline, forming blue-colored zones;
- Bearish Output: The oscillator line moves below the midline, expanding red-colored zones.
Bullish Trend
According to the 1-hour chart of Silver vs US Dollar (XAG/USD), when the oscillator line crosses above the midline, a blue area forms indicating the beginning of a strong bullish trend.
As this condition remains stable, candlesticks accelerate, and the upward movement pattern becomes confirmed on the main chart.
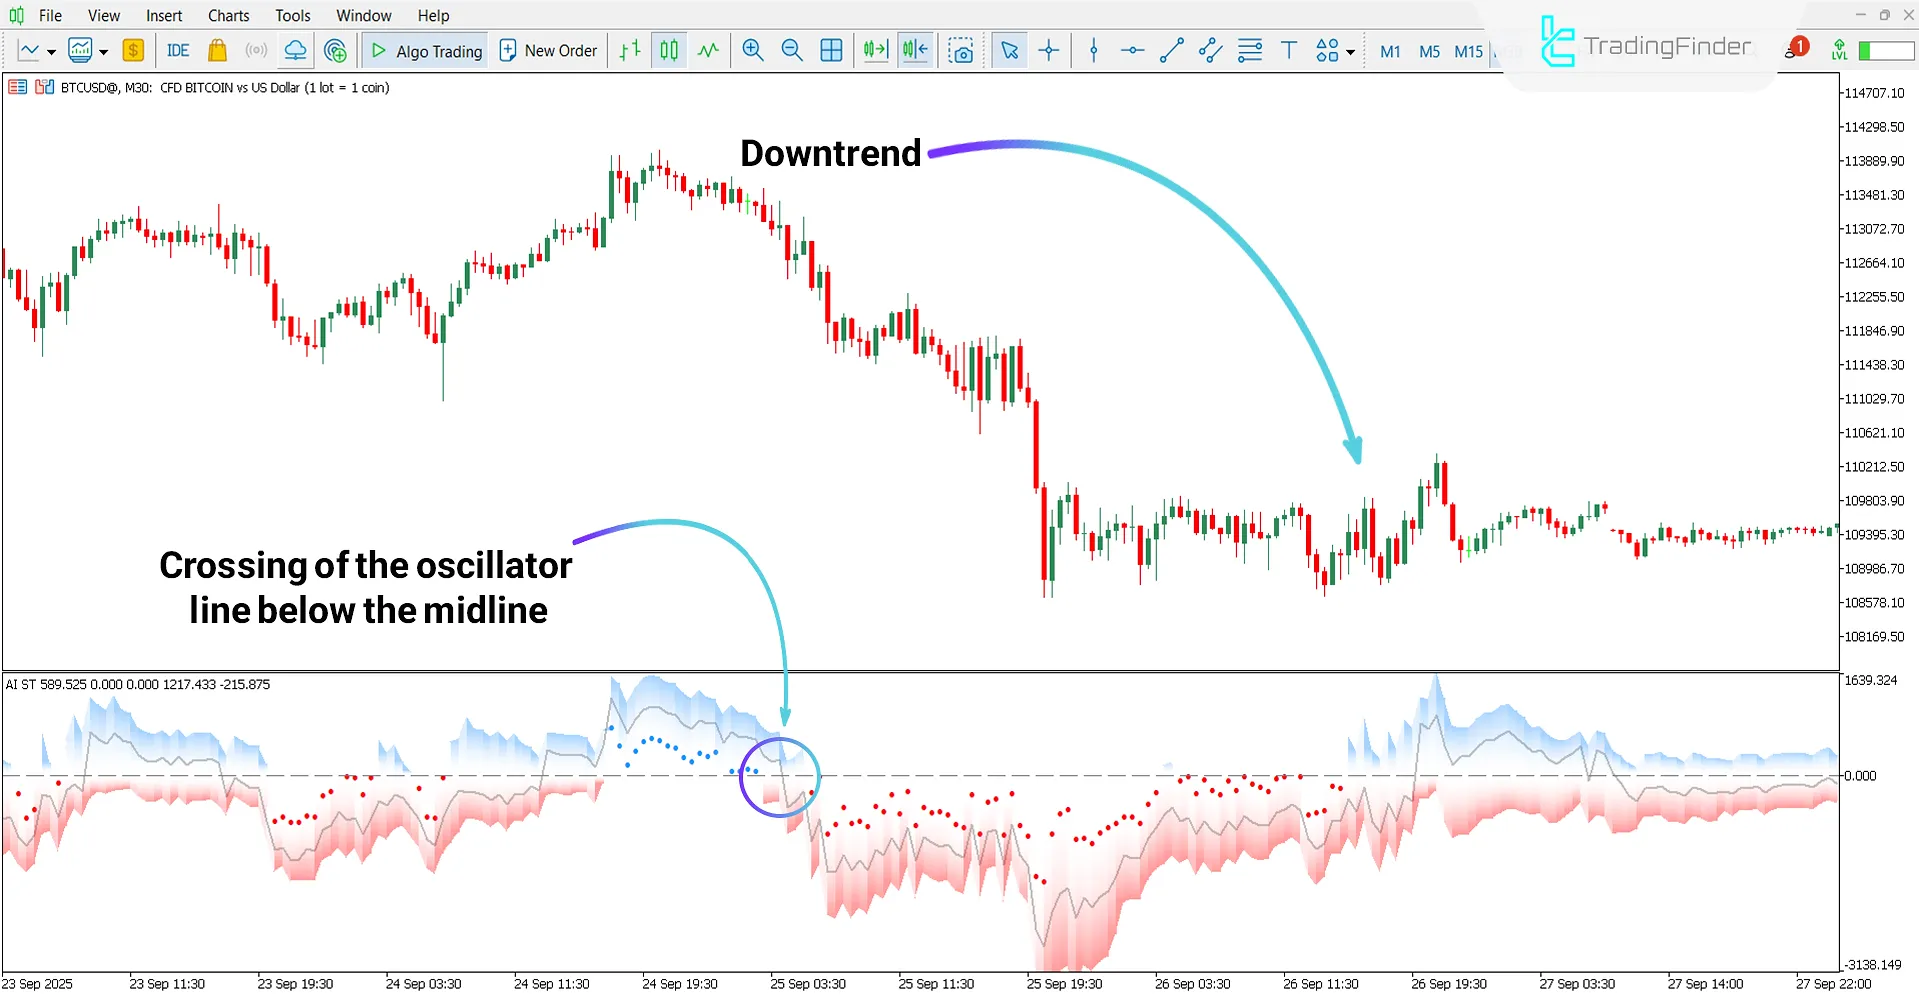
Bearish Trend
Based on the 30-minute chart of Bitcoin (BTC) cryptocurrency, when the oscillator line moves below the midline and a wide red zone forms in the lower section, it signals the start of a strong bearish trend.
Following this signal, candles consecutively close lower, and selling pressure intensifies in the market structure.
Settings of AI SuperTrend Clustering Oscillator
The customizable parameters of the AI SuperTrend Clustering Oscillator are as follows:
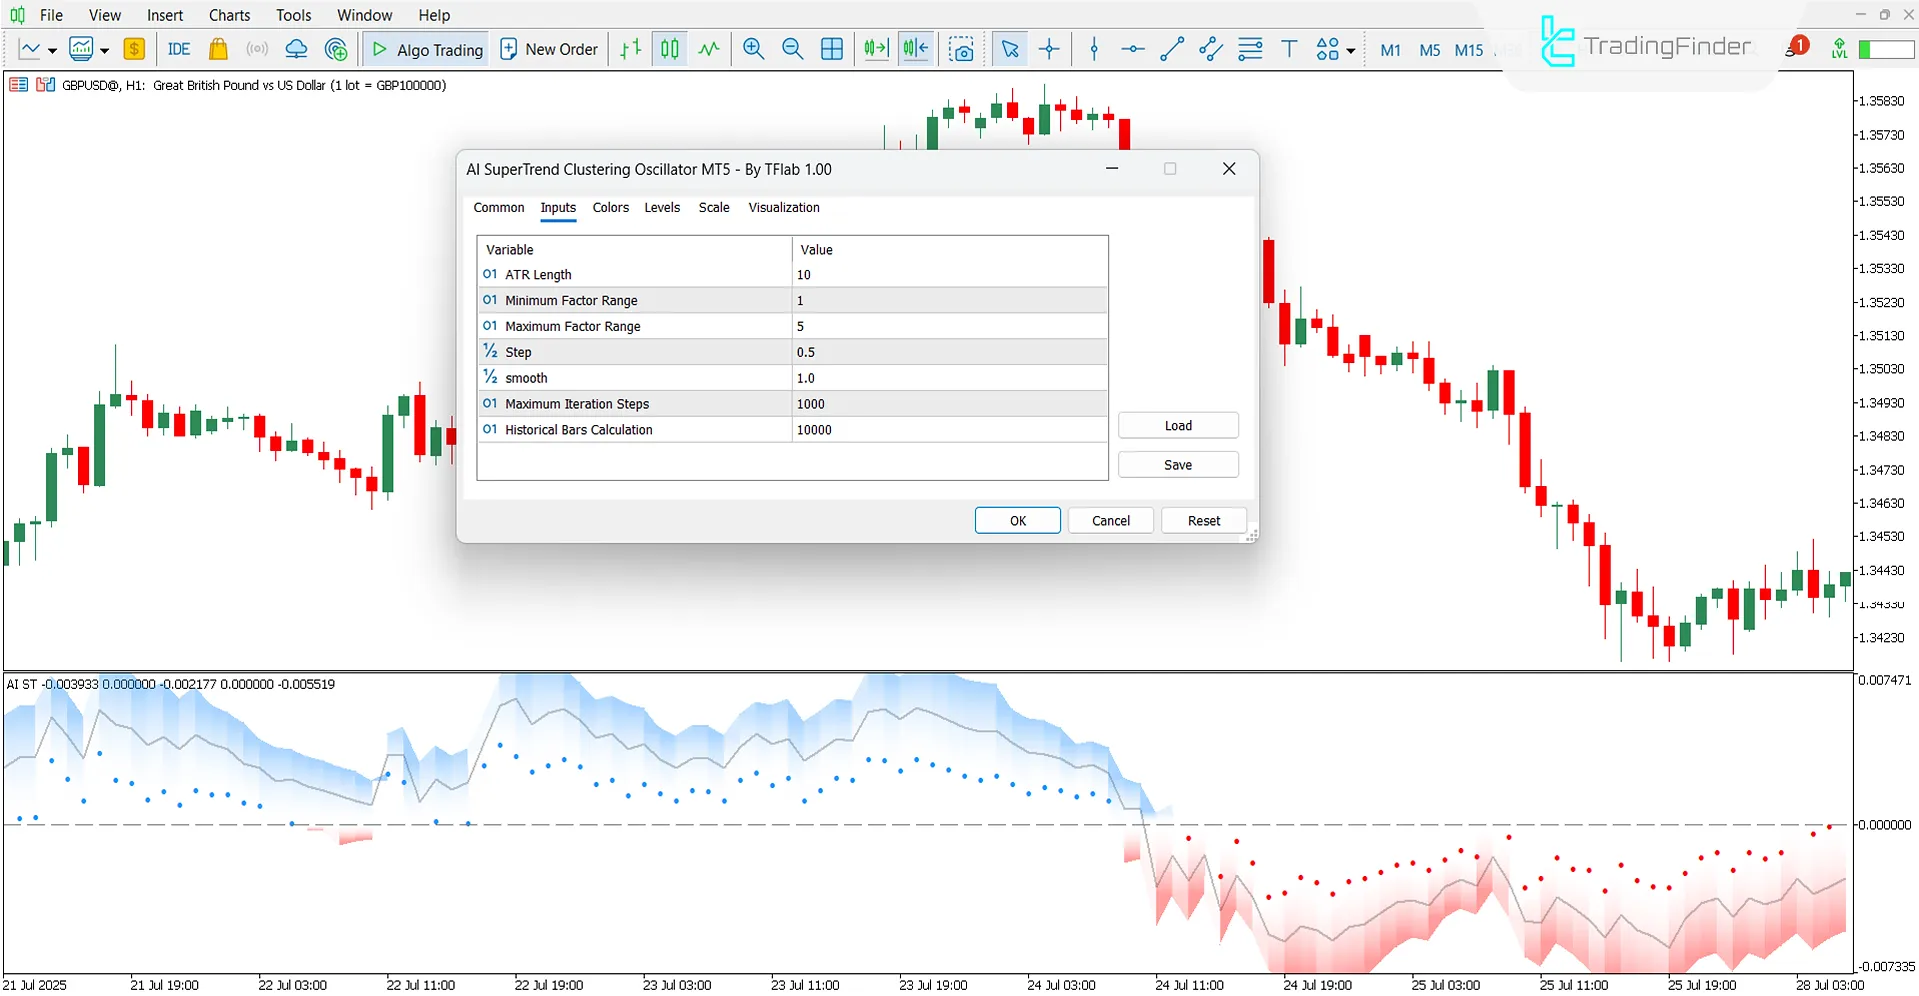
- ATR Length: Number of periods for calculating the Average True Range;
- Minimum Factor Range: Minimum coefficient value for calculating SuperTrend lines.
- Maximum Factor Range: Maximum coefficient value for determining SuperTrend ranges.
- Step: Incremental step size between the minimum and maximum factors.
- Smooth: Degree of smoothing applied to the indicator output to reduce signal noise.
- Maximum Iteration Steps: Maximum number of clustering algorithm iterations to find cluster centers.
- Historical Bars Calculation: Number of historical candlesticks used in indicator calculations.
- Bullish Trend Color: Color assigned to display bullish zones.
- Bearish Trend Color: Color assigned to display bearish zones.
Conclusion
The AI SuperTrend Clustering Oscillator is built upon the combination of SuperTrend methodology and the K-Means clustering algorithm, offering a more precise depiction of market trends through multidimensional price data analysis.
Using the Average True Range (ATR) to measure volatility, it dynamically recalibrates bullish and bearish zones accordingly.
As a result, compared to traditional SuperTrend versions, this oscillator provides greater accuracy in identifying quick trend reversals, short-term corrections, and potential price reversal zones.
AI SuperTrend Clustering Oscillator for MT5 PDF
AI SuperTrend Clustering Oscillator for MT5 PDF
Click to download AI SuperTrend Clustering Oscillator for MT5 PDFCan this tool be used in the stock market?
Yes, the AI SuperTrend Clustering Oscillator can be applied across all markets.
Is this indicator effective for short-term timeframes? Yes, the AI SuperTrend Clustering Oscillator is multi-timeframe and applicable across all trading periods.
Yes, the AI SuperTrend Clustering Oscillator is multi-timeframe and applicable across all trading periods.
Cannot download MT4 indicator Only the PDF was downloaded waste of my time there is no download button for the indicator

This has been reviewed. The file is downloadable and executable. For further evaluation, please contact our support team.


