![Auto Fibo Indicator for MT5 Download - Free - [TradingFinder]](https://cdn.tradingfinder.com/image/169047/13-8-en-autofibo-mt5-1.webp)
![Auto Fibo Indicator for MT5 Download - Free - [TradingFinder] 0](https://cdn.tradingfinder.com/image/169047/13-8-en-autofibo-mt5-1.webp)
![Auto Fibo Indicator for MT5 Download - Free - [TradingFinder] 1](https://cdn.tradingfinder.com/image/169046/13-8-en-autofibo-mt5-2.webp)
![Auto Fibo Indicator for MT5 Download - Free - [TradingFinder] 2](https://cdn.tradingfinder.com/image/169050/13-8-en-autofibo-mt5-3.webp)
![Auto Fibo Indicator for MT5 Download - Free - [TradingFinder] 3](https://cdn.tradingfinder.com/image/169052/13-8-en-autofibo-mt5-4.webp)
The Auto Fibonacci indicator automatically plots Fibonacci retracements on the price chart. Fibonacci numbers such as 23.6%, 38.2%, 50%, 61.8%, and 76.4% are specifically and widely used in technical analysis.
Fibonacci ratios help traders identify price reversal zones. Using this MetaTrader 5 Indicator reduces errors in calculating Fibonacci numbers.
Specifications Table for Automatic Fibonacci Indicator
Indicator Categories: | Support & Resistance MT5 Indicators Trading Assist MT5 Indicators Levels MT5 Indicators |
Platforms: | MetaTrader 5 Indicators |
Trading Skills: | Intermediate |
Indicator Types: | Reversal MT5 Indicators |
Timeframe: | Multi-Timeframe MT5 Indicators |
Trading Style: | Day Trading MT5 Indicators |
Trading Instruments: | Forex MT5 Indicators Crypto MT5 Indicators Stock MT5 Indicators Commodity MT5 Indicators Indices MT5 Indicators Forward MT5 Indicators Share Stock MT5 Indicators |
Overview of the Auto Fibo Indicator
TheAuto Fibonacci Indicator identifies the highest and lowest low points and plots Fibonacci levels accordingly. This indicator helps traders identify key support and resistance levels in Meta Trader 5, allowing them to optimize their trading strategies themselves.
Uptrend Condition
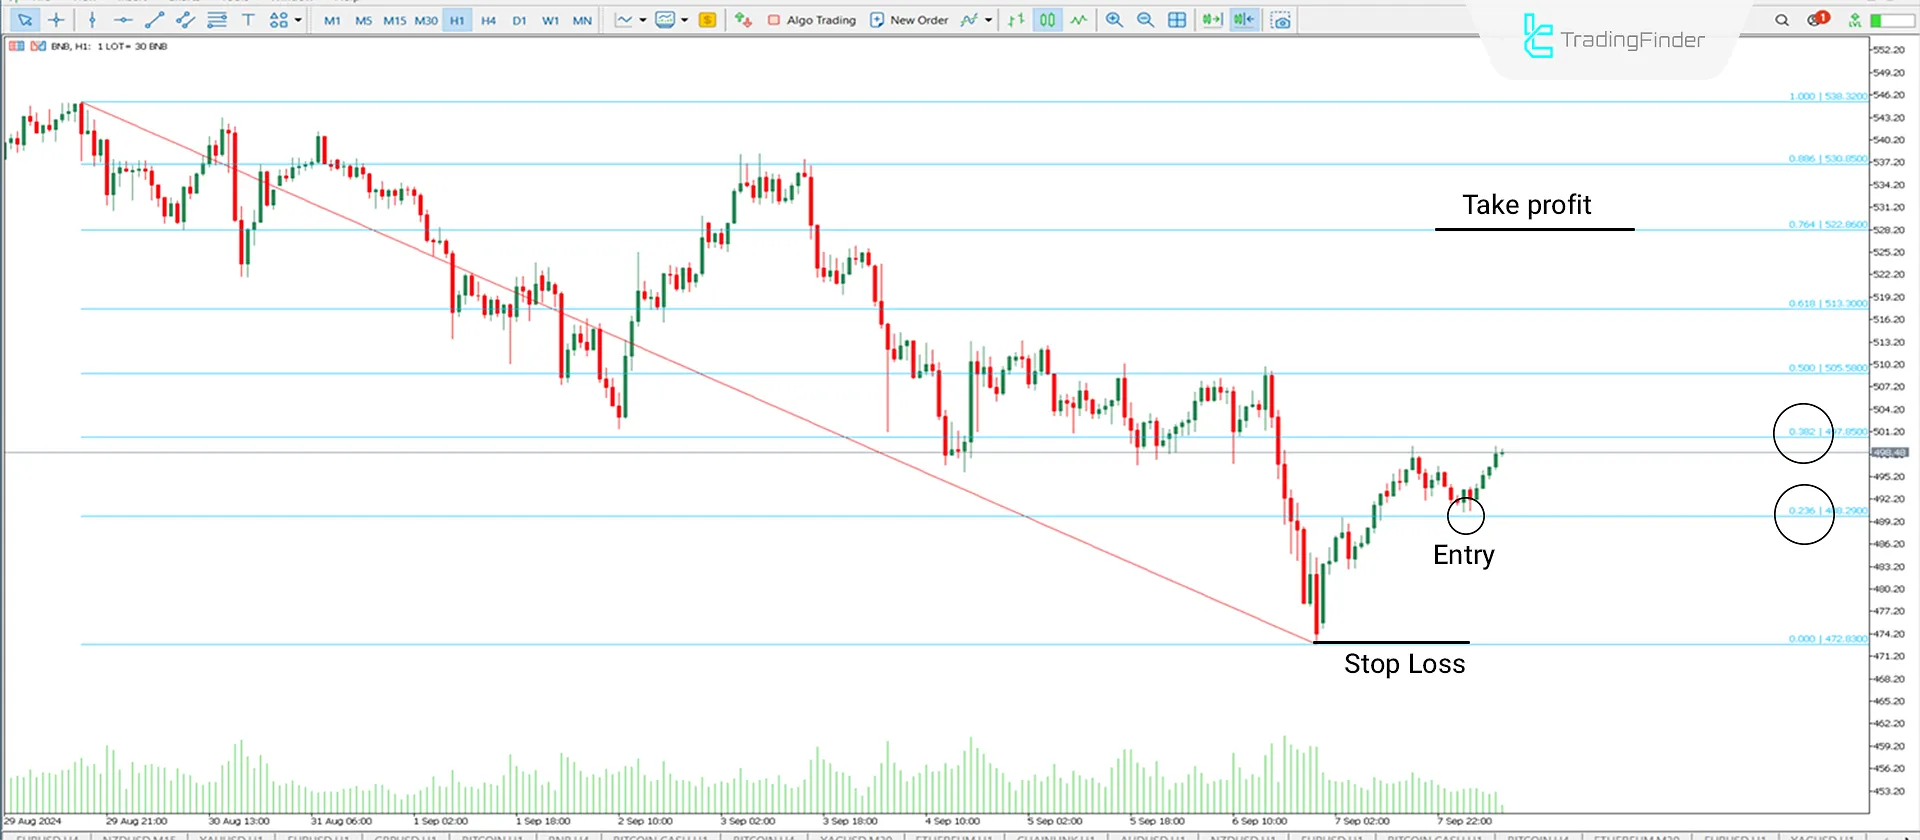
In an uptrend, the Auto Fibo Indicator sets zero at the low and one hundred at the high points. The 1-hour Binance Coin (BNB) price chart shows the uptrend condition in the Auto Fibonacci Indicator.
In an uptrend, Fibonacci levels between 23.6% and 38.2% can be good entry points for long trades. Additionally, recent support levels can act as Stop Loss, while Fibonacci levels of 61.8% and 76.4% can serve as Profit targets.

Downtrend Condition
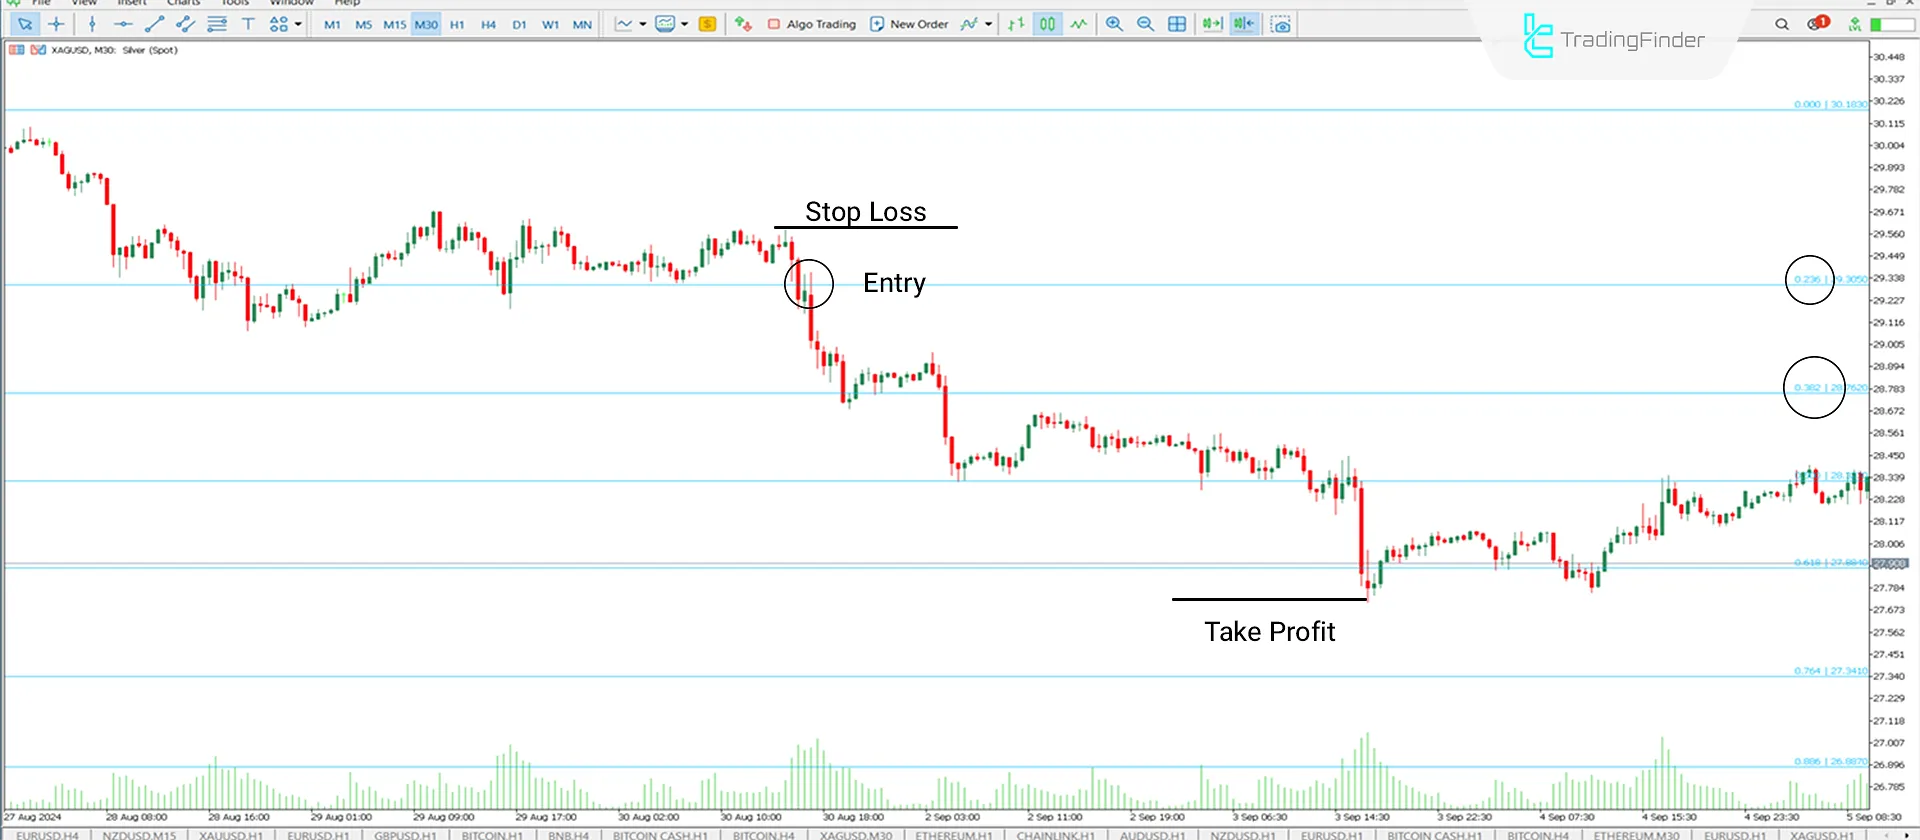
The 30-minute price chart of Silver against the US Dollar (XAG/USD) shows a downtrend trading condition. In a downtrend, the Auto Fibo Indicator sets zero at the highest and one hundred at the lowest low.
The image shows that points near the 23.6% and 38.2% levels can be good entry points for sell trades. In such a trading scenario, recent resistance levels can act as Stop Loss, while Fibonacci levels of 61.8% and 76.4% can serve as Profit targets.

Settings

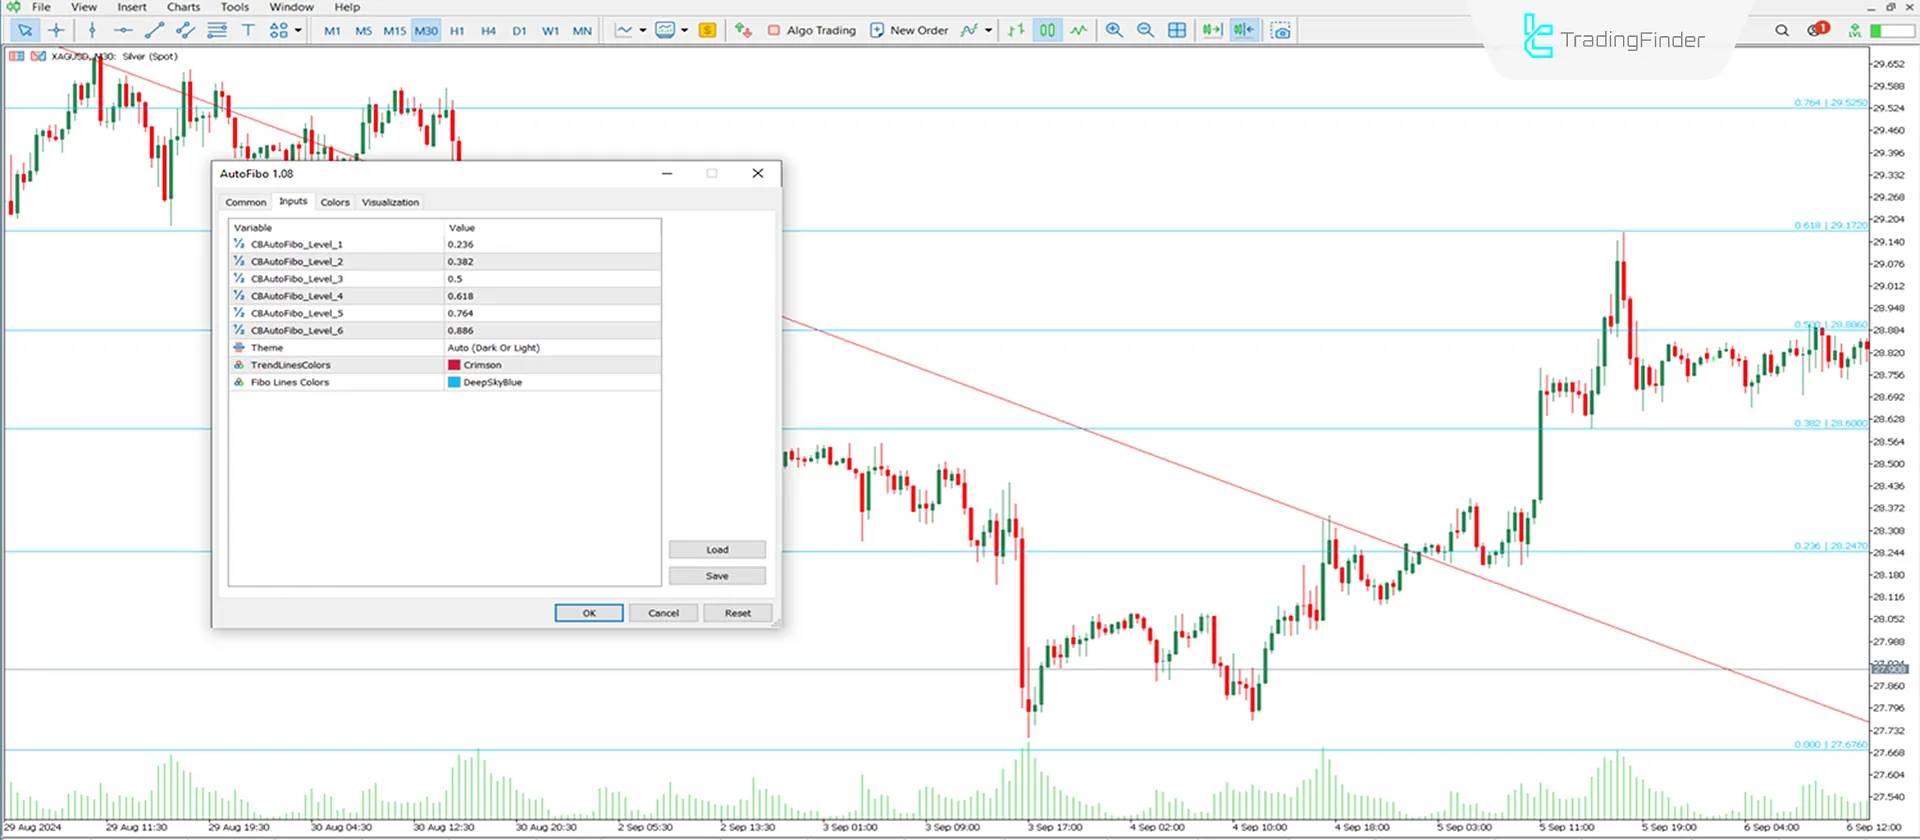
- CB Auto Fibo _ level _ 1: Fibonacci level set at 0.236;
- CB Auto Fibo _ level _ 2: Fibonacci level set at 0.382;
- CB Auto Fibo _ level _ 3: Fibonacci level set at 0.5;
- CB Auto Fibo _ level _4: Fibonacci level set at 0.618;
- CB Auto Fibo _ level _ 5: Fibonacci level set at 0.764;
- CB Auto Fibo _ level _ 6: Fibonacci level set at 0.886;
- Theme: Changes related to the background color;
- Trend Lines Colors: To change the Fibonacci trend line colors;
- FiboL Colors: To change Fibonacci line colors.
Conclusion
The Auto Fibonacci indicator, as a MT5 levels indicator, plots precise Fibonacci levels by considering the highs and lows, reducing the time required for price chart analysis. Additionally, this indicator provides traders with suitable entry and exit points.
This indicator can be used in all trading markets, including Crypto, Forex, and Stocks.
Auto Fibo MT5 PDF
Auto Fibo MT5 PDF
Click to download Auto Fibo MT5 PDFWhat trading styles is the Auto Fibonacci Indicator suitable for?
This indicator can be used in all trading styles but performs better in intra-day trading styles.
How does the Auto Fibonacci Indicator assist traders in analyzing price charts?
By considering peak and low points, this indicator forms areas where price reversal is highly probable.


