![Auto TrendLines Indicator for MT5 Download – Free – [TradingFinder]](https://cdn.tradingfinder.com/image/534315/13-202-en-auto-trendlines-mt5-01.webp)
![Auto TrendLines Indicator for MT5 Download – Free – [TradingFinder] 0](https://cdn.tradingfinder.com/image/534315/13-202-en-auto-trendlines-mt5-01.webp)
![Auto TrendLines Indicator for MT5 Download – Free – [TradingFinder] 1](https://cdn.tradingfinder.com/image/611108/13-202-en-auto-trendlines-mt5-02.webp)
![Auto TrendLines Indicator for MT5 Download – Free – [TradingFinder] 2](https://cdn.tradingfinder.com/image/611116/13-202-en-auto-trendlines-mt5-03.webp)
![Auto TrendLines Indicator for MT5 Download – Free – [TradingFinder] 3](https://cdn.tradingfinder.com/image/534304/13-202-en-auto-trendlines-mt5-04.webp)
The Auto TrendLines Indicator automatically plots ascending and descending trendlines on the chart, eliminating the need for manual intervention.
This tool accurately analyzes price highs and lows, drawing organized and practical lines that clearly display the overall market direction.
Specifications Table of Auto TrendLines Indicator
The specifications of the Auto TrendLines Indicator are presented in the table below:
Indicator Categories: | Support & Resistance MT5 Indicators Signal & Forecast MT5 Indicators Levels MT5 Indicators |
Platforms: | MetaTrader 5 Indicators |
Trading Skills: | Elementary |
Indicator Types: | Breakout MT5 Indicators Reversal MT5 Indicators |
Timeframe: | Multi-Timeframe MT5 Indicators |
Trading Style: | Swing Trading MT5 Indicators Scalper MT5 Indicators Day Trading MT5 Indicators |
Trading Instruments: | Forex MT5 Indicators Crypto MT5 Indicators Stock MT5 Indicators Commodity MT5 Indicators Indices MT5 Indicators Share Stock MT5 Indicators |
Auto TrendLines Indicator at a Glance
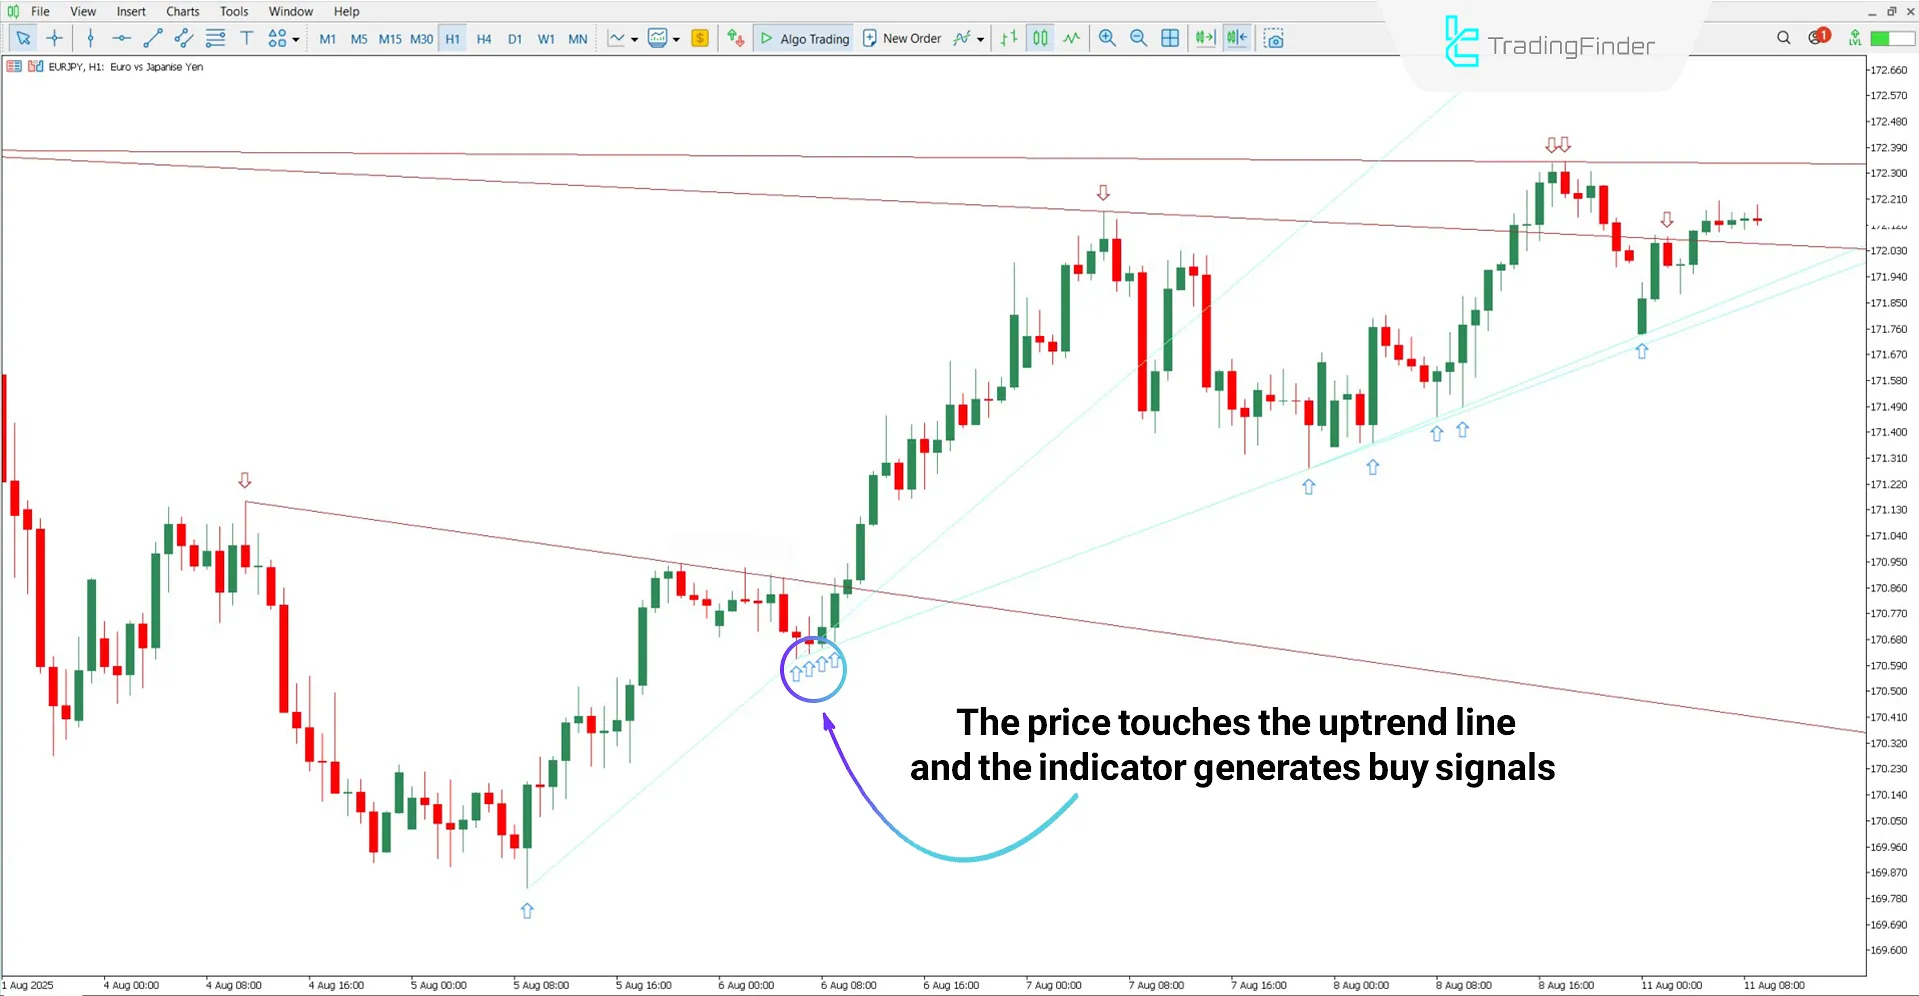
The Automatic Trendline Indicator marks ascending support lines in blue and descending resistance lines in red on the chart.
Additionally, when the price retraces to or breaks through these lines, the indicator provides buy or sell signals to the user according to the trend direction.
Buy Signal
Based on the EUR/JPY chart in the 1-hour timeframe, the price has retraced to the uptrend line and touched it.
The indicator detects this price retracement and issues a buy alert by displaying blue arrows on the chart.

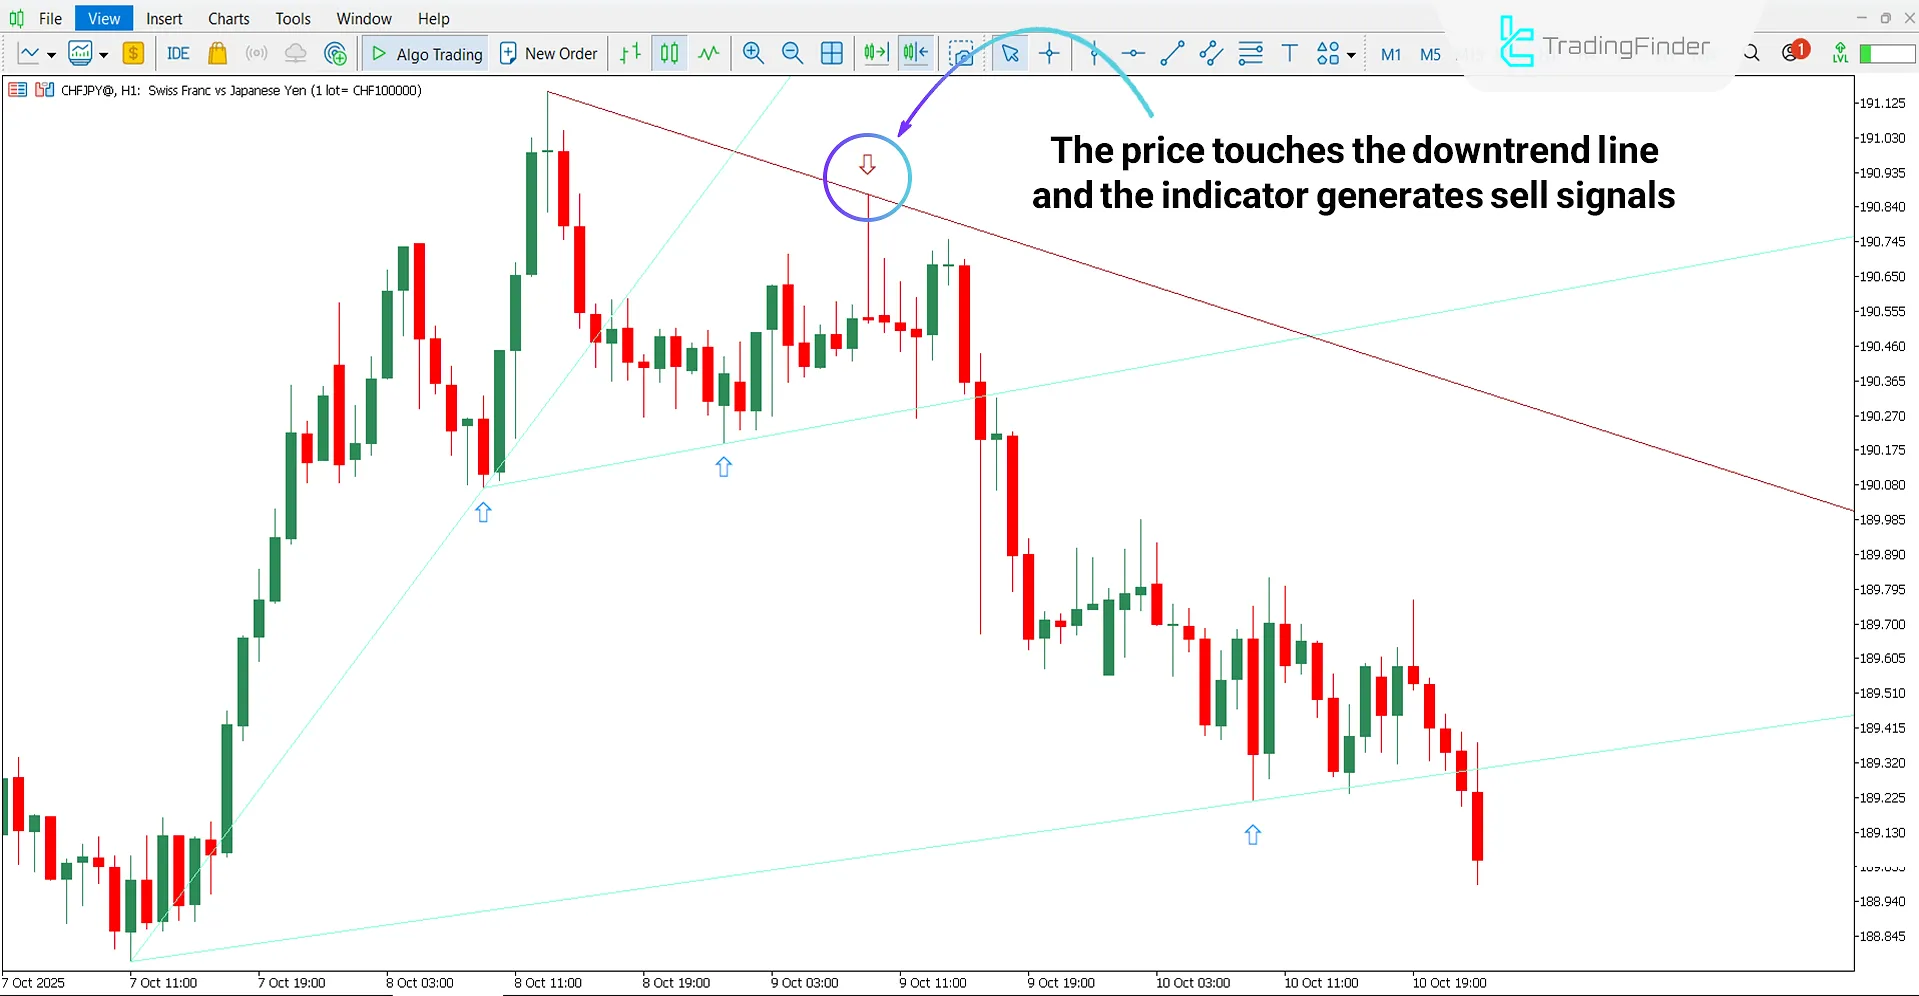
Sell Signal
According to the CHF/JPY chart in the 1-hour timeframe, the price has retraced to the downtrend line (resistance) and touched it.
Subsequently, the indicator immediately issues a sell alert by displaying a red arrow right after the contact.

Auto TrendLines Indicator Settings
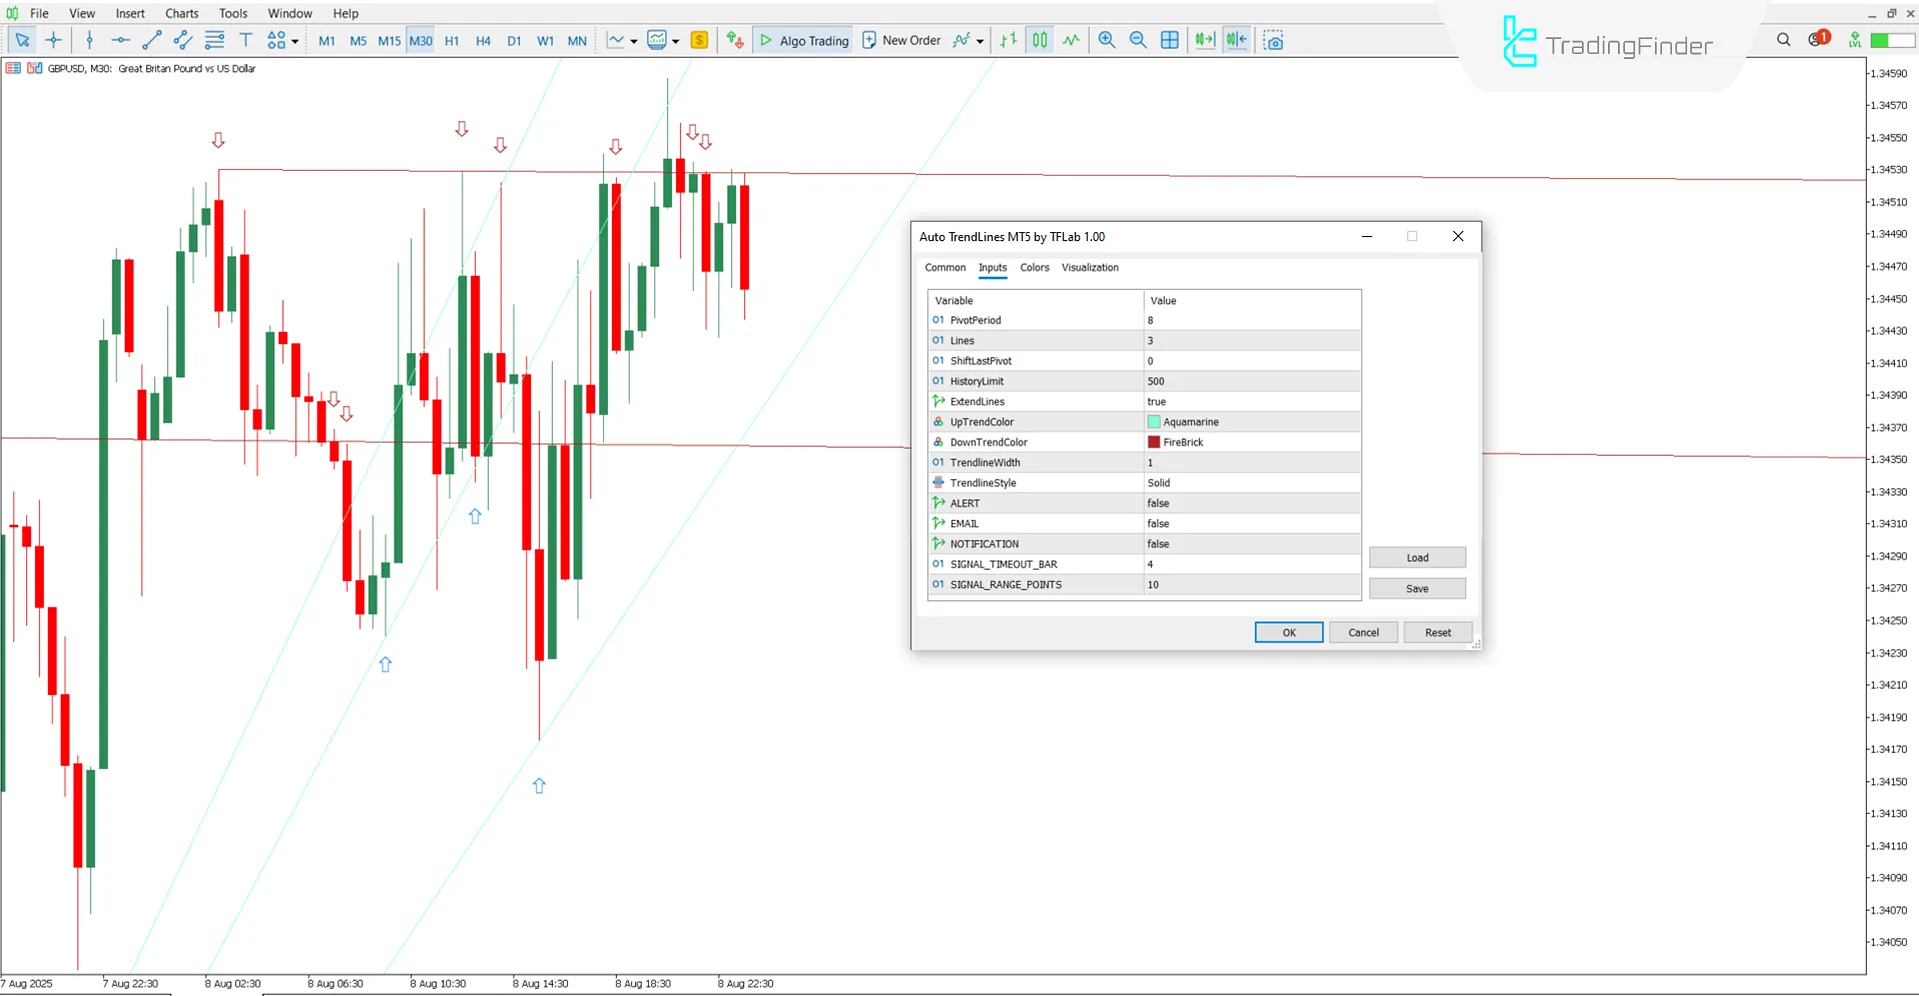
The settings of the Auto TrendLines Indicator are as follows:

- PivotPeriod: Period number for pivot point detection
- Lines: Number of trendlines to display
- ShiftLastPivot: Shift of the last pivot on chart
- HistoryLimit: Limit of past candlesticks analyzed
- ExtendLines: Extension of trendlines across chart
- ShowArrows: Display of arrows on pivot points
- UpTrendColor: Color of ascending trendlines
- DownTrendColor: Color of descending trendlines
- TrendlineWidth: Thickness of trendlines
- ShowAlerts: Display of alerts on chart
- EmailAlert: Alert sent to email
- NOTIFICATION: Notification sent to device or platform
- MESSAGE_TIMEOUT: Duration of alert message display
- MESSAGE_SUBJECT: Title of alert or notification message
Conclusion
The Automatic Trendline Indicator automatically draws uptrend and downtrend lines on the chart using pivot points.
By accurately detecting support and resistance levels, this indicator simplifies the identification of key price reaction zones, and when the price either breaks or retraces to these lines, it provides corresponding buy or sell signals.
Auto TrendLines Indicator for MT5 PDF
Auto TrendLines Indicator for MT5 PDF
Click to download Auto TrendLines Indicator for MT5 PDFCan this indicator be used in the cryptocurrency market?
Yes, the Auto TrendLines Indicator can be used in all markets without any restrictions.
When are sell signals issued?
The Auto TrendLines Indicator issues a sell signal when an ascending trendline is broken by price.


