![BMI Long Oscillator for MT5 Download – Free – [TradingFinder]](https://cdn.tradingfinder.com/image/571169/13-224-en-bmi-long-mt5-01.webp)
![BMI Long Oscillator for MT5 Download – Free – [TradingFinder] 0](https://cdn.tradingfinder.com/image/571169/13-224-en-bmi-long-mt5-01.webp)
![BMI Long Oscillator for MT5 Download – Free – [TradingFinder] 1](https://cdn.tradingfinder.com/image/571180/13-224-en-bmi-long-mt5-02.webp)
![BMI Long Oscillator for MT5 Download – Free – [TradingFinder] 2](https://cdn.tradingfinder.com/image/571182/13-224-en-bmi-long-mt5-03.webp)
![BMI Long Oscillator for MT5 Download – Free – [TradingFinder] 3](https://cdn.tradingfinder.com/image/571181/13-224-en-bmi-long-mt5-04.webp)
The BMI Long Indicator, known as a combined tool in technical analysis, is designed by integrating several widely-used indicators.
This indicator includes a Moving Average Oscillator, MACD, Bollinger Bands, and Stochastic, each displayed with distinct colors.
BMI Long Oscillator Specifications Table
The specifications of the BMI Long Indicator are as follows:
Indicator Categories: | Oscillators MT5 Indicators Bands & Channels MT5 Indicators MACD Indicators for MetaTrader 5 |
Platforms: | MetaTrader 5 Indicators |
Trading Skills: | Intermediate |
Indicator Types: | Reversal MT5 Indicators |
Timeframe: | Multi-Timeframe MT5 Indicators |
Trading Style: | Swing Trading MT5 Indicators Scalper MT5 Indicators Day Trading MT5 Indicators |
Trading Instruments: | Forex MT5 Indicators Crypto MT5 Indicators Stock MT5 Indicators |
BMI Long Indicator at a Glance
The BMI Long Oscillator displays its components using different lines and colors on the chart:
- Blue Line: Moving Average Oscillator (OSMA)
- White Line: Moving Average Convergence Divergence (MACD)
- Pink Line: Signal Line
- Orange Band: Upper Bollinger Band
- Green Band: Lower Bollinger Band
- Yellow Line: Zero Line as a trend reference
- Colored Histogram: Shows trend strength and direction
Bullish Trend Conditions
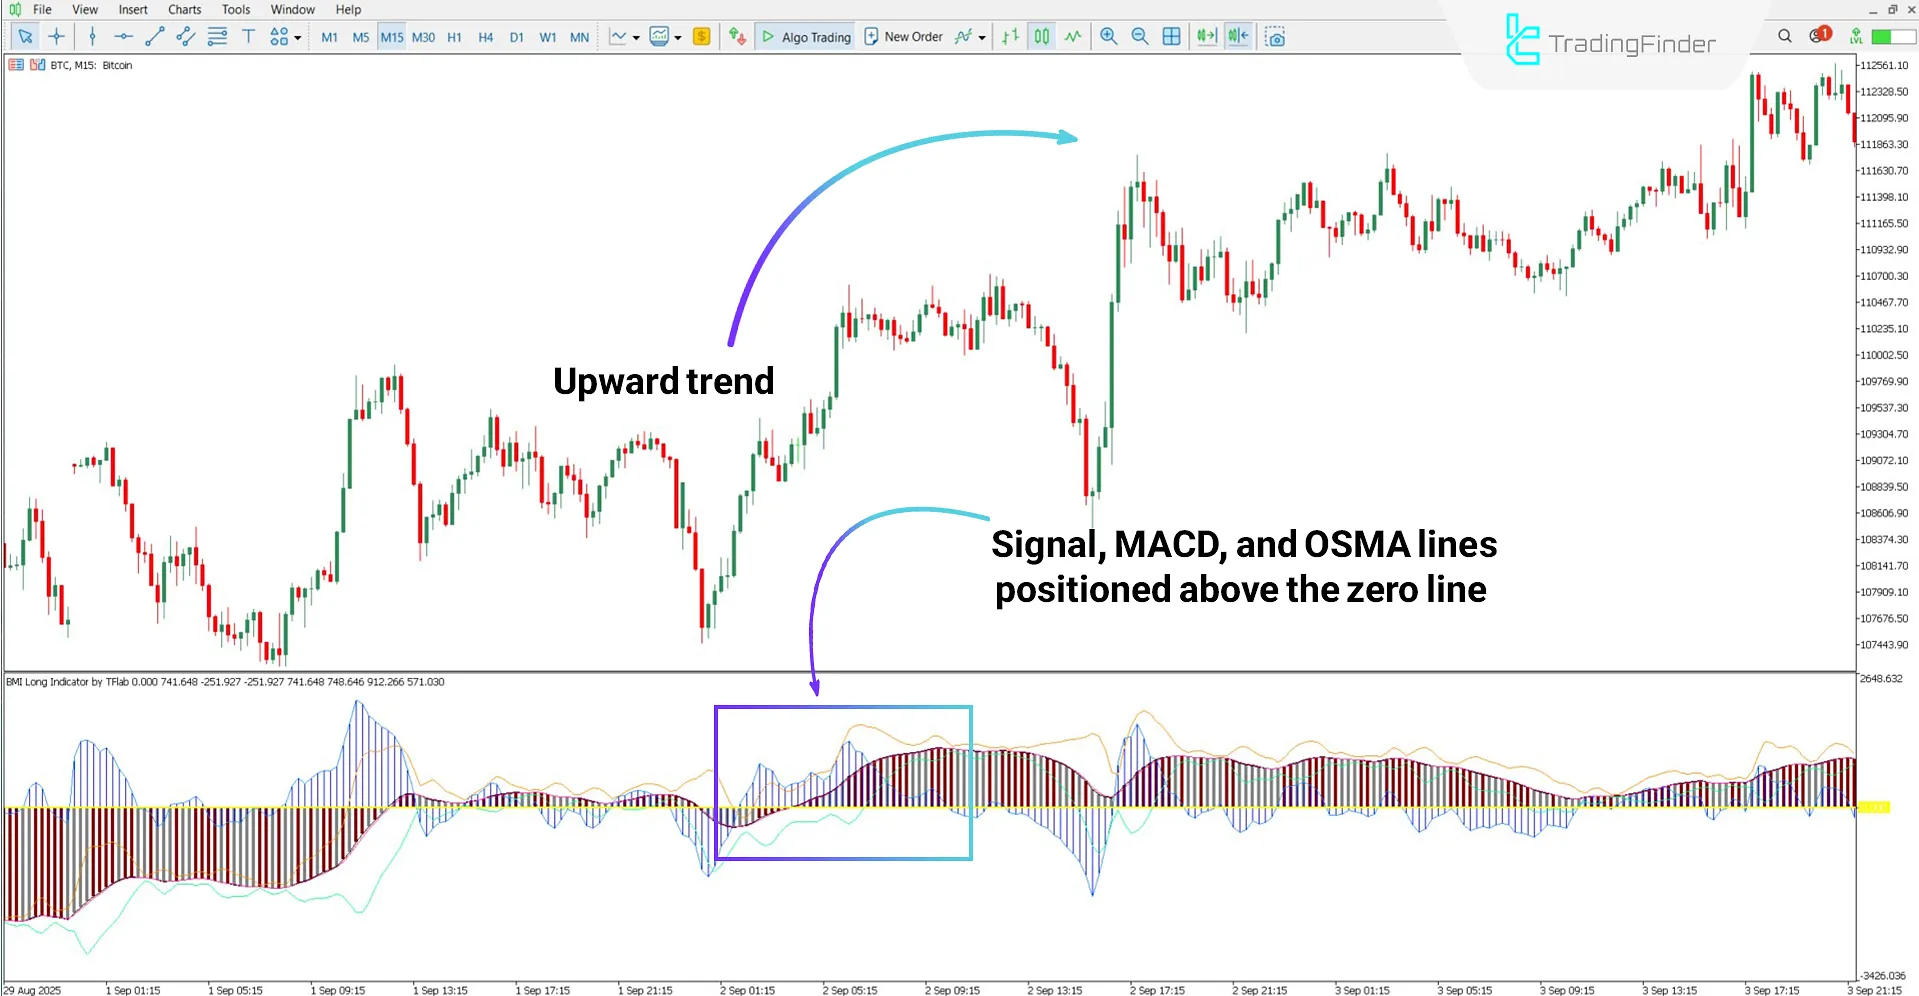
Based on the Bitcoin (BTC) 15-minute chart, the Signal Line along with MACD and OSMA lines are positioned above the zero level.
This situation is usually interpreted as a sign of strengthening bullish trend and a suitable buy signal.

Bearish Trend Conditions
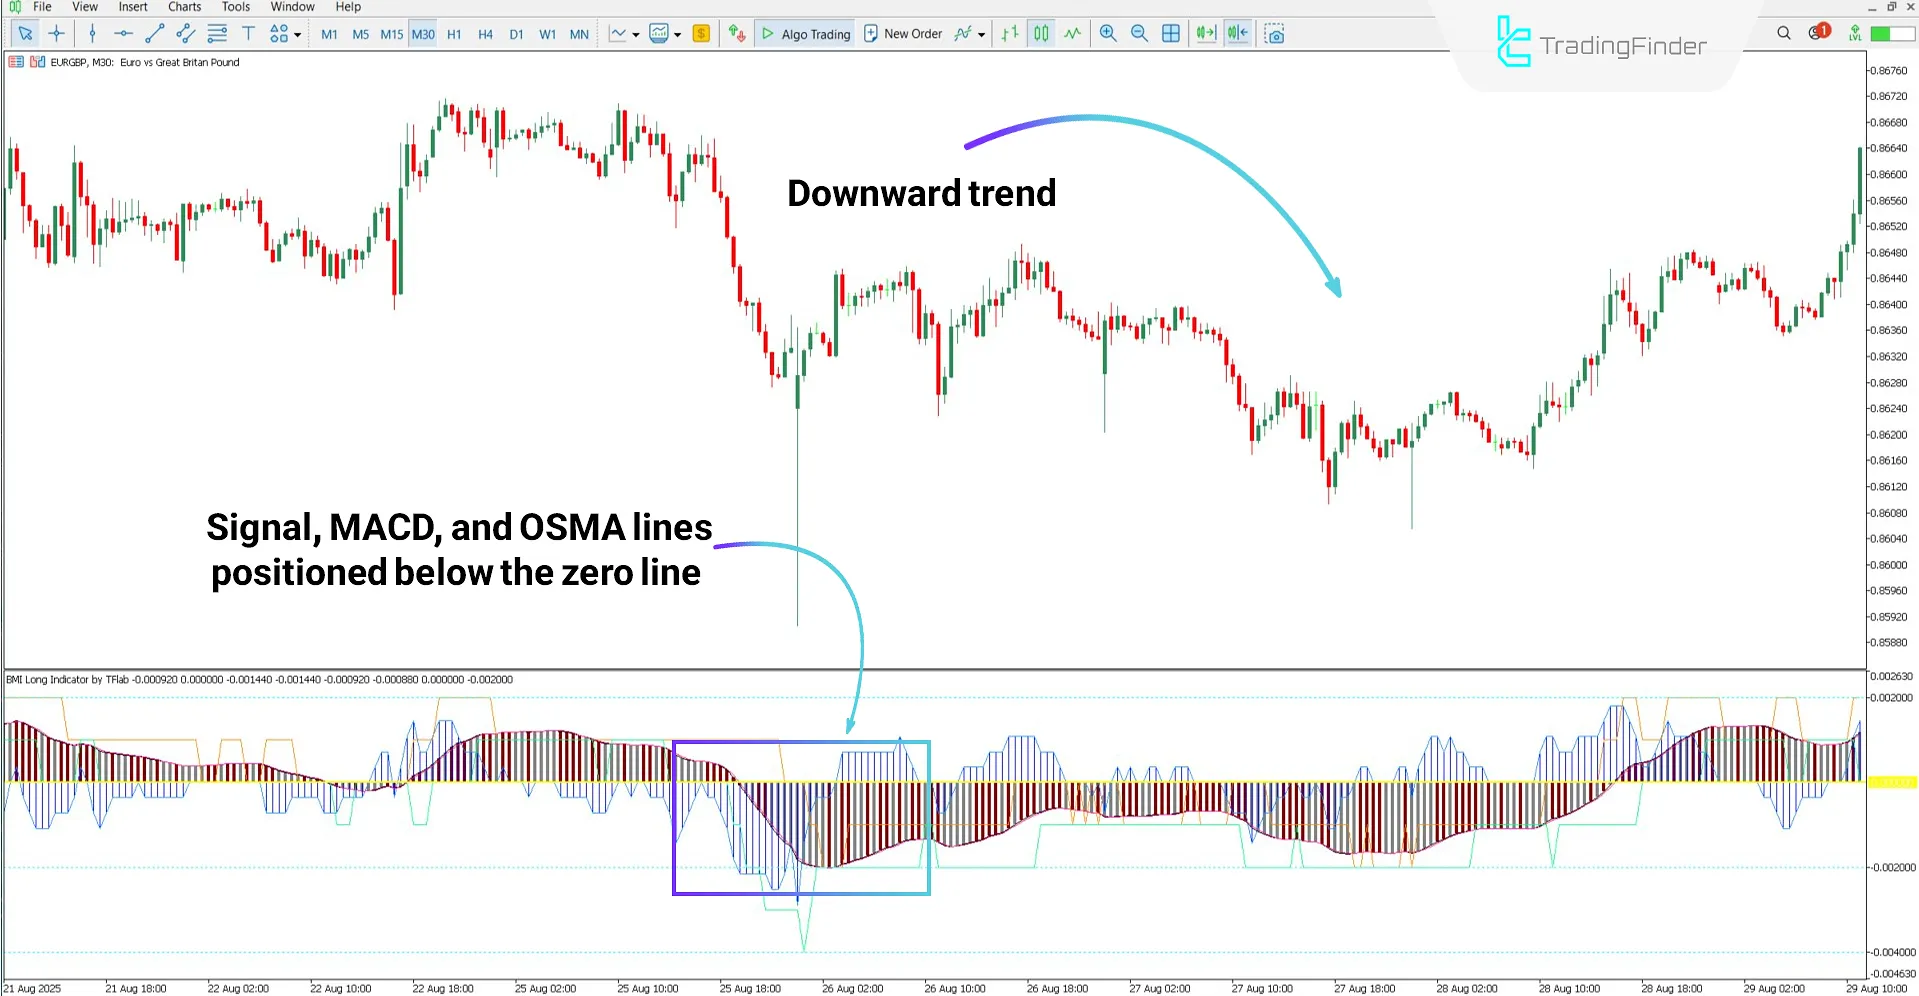
According to the EUR/GBP 30-minute chart, the downward crossing of the Signal Line along with OSMA and MACD lines from the zero line indicates bearish pressure.
This condition can also be considered as a sign of the start of a downward movement.

BMI Long Oscillator Settings
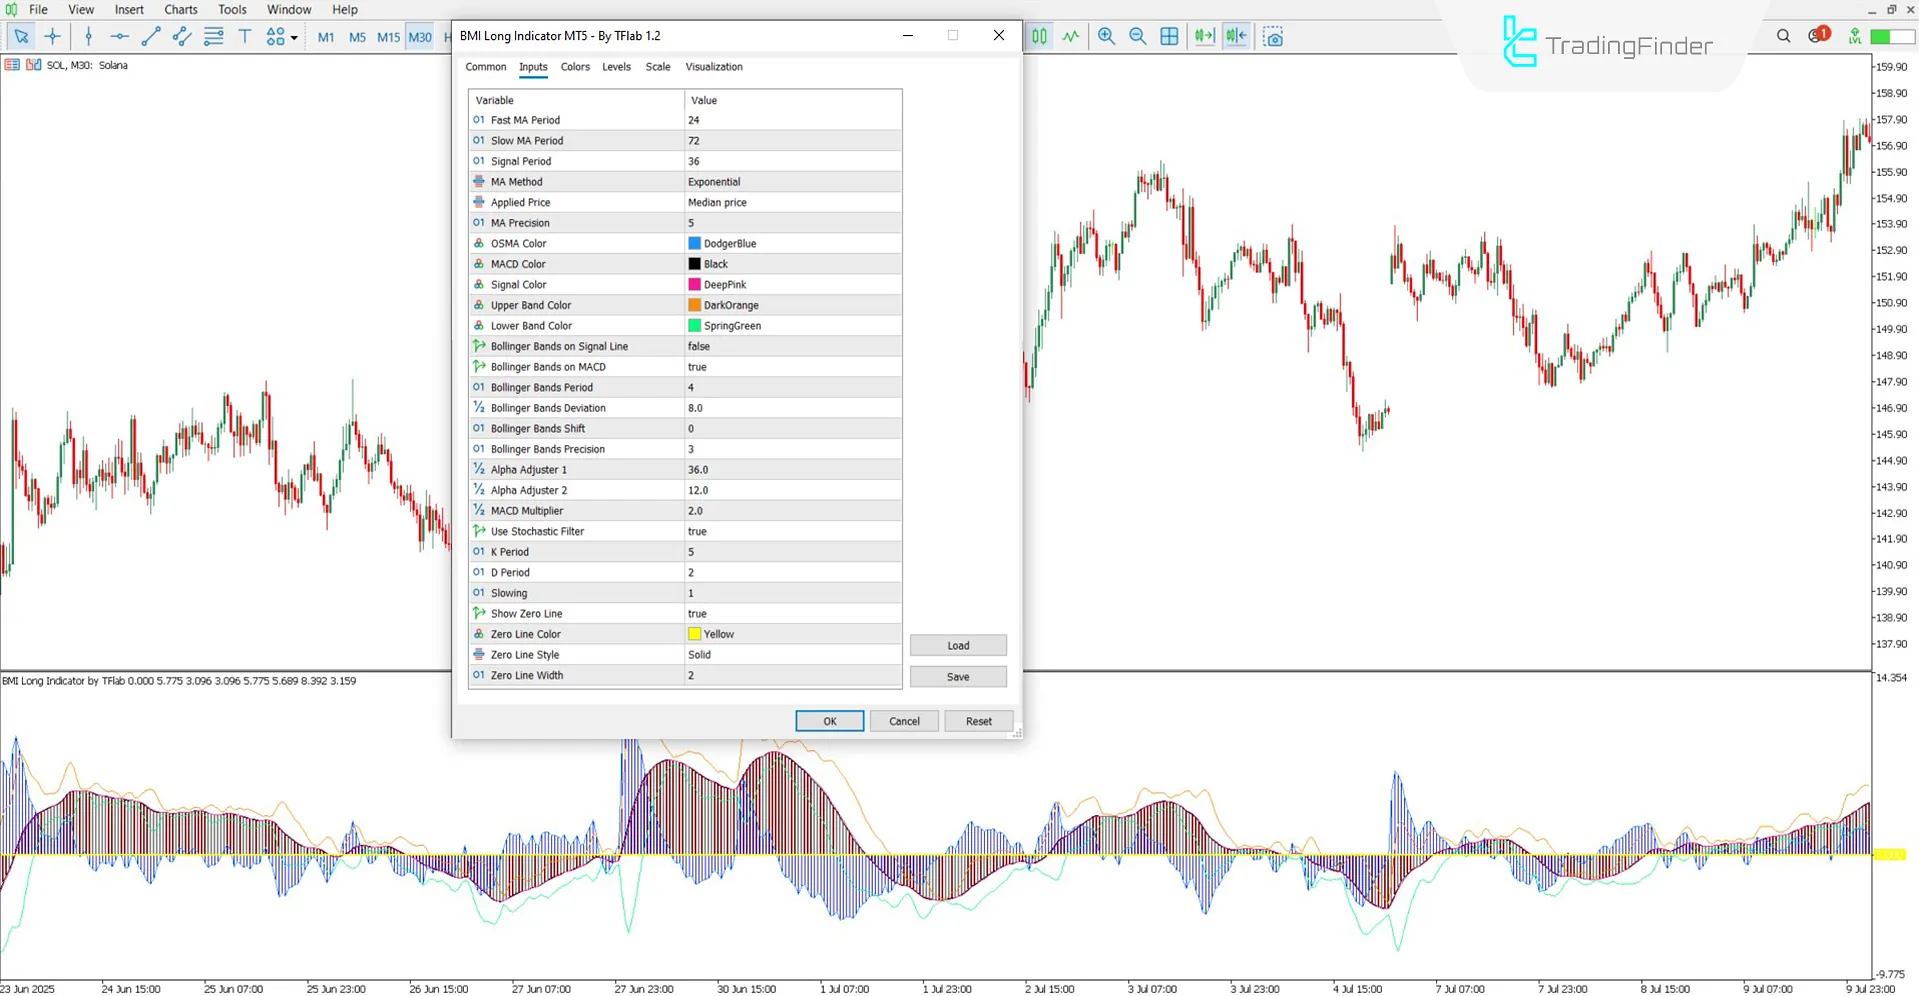
The settings of the BMI Long Indicator are as follows:

- FastMAPeriod: Fast moving average period
- SlowMAPeriod: Slow moving average period
- SignalMAPeriod: Signal line period
- MAmethod: Moving average calculation method
- MAprice: Price type used in moving average
- MAprecision: Moving average calculation precision
- OsMAClr: OSMA line color
- MACDClr: MACD line color
- SIGNClr: Signal line color
- UBBClr: Upper Bollinger Band color
- LBBClr: Lower Bollinger Band color
- BBonSignal: Bollinger Band signal activation
- BBonMACDline: Bollinger Band on MACD line activation
- BBperiod: Bollinger Band calculation period
- BBdeviation: Bollinger Band standard deviation
- BBshift: Bollinger Band chart shift
- BBprecision: Bollinger Band calculation precision
- Alpha_adjuster1: First alpha adjustment factor
- Alpha_adjuster2: Second alpha adjustment factor
- MACD_Multiplier: MACD multiplier factor
- UseStochFilter: Stochastic filter usage
- Kperiod: Stochastic K period
- Dperiod: Stochastic D period
- Slowing: Stochastic slowing value
- ShowZeroLine: Zero line display
- ZeroLineColor: Zero line color
- ZeroLineStyle: Zero line style
- ZeroLineWidth: Zero line width
Conclusion
The BMI Long Oscillator, using colored histogram and auxiliary lines, visualizes market trend strength and direction.
The most important component is the Zero Line, with line crossings above or below it considered as buy or sell signals.
Additionally, the indicator settings allow modification of colors and periods to align with the trader’s personal strategy.
BMI Long Oscillator for MT5 Download PDF
BMI Long Oscillator for MT5 Download PDF
Click to download BMI Long Oscillator for MT5 Download PDFIs this tool usable in long-term timeframes?
Yes, the BMI Long Oscillator is multi-timeframe and usable across all timeframes.
Does this indicator define take profit and stop loss levels?
No, take profit and stop loss levels must be determined by the traders themselves.


