![Download the Bollinger Bands MACD Indicator for MT5 - Free - [TFlab]](https://cdn.tradingfinder.com/image/154047/4-21-en-bollinger-bands-macd-mt5-1.webp)
![Download the Bollinger Bands MACD Indicator for MT5 - Free - [TFlab] 0](https://cdn.tradingfinder.com/image/154047/4-21-en-bollinger-bands-macd-mt5-1.webp)
![Download the Bollinger Bands MACD Indicator for MT5 - Free - [TFlab] 1](https://cdn.tradingfinder.com/image/154045/4-21-en-bollinger-bands-macd-mt5-2.webp)
![Download the Bollinger Bands MACD Indicator for MT5 - Free - [TFlab] 2](https://cdn.tradingfinder.com/image/154044/4-21-en-bollinger-bands-macd-mt5-3.webp)
![Download the Bollinger Bands MACD Indicator for MT5 - Free - [TFlab] 3](https://cdn.tradingfinder.com/image/154046/4-21-en-bollinger-bands-macd-mt5-4.webp)
The Bollinger Bands MACD indicator is one of the MetaTrader 5 indicators, designed by combining two powerful tools, MACD and Bollinger Bands, and is used to identify reversal points and trend continuations in trading.
Bollinger Bands displays price volatility, while MACD analyzes trend strength and direction. Buy and Sell signals are generated when the MACD line crosses the Bollinger Bands.
Indicator Table
Indicator Categories: | Oscillators MT5 Indicators Currency Strength MT5 Indicators Bands & Channels MT5 Indicators MACD Indicators for MetaTrader 5 |
Platforms: | MetaTrader 5 Indicators |
Trading Skills: | Intermediate |
Indicator Types: | Trend MT5 Indicators Leading MT5 Indicators Reversal MT5 Indicators |
Timeframe: | Multi-Timeframe MT5 Indicators |
Trading Style: | Intraday MT5 Indicators |
Trading Instruments: | Forex MT5 Indicators Crypto MT5 Indicators Share Stock MT5 Indicators Binary Options MT5 Indicators |
Indicator Overview
This indicator displays Buy or Sell signals to traders when the MACD line crosses the Bollinger Bands.
When price volatility decreases, the bands come closer together. Conversely, when price volatility increases, the bands move further apart.
The Bollinger Bands MACD Indicator comprises three main components: MACD, Bollinger Bands, and a combined signaling system. Integrating MACD and Bollinger Bands in this indicator provides traders with an advanced trend analysis and decision-making tool.
Indicator in an Uptrend
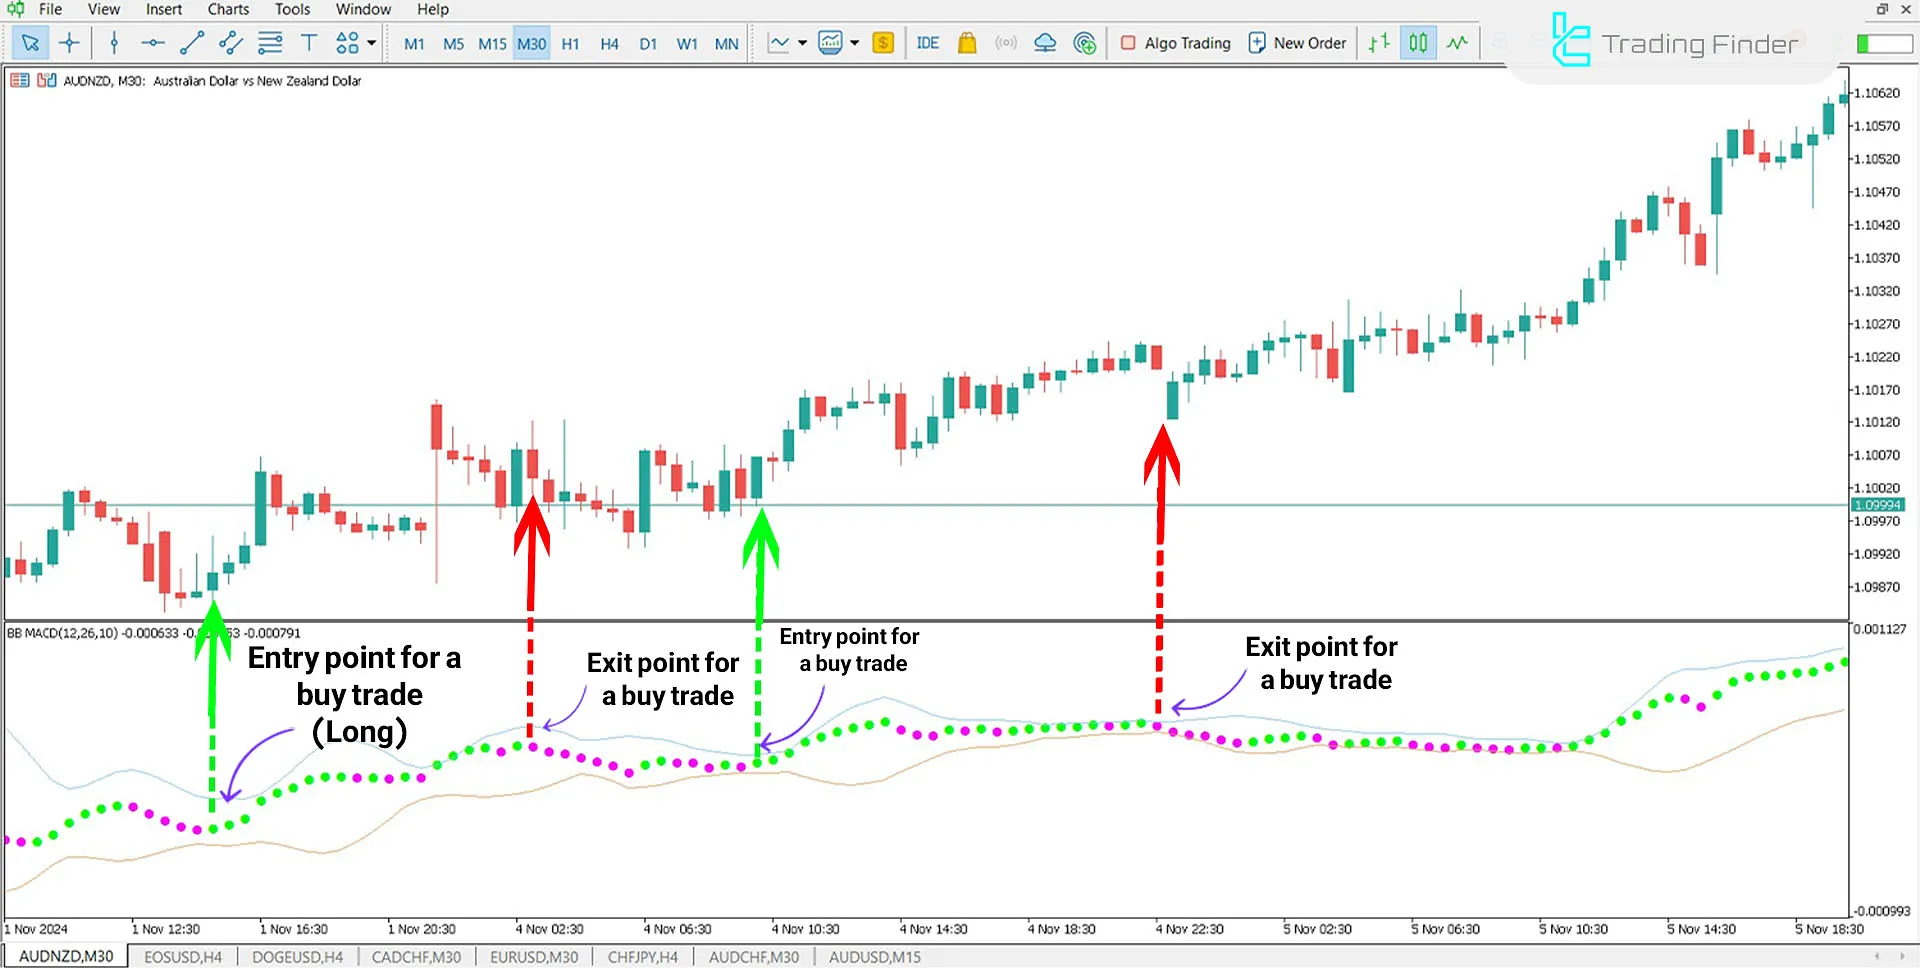
The image shows that the AUD/NZD currency pair is displayed inin a 30-minute timeframe.
If the price is a downtrend and the MACD line crosses or breaks above the upper Bollinger Band, the MACD color changes from purple to green.
Traders can consider the potential for a price reversal in these areas and, after receiving confirmations, enter a Buy trade.

Indicator in a Downtrend
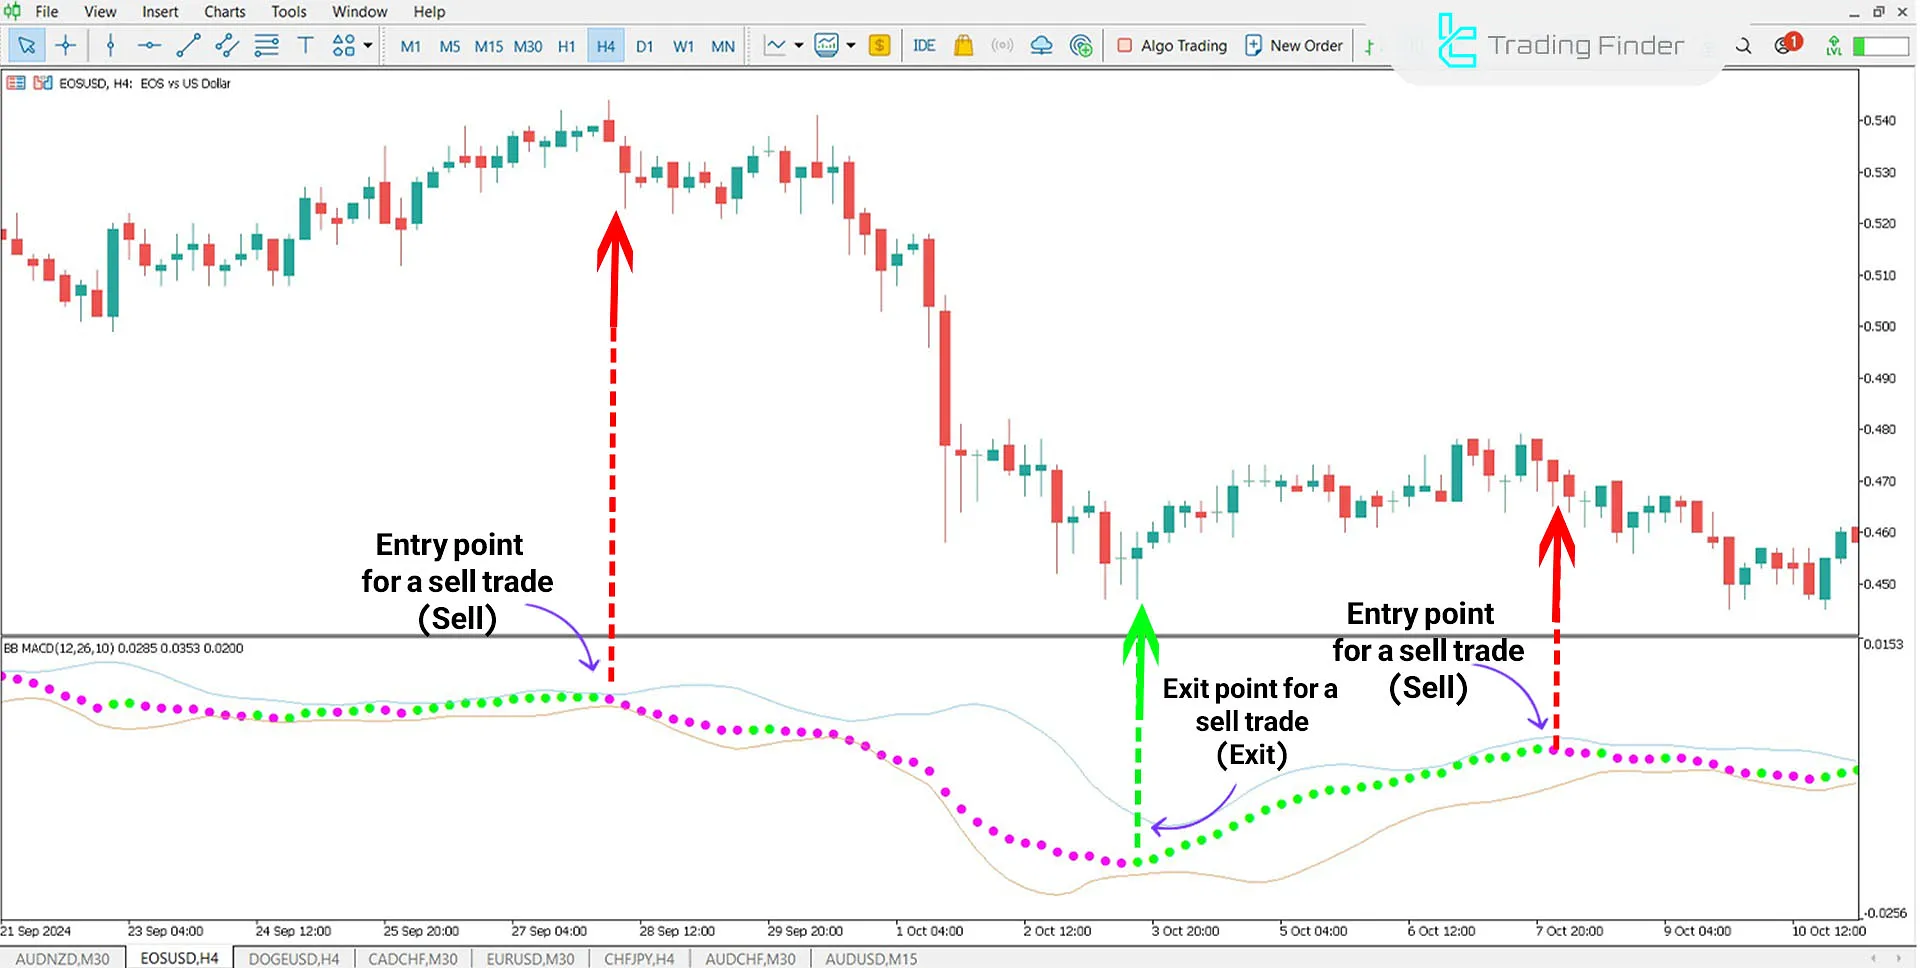
If the price is in an uptrend and the MACD line crosses or breaks above the upper Bollinger Band, the MACD line color changes from green to purple.
This situation can indicate overbought conditions in the market and the possibility of a price decline.
The chart below shows theEOS cryptocurrency in a 4-hour timeframe. Sell zones are highlighted in purple, and traders can enter a Sell trade after receiving the necessary confirmations.

Indicator Settings

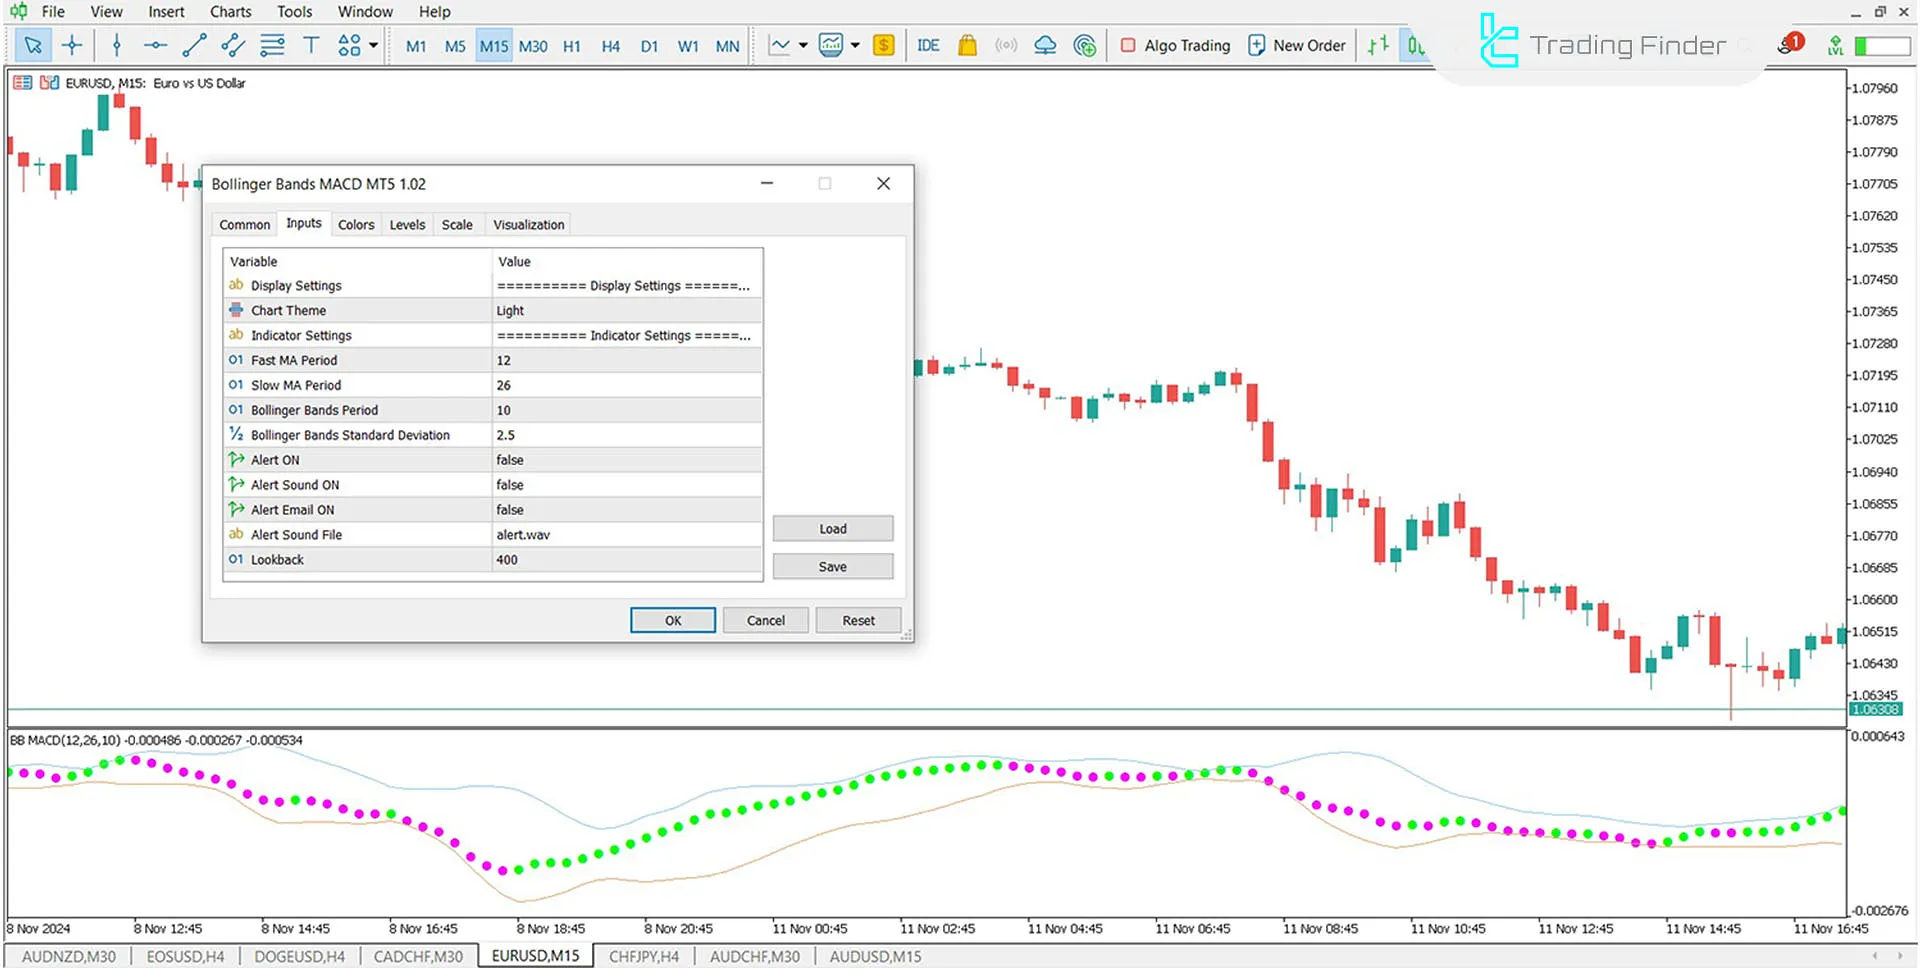
- Chart Theme: Background color of the chart
- Fast ma period: Fast MACD calculation period (default: 12)
- Slow ma period: Slow MACD calculation period (default: 26)
- bb period: Bollinger Bands calculation period (default: 10)
- Bb std: Bollinger Bands standard deviation (default: 2.5)
- Alert: Alerts traders when MACD intersects Bollinger Bands
- Alert email: Sends an email alert to traders when MACD intersects Bollinger Bands
- Sound file: Sound for alert notifications
- Look back: at the number of candles displayed by the indicator in the past
Conclusion
The Bollinger Bands MACD Indicator has two main lines and the MACD centerline.
Traders use the Bollinger Bands indicator to determine entry points for trades, and alongside it, they can utilize Levels Indicators for better analysis.
the Bollinger Bands MACD MT5 PDF
the Bollinger Bands MACD MT5 PDF
Click to download the Bollinger Bands MACD MT5 PDFWhat is the Bollinger Bands MACD Indicator?
This indicator combines two powerful tools: MACD and Bollinger Bands. Identifying reversal points and trend continuations helps traders make better Buy and Sell decisions.
How can I download and install this indicator?
To download and install, visit the Trading Finder website and visit the MetaTrader 5 indicators section. You can download and install it for free.


