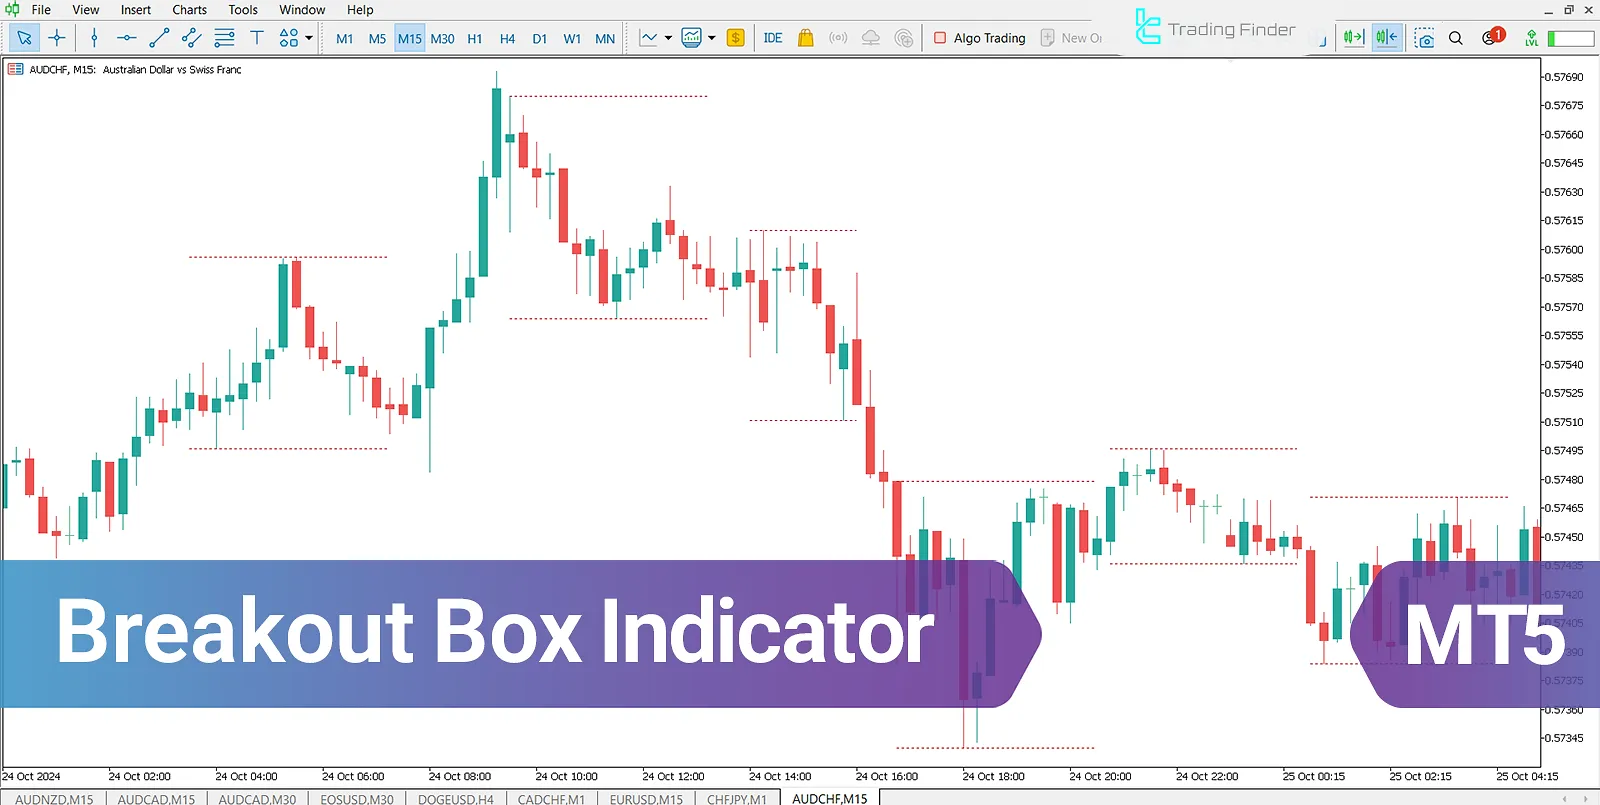


The Breakout Box (BB) Indicator is a tool for drawing price range zones on the MetaTrader 5 (MT5) trading platform. The BB Indicator displays key price ranges using two horizontal blue lines (default settings are red) on the chart.
These ranges act as support and resistance levels, and when these lines are broken, the price moves sharply.
BB Indicator Table
Indicator Categories: | Support & Resistance MT5 Indicators Trading Assist MT5 Indicators Levels MT5 Indicators |
Platforms: | MetaTrader 5 Indicators |
Trading Skills: | Elementary |
Indicator Types: | Range MT5 Indicators Lagging MT5 Indicators Breakout MT5 Indicators |
Timeframe: | M15-M30 Timeframe MT5 Indicators H1-H4 Timeframe MT5 Indicators |
Trading Style: | Intraday MT5 Indicators Scalper MT5 Indicators Day Trading MT5 Indicators |
Trading Instruments: | Forex MT5 Indicators Commodity MT5 Indicators Indices MT5 Indicators |
Indicator at a Glance
The Breakout Box Indicator is a trading tool for traders looking to identify range-bound zones and their respective highs and lows. By drawing two lines above and below the price, it defines a clear range that traders can use to enter or exit trades.
Additionally, these levels can serve as support and resistance, with a breakout from these levels often signaling a potential strong price movement.
Breaking the Price Ceiling
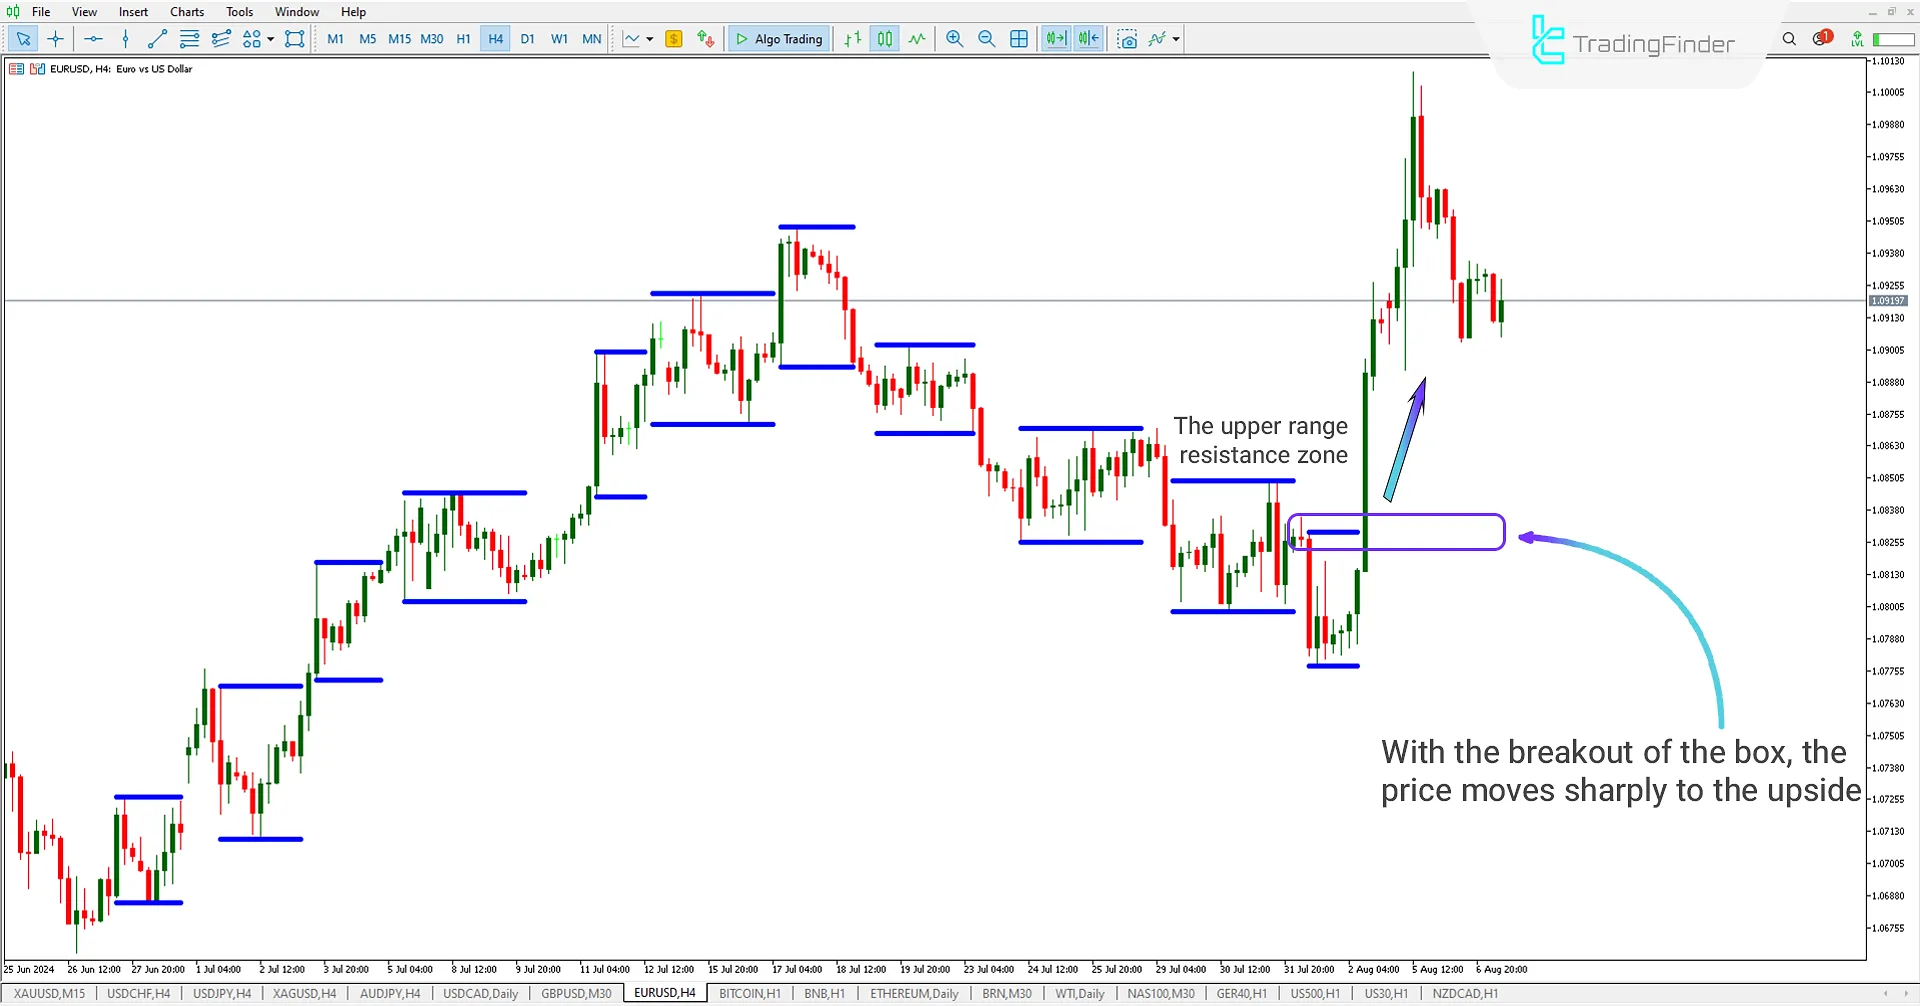
In the 4-hour EUR/USD chart, the BB Indicator identifies key price levels by drawing high and low lines.
When the price breaks the 1.08295 range, the price movement begins, and the market sharply enters an uptrend. Traders can enter a buy trade upon observing the breakout of the ceiling range.

Breaking the Price Floor
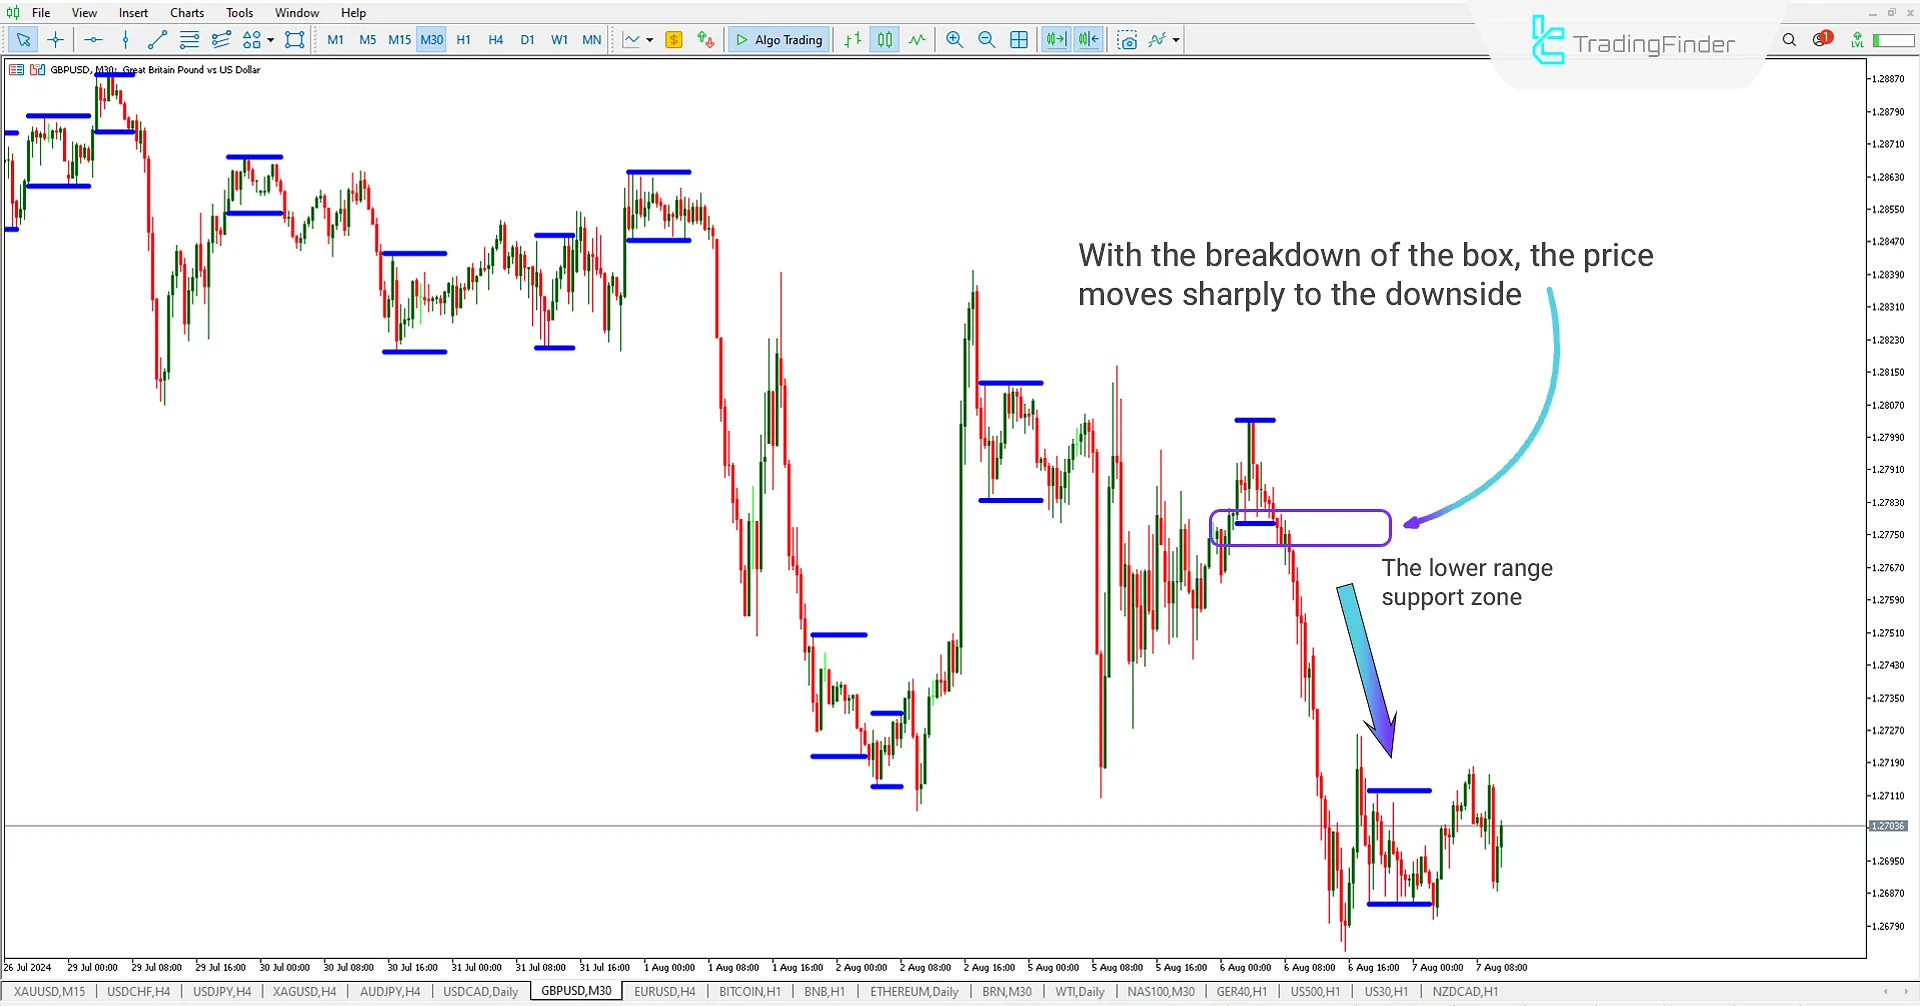
In the 30-minute GBP/USD chart, the BB Indicator highlights key price levels by drawing horizontal lines on the chart.
When the price breaks the 1.27775 range, the price movement begins, and the market enters a downtrend. Traders can enter a Sell trade upon observing the breakout of the floor range.

BB Indicator Settings

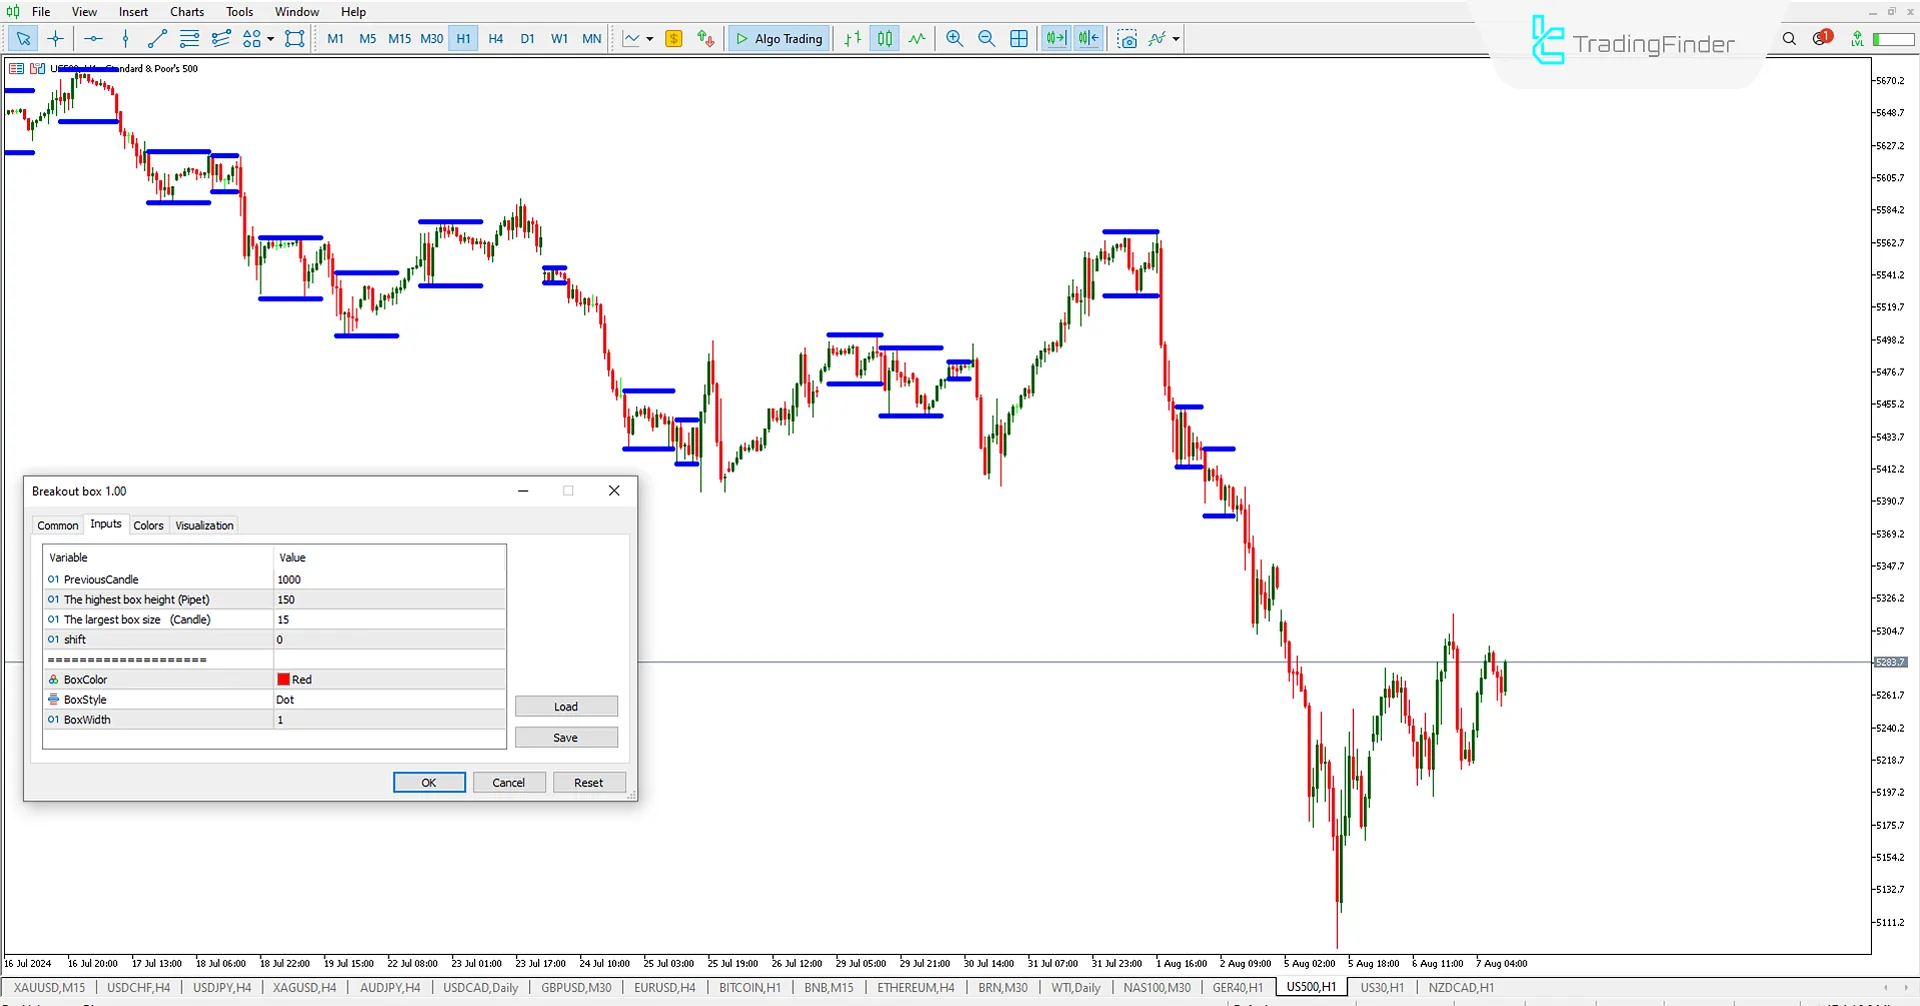
- PreviousCandle: Number of candles displayed in the past
- The highest box height (Pipet): Set the range height based on pipet
- The largest box size (Candle): Number of candles per box
- Shift: Set the calculation starting point from which candle
- BoxColor: Choose the box line color
- BoxStyle: Select the line drawing type
- Box Width: Set the line width
Conclusion
The Breakout Box (BB) Indicator as a MT5 Trading Assist indicator, draws horizontal lines on the chart to show key price ranges. Traders can use these price ranges to enter Buy or Sell trades when the price breaks the ceiling or floor levels.
Breakout Box BB indicator MT5 PDF
Breakout Box BB indicator MT5 PDF
Click to download Breakout Box BB indicator MT5 PDFWhat is the Breakout Box Indicator (BB)?
The Breakout Box Indicator identifies potential breakout areas in price charts. It shows a range of prices where, if broken, there is a likelihood of strong price movement.
How does the Breakout Box Indicator (BB) work?
This indicator plots a range of prices using the highest and lowest points within a specified timeframe. When the price exits this range, it may indicate the start of a strong move in the breakout direction.


