![Brooky PSAR Levels Indicator in MetaTrader 5 – Free Download [TradingFinder]](https://cdn.tradingfinder.com/image/510155/2-130-en-brooky-psar-levels-mt5-1.webp)
![Brooky PSAR Levels Indicator in MetaTrader 5 – Free Download [TradingFinder] 0](https://cdn.tradingfinder.com/image/510155/2-130-en-brooky-psar-levels-mt5-1.webp)
![Brooky PSAR Levels Indicator in MetaTrader 5 – Free Download [TradingFinder] 1](https://cdn.tradingfinder.com/image/510154/2-130-en-brooky-psar-levels-mt5-2.webp)
![Brooky PSAR Levels Indicator in MetaTrader 5 – Free Download [TradingFinder] 2](https://cdn.tradingfinder.com/image/510153/2-130-en-brooky-psar-levels-mt5-3.webp)
![Brooky PSAR Levels Indicator in MetaTrader 5 – Free Download [TradingFinder] 3](https://cdn.tradingfinder.com/image/510156/2-130-en-brooky-psar-levels-mt5-4.webp)
The Brooky PSAR Levels indicator is an updated version of the classic Parabolic SAR in MetaTrader 5. In addition to identifying the trend direction, it also allows for the detection of dynamic support and resistance levels.
Unlike the basic PSAR, which only marks points above or below candles, this tool displays levels where price reactions have previously occurred and which represent significant zones of reversal or breakout under current market conditions.
Brooky PSAR Levels Indicator Table
The general features of the Brooky PSAR Levels indicator are presented in the table below:
Indicator Categories: | Support & Resistance MT5 Indicators Trading Assist MT5 Indicators Levels MT5 Indicators |
Platforms: | MetaTrader 5 Indicators |
Trading Skills: | Intermediate |
Indicator Types: | Breakout MT5 Indicators Reversal MT5 Indicators |
Timeframe: | Multi-Timeframe MT5 Indicators |
Trading Style: | Intraday MT5 Indicators |
Trading Instruments: | Forex MT5 Indicators Crypto MT5 Indicators Stock MT5 Indicators Commodity MT5 Indicators Indices MT5 Indicators Share Stock MT5 Indicators |
Brooky PSAR Levels Indicator at a Glance
The Brooky PSAR Levels indicator, based on PSAR calculations, identifies two key market levels and marks them on the chart with distinct colors:
- Resistance (Upper PSAR): In uptrends, when the price reaches this area, selling pressure often increases, which can cause the price to reverse or break the level and continue upward;
- Support (Lower PSAR): In downtrends, reaching this level is usually accompanied by increased demand, raising the likelihood of a rebound or a halt in decline.
This tool automatically updates the levels and can be used to determine entries, exits, or stop-loss placements in trades.
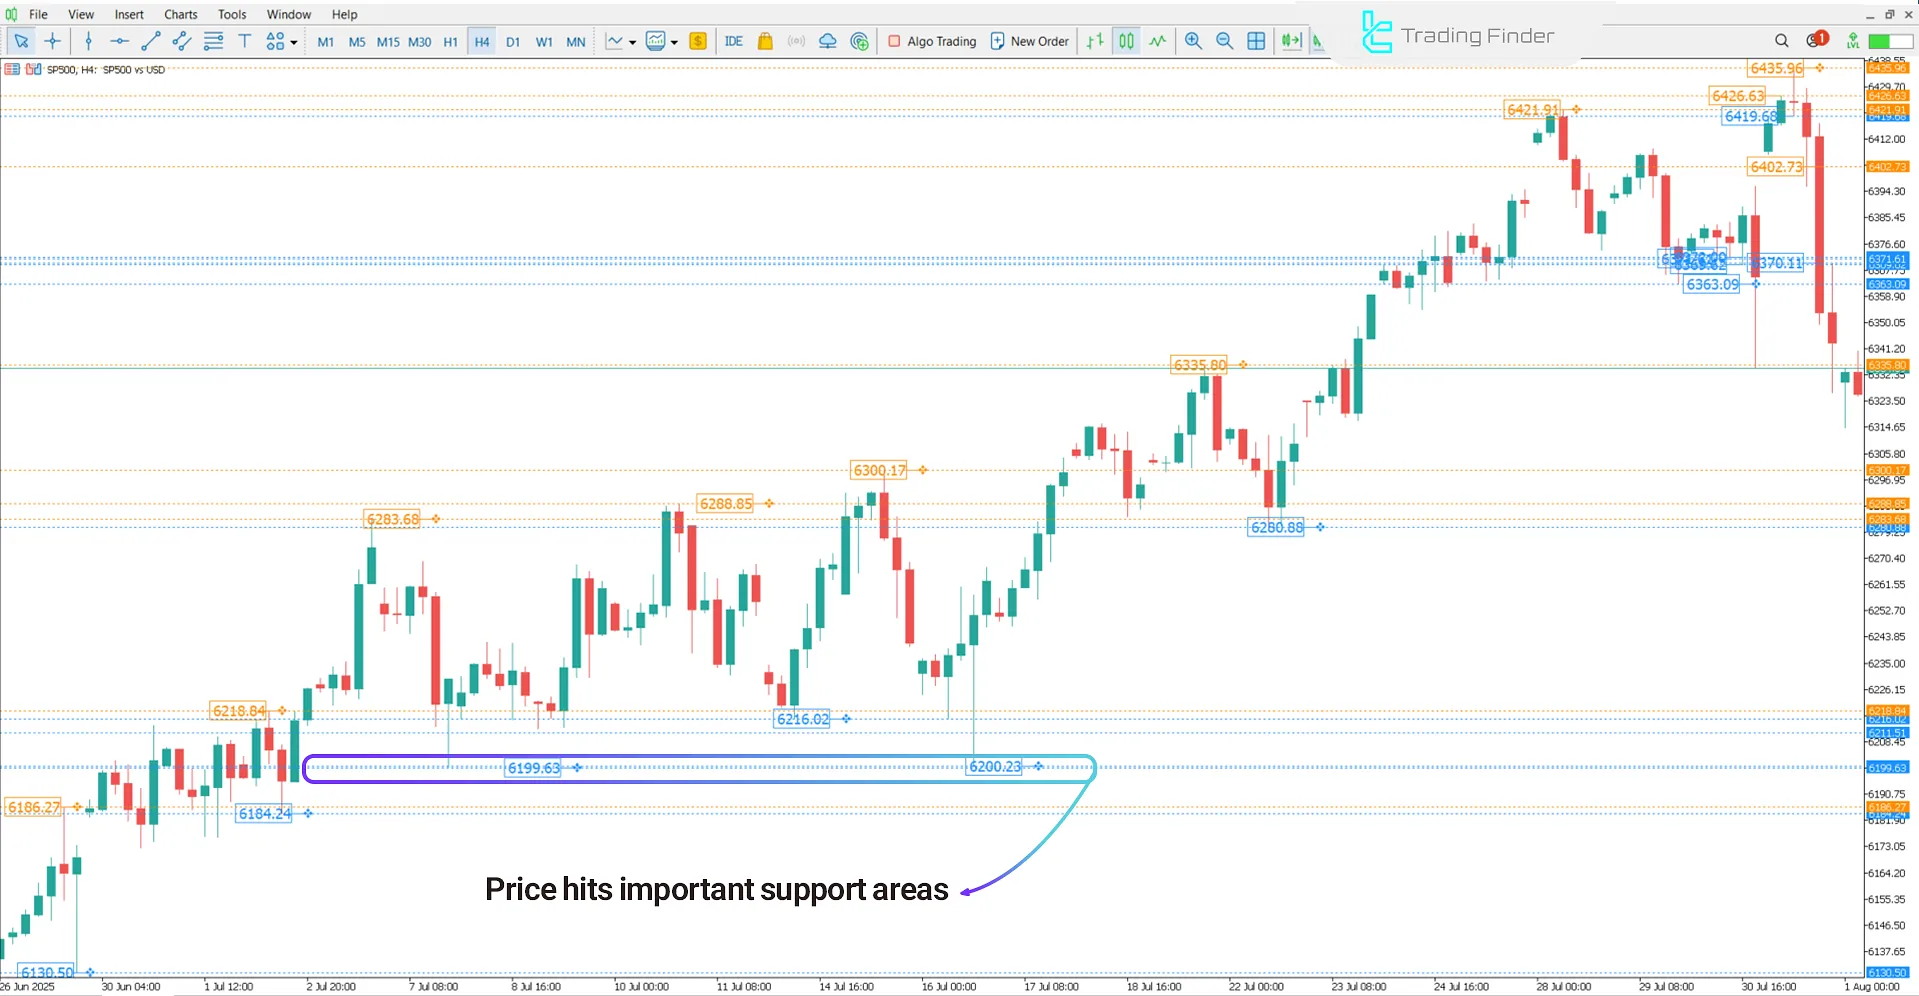
Indicator in an Uptrend
The chart below shows the S&P 500 index on the 4-hour timeframe. In a downtrend, as the price approaches a support level, signs of reduced selling pressure or a pause in the decline may appear.
If a positive reaction occurs – such as a reversal candlestick or a break of the downtrend line – suitable conditions for a buy-entry trade are created.

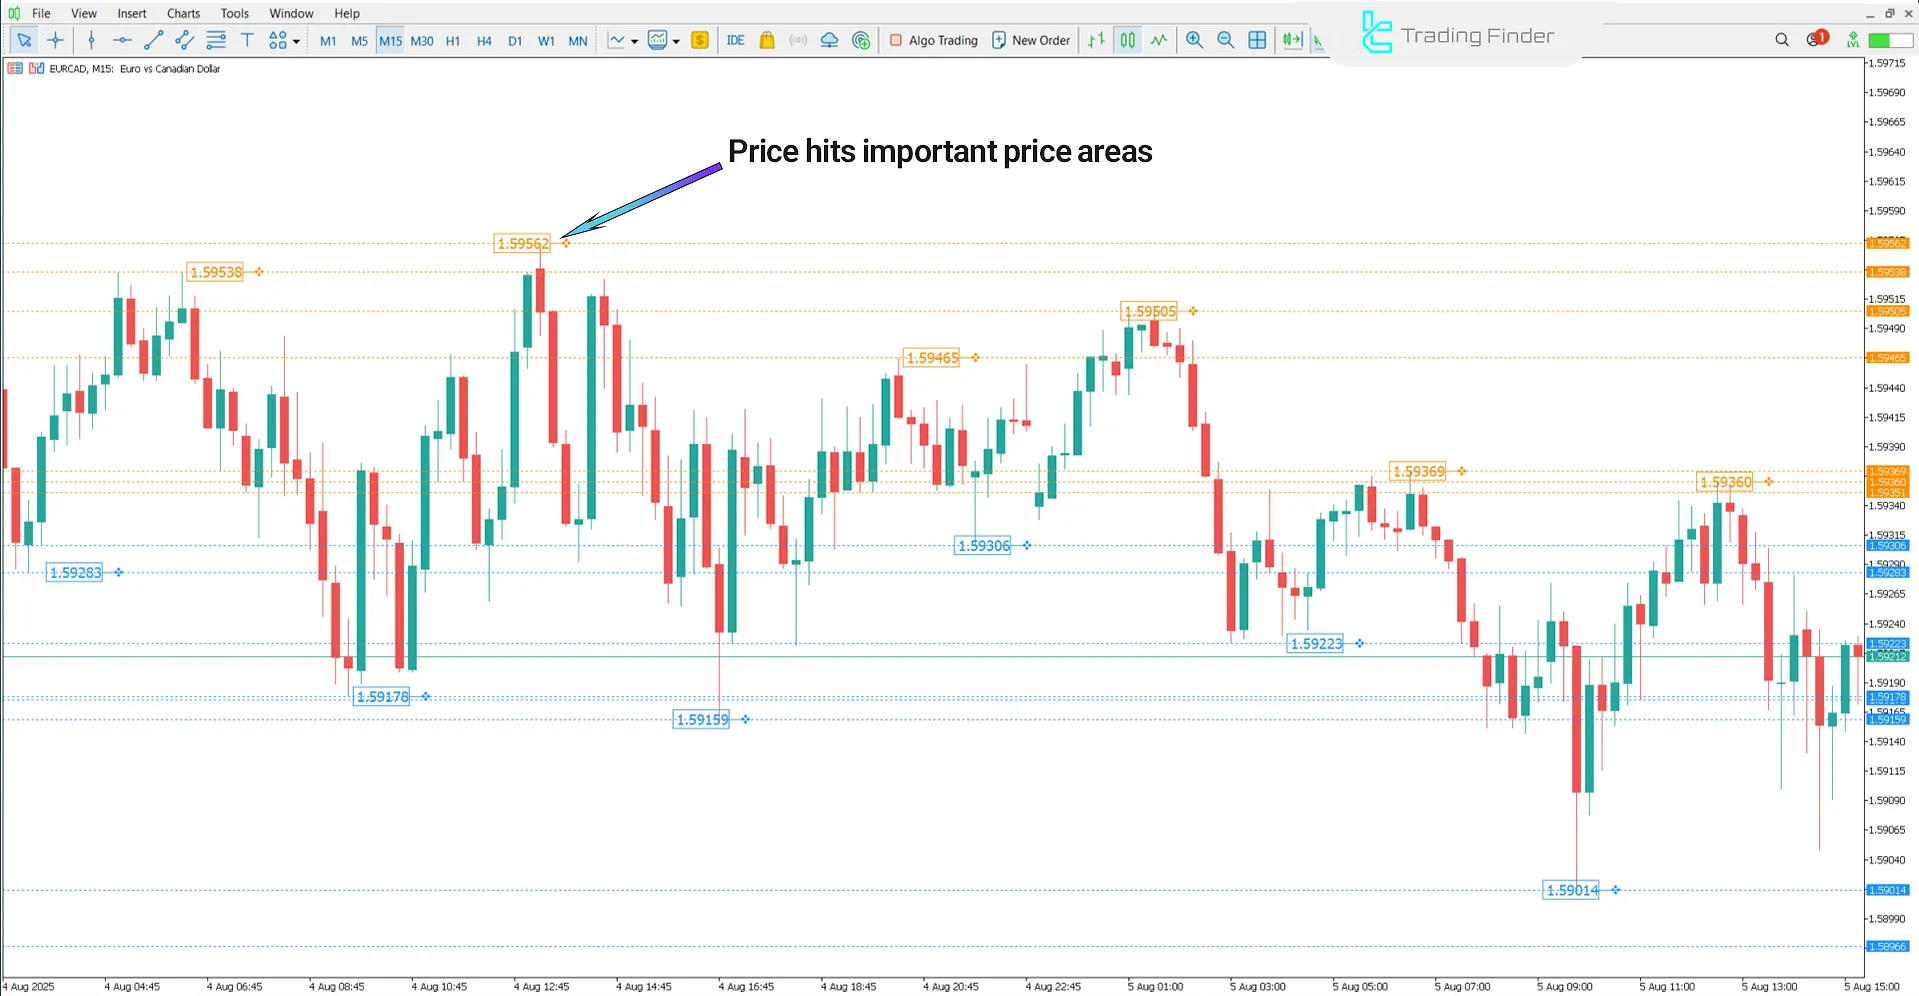
Indicator in a Downtrend
The chart below shows the EUR/CAD currency pair on the 15-minute timeframe.
When the price meets a significant support zone and reversal signals such as bearish candlesticks or reversal patterns appear, it indicates weakening bullish momentum.
From a technical analysis perspective, this increases the probability of a new downtrend starting and creates a sell-entry opportunity.

Brooky PSAR Levels Indicator Settings
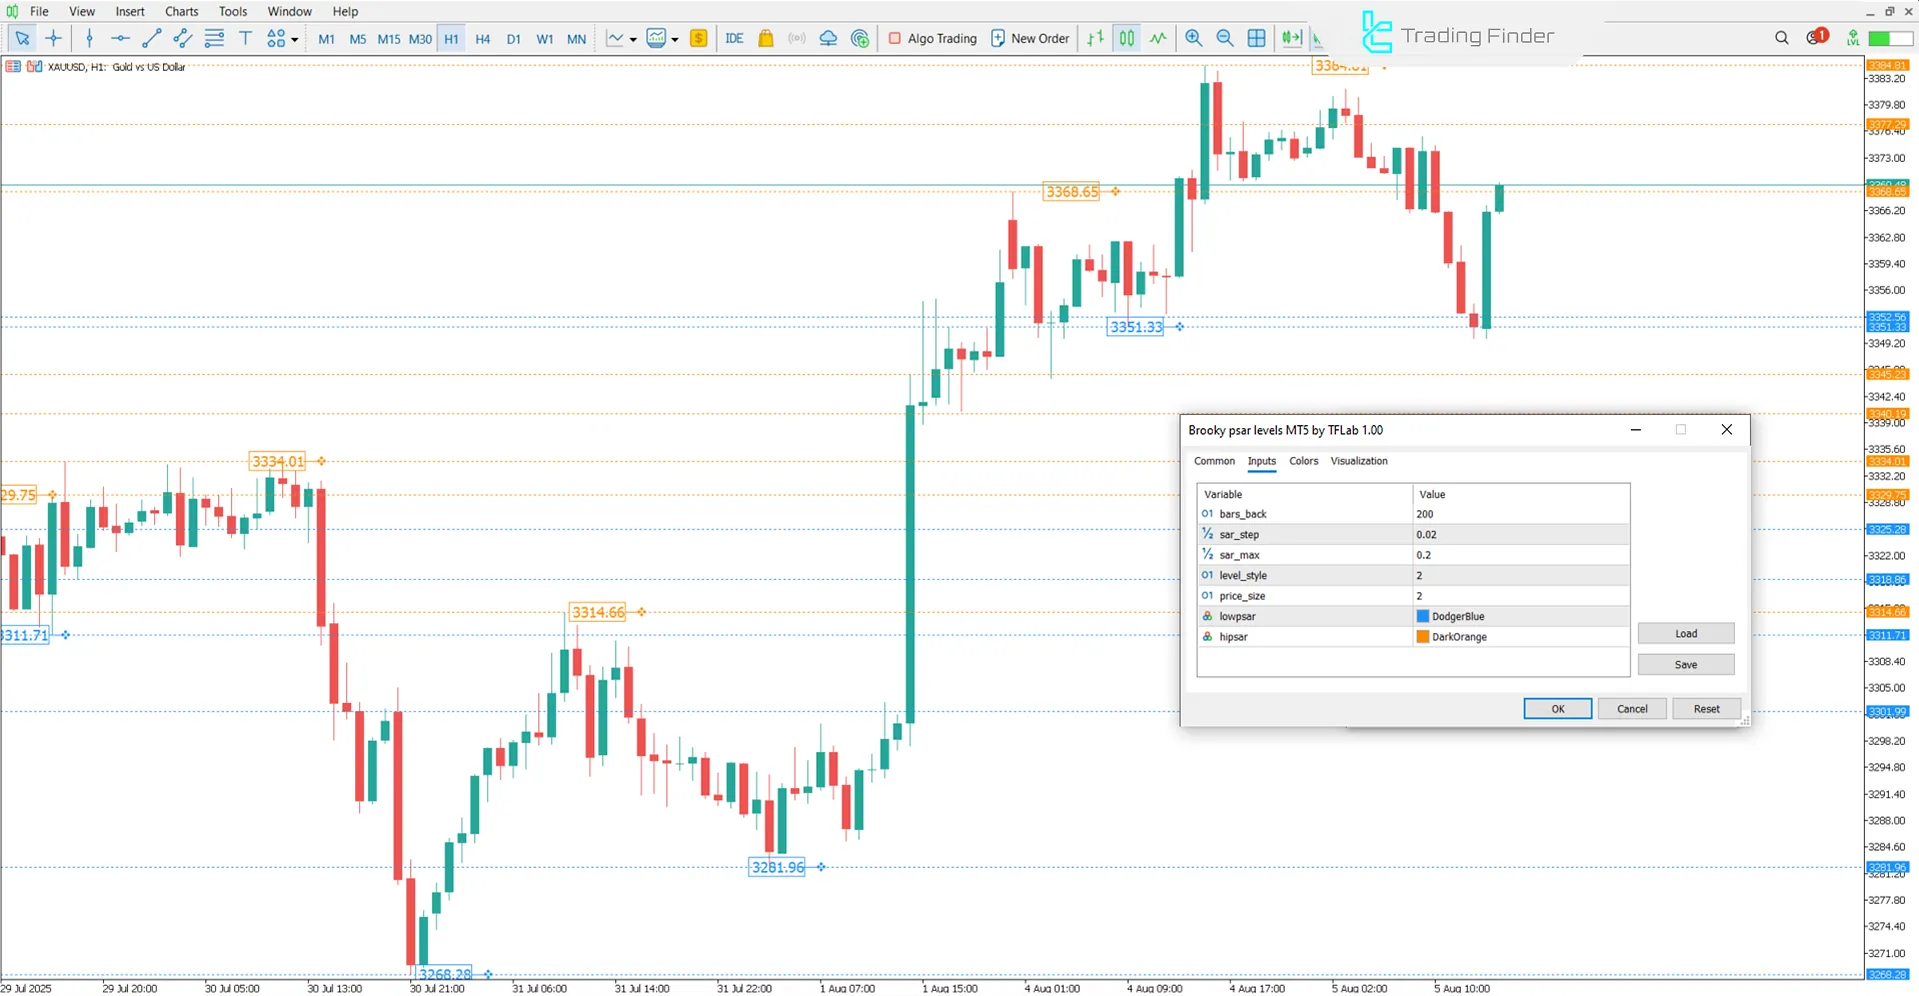
The image below shows the settings panel of the Brooky PSAR Levels indicator:

- Bars back: Number of previous candles
- Sar step: Incremental step of PSAR
- Sar max: Maximum allowed value for PSAR
- Level style: Style of level display
- Price size: Font size of the price label
- Lowpsar: Internal variable for PSAR support levels below candles
- Hipsar: Internal variable for PSAR resistance levels above candles
Conclusion
The Brooky PSAR Levels indicator is an analytical tool based on the PSAR formula that accurately displays dynamic support and resistance levels on the chart.
This trading tool, in addition to determining trend direction, also identifies significant zones of price reversal or breakout.
Using these levels alongside price action increases accuracy in analysis and decision-making in both bullish and bearish market conditions.
Brooky PSAR Levels Indicator in MetaTrader 5 PDF
Brooky PSAR Levels Indicator in MetaTrader 5 PDF
Click to download Brooky PSAR Levels Indicator in MetaTrader 5 PDFWhat is the main difference between the Brooky PSAR Levels indicator and the simple PSAR?
The simple PSAR only shows points above or below candles, while the Brooky PSAR Levels indicator plots support and resistance levels as continuous lines on the chart, providing a clearer view of market structure.
What is the purpose of the Brooky PSAR Levels indicator?
This indicator plots dynamic support and resistance points based on Parabolic SAR calculations to identify potential zones of reversal or breakout.


