![Cap Channel Trading Indicator for MetaTrader 5 Download - Free- [TFlab]](https://cdn.tradingfinder.com/image/190475/2-1-en-cap-channel-trading-mt5-1.webp)
![Cap Channel Trading Indicator for MetaTrader 5 Download - Free- [TFlab] 0](https://cdn.tradingfinder.com/image/190475/2-1-en-cap-channel-trading-mt5-1.webp)
![Cap Channel Trading Indicator for MetaTrader 5 Download - Free- [TFlab] 1](https://cdn.tradingfinder.com/image/190474/2-1-en-cap-channel-trading-mt5-2.webp)
![Cap Channel Trading Indicator for MetaTrader 5 Download - Free- [TFlab] 2](https://cdn.tradingfinder.com/image/190476/2-1-en-cap-channel-trading-mt5-3.webp)
![Cap Channel Trading Indicator for MetaTrader 5 Download - Free- [TFlab] 3](https://cdn.tradingfinder.com/image/190477/2-1-en-cap-channel-trading-mt5-4.webp)
The Cap Channel Trading Indicator utilizes the Triangular Moving Average (TMA) to assist traders in identifying market ranges and potential trend reversals.
It comprises three lines: a central TMA line and two equidistant lines above and below it, enabling traders to interpret market behavior effectively.
Cap Channel Trading Indicator Specifications Table
Table below describes the specifications of the Cap Channel Trading indicator:
Indicator Categories: | Volatility MT5 Indicators Currency Strength MT5 Indicators Bands & Channels MT5 Indicators |
Platforms: | MetaTrader 5 Indicators |
Trading Skills: | Intermediate |
Indicator Types: | Range MT5 Indicators Breakout MT5 Indicators |
Timeframe: | Multi-Timeframe MT5 Indicators |
Trading Style: | Day Trading MT5 Indicators |
Trading Instruments: | Forex MT5 Indicators Crypto MT5 Indicators Stock MT5 Indicators Commodity MT5 Indicators Indices MT5 Indicators Share Stock MT5 Indicators |
Indicator Overview
The Cap Channel Trading Indicator helps identify bullish and bearish trends by detecting price breakouts beyond the upper or lower channel lines.
These breakouts trigger buy or sell signals, indicating possible trend reversals due to liquidity buildup.
Uptrend Conditions
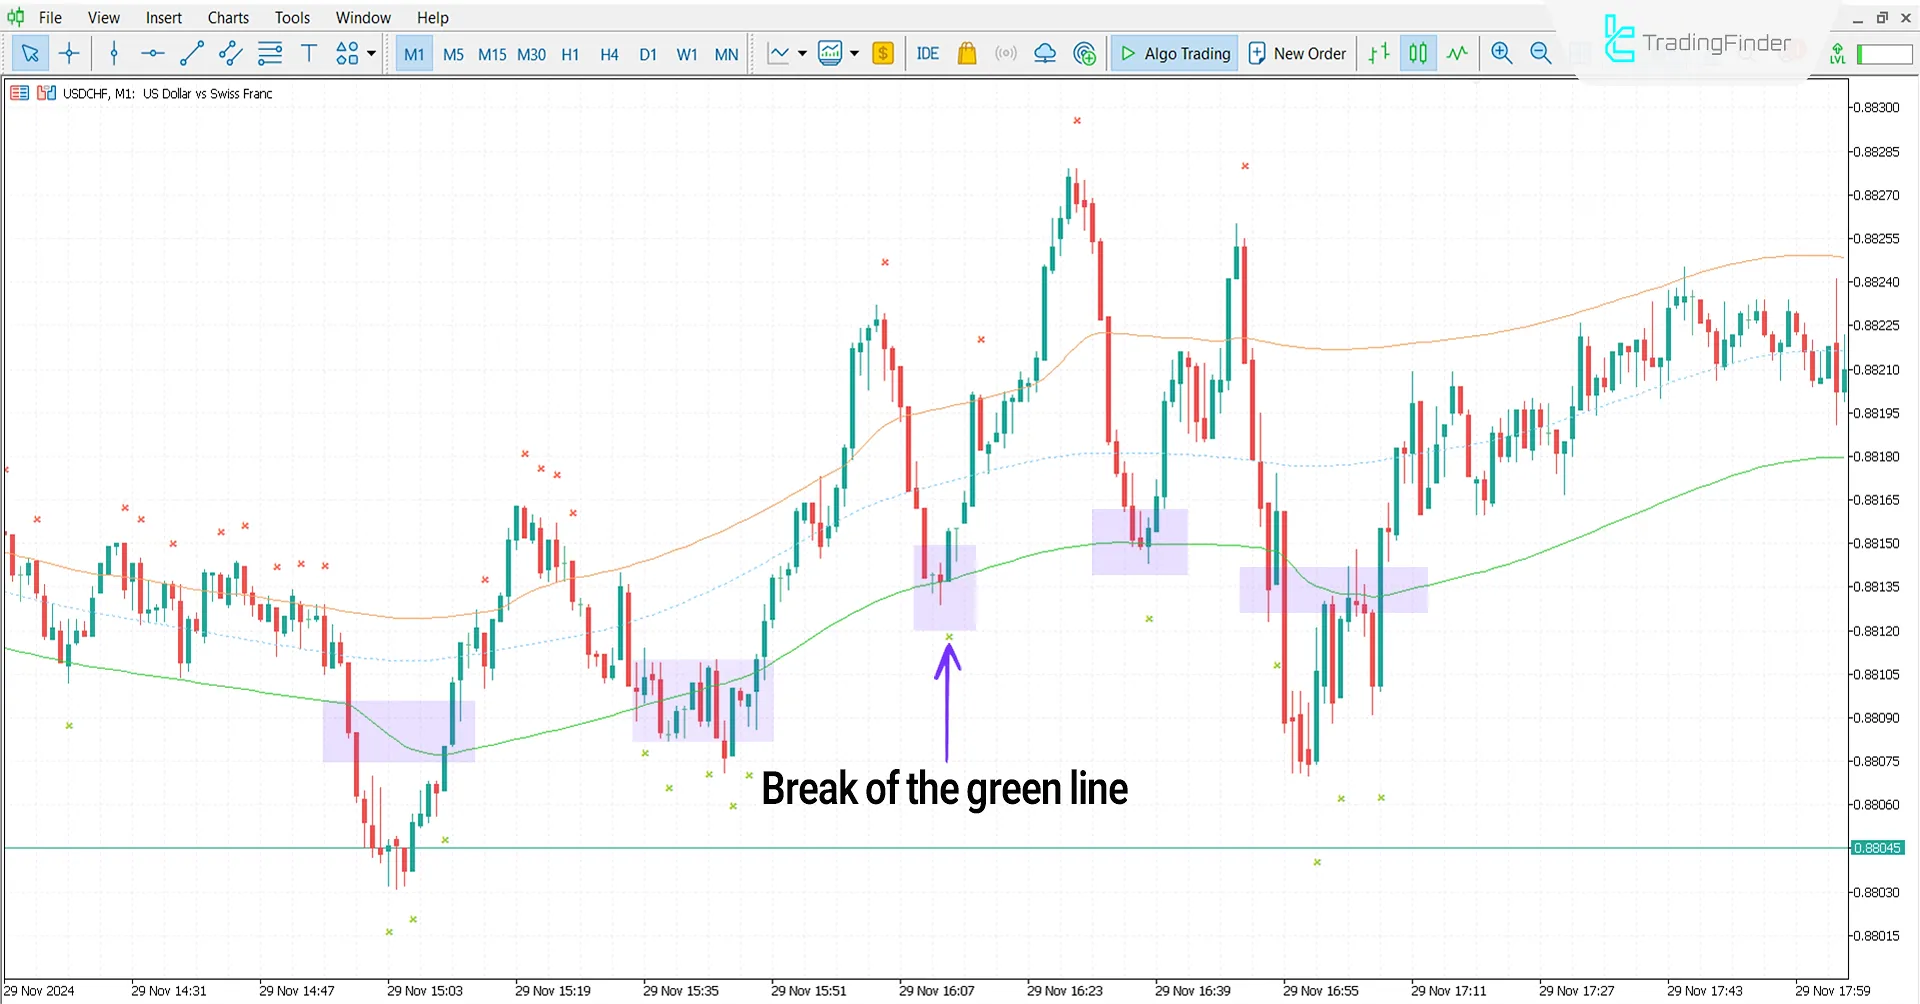
The USD/CHF price chart in a 1 minute timeframe demonstrates a bullish setup.
Abuy signal emerges when the price moves below the green lower line, of this highly MT5 Volatile indicator, highlighting liquidity accumulation and a potential reversal to the upside.

Downtrend Conditions
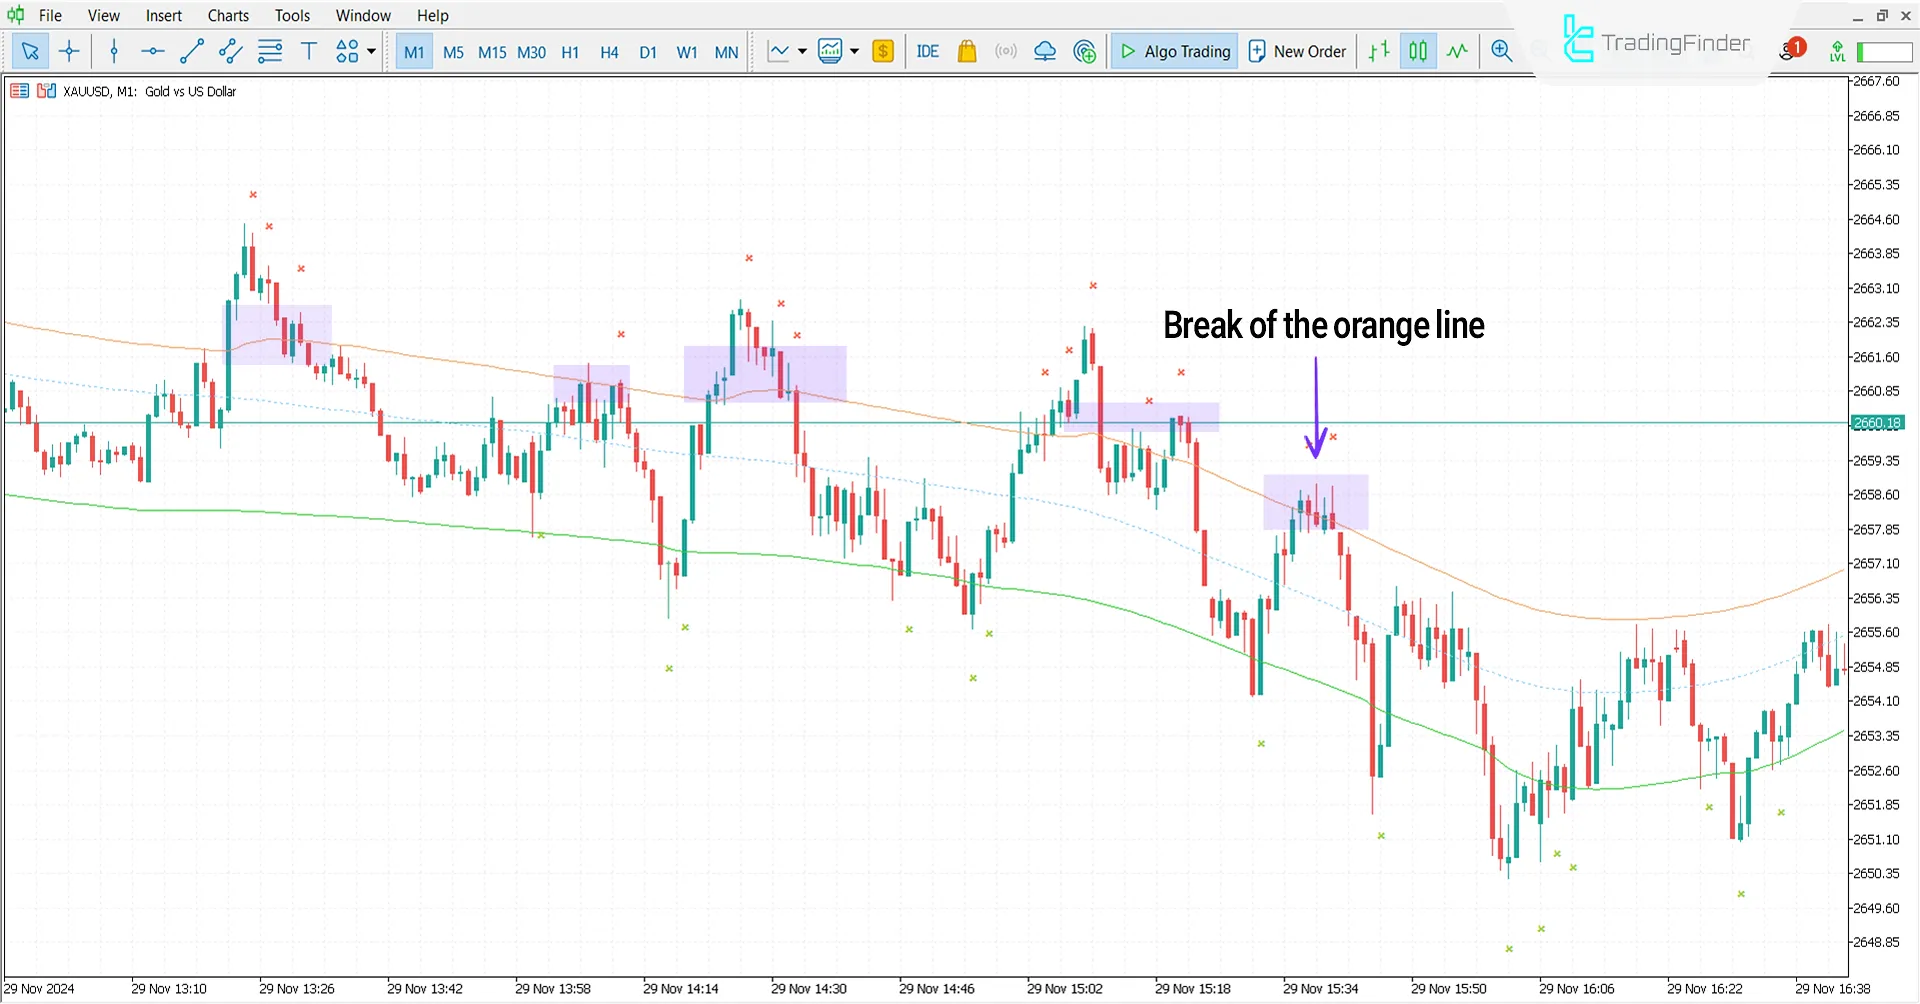
On a 1 minute XAU/USD chart, the indicator displays a bearish setup.
Asell signal is generated as the price breaches the red upper line, markingliquidity accumulation and signaling a downward trend reversal.

Indicator Settings
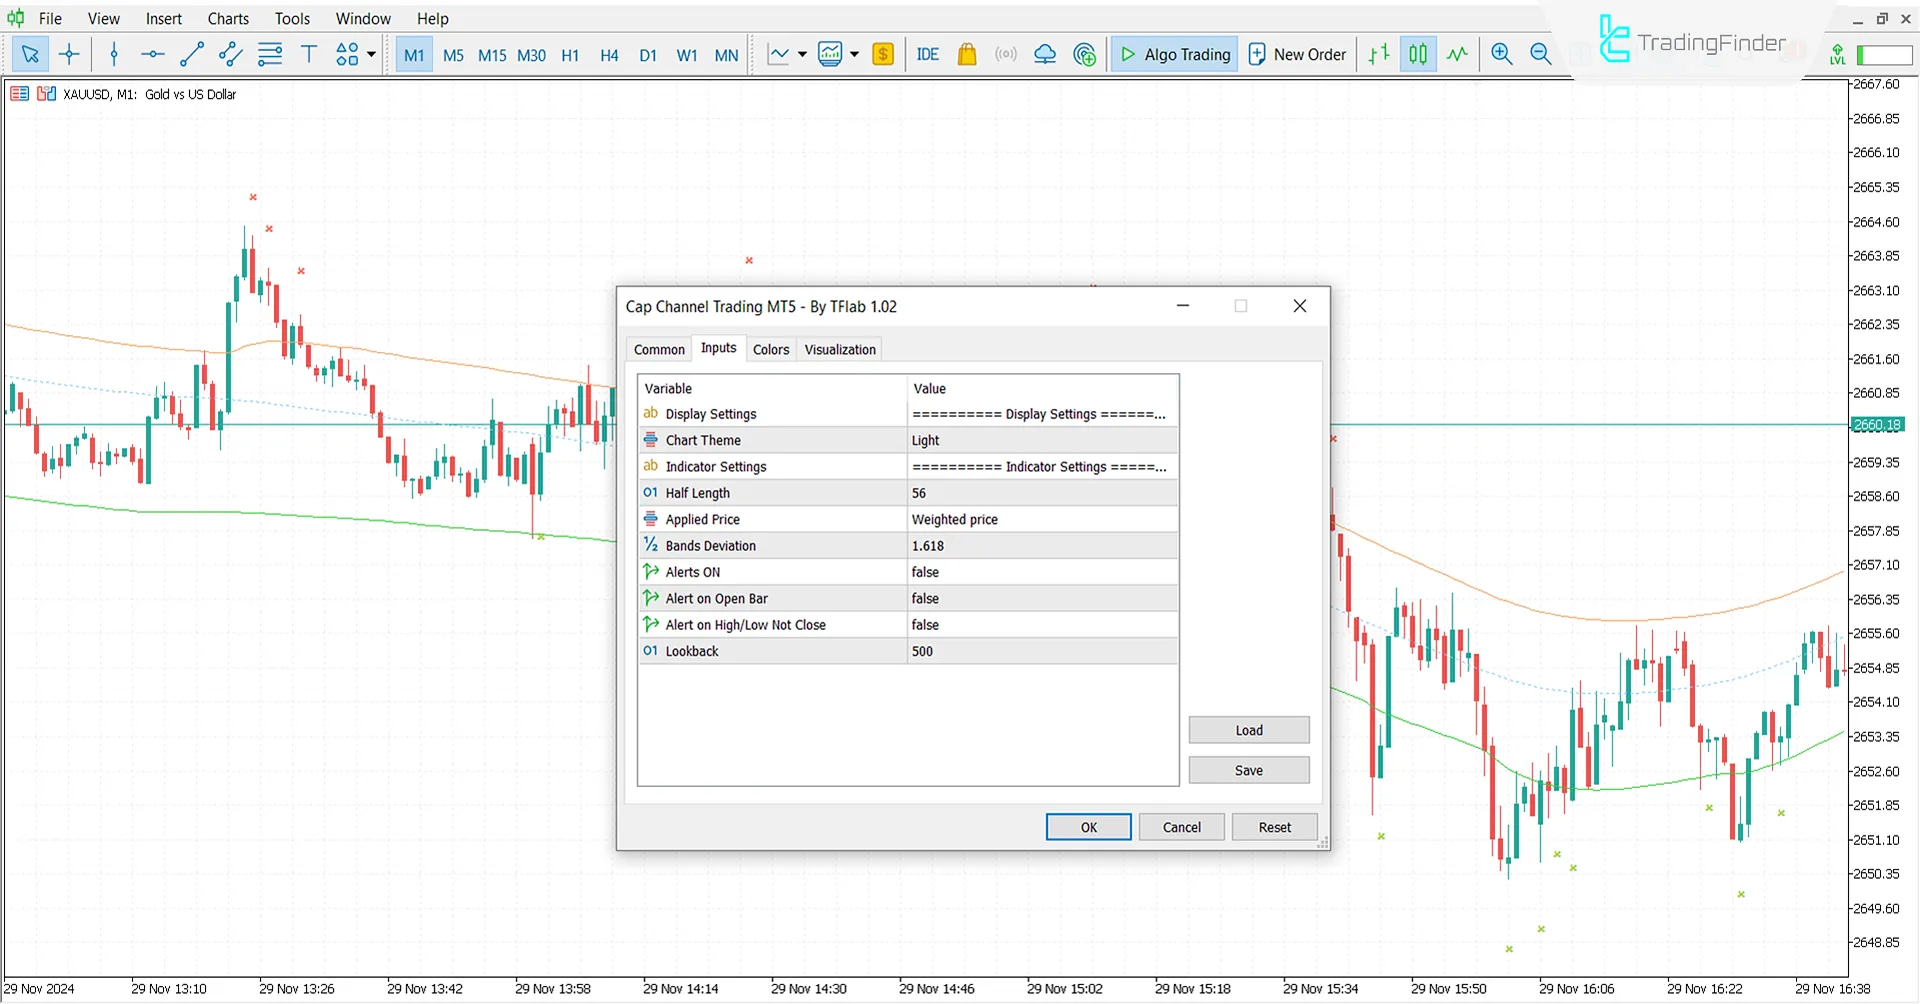
The following image outlines the customizable features of the Cap Channel Trading Indicator:

- Chart-theme: Chart theme;
- Half-length: Half distance;
- Applied price: Applied price;
- Bands deviation: Band deviation;
- Alert on: Alert on;
- Alert on current: Alert on current;
- Alert on high low: Alert for high and low;
- Lookback: Lookback.
Conclusion
The Cap Channel Trading Indicator, like a MT5 Support and Resistance Indicator, is a versatile tool for traders, providing insights into support resistance levels, breakout points, and ideal entry, exit positions.
With it supper, lower, and middle lines, it delivers essential market movement details.
Cap Channel Trading MT5 PDF
Cap Channel Trading MT5 PDF
Click to download Cap Channel Trading MT5 PDFWhen does the indicator signal a bullish trend?
The indicator generates a bullish signal when the price breaks below the green lower line.
How many lines does the Cap Channel Trading Indicator have?
It features three lines: a central TMA line and two equidistant, color-coded lines above and below it.


