![CPR (Central Pivot Range) Indicator in MetaTrader 5 – Free – [Trading Finder]](https://cdn.tradingfinder.com/image/325091/2-48-en-cpr-indicator-mt5-1.webp)
![CPR (Central Pivot Range) Indicator in MetaTrader 5 – Free – [Trading Finder] 0](https://cdn.tradingfinder.com/image/325091/2-48-en-cpr-indicator-mt5-1.webp)
![CPR (Central Pivot Range) Indicator in MetaTrader 5 – Free – [Trading Finder] 1](https://cdn.tradingfinder.com/image/325090/2-48-en-cpr-indicator-mt5-2.webp)
![CPR (Central Pivot Range) Indicator in MetaTrader 5 – Free – [Trading Finder] 2](https://cdn.tradingfinder.com/image/325094/2-48-en-cpr-indicator-mt5-3-png.webp)
![CPR (Central Pivot Range) Indicator in MetaTrader 5 – Free – [Trading Finder] 3](https://cdn.tradingfinder.com/image/325096/2-48-en-cpr-indicator-mt5-4.webp)
The CPR (Central Pivot Range) indicator in MetaTrader 5 is calculated using price data, including High, Low, and Close. It aims to identify reversal zones and forecast the potential direction of price movement.
The CPR structure consists of a central pivot line (Pivot Point) in the center, two resistance levels (blue), and two support levels (yellow) in Technical analysis.
CPR Indicator Specification Table
The following table presents the key characteristics of the CPR indicator.
Indicator Categories: | Pivot Points & Fractals MT5 Indicators Support & Resistance MT5 Indicators Volatility MT5 Indicators |
Platforms: | MetaTrader 5 Indicators |
Trading Skills: | Intermediate |
Indicator Types: | Reversal MT5 Indicators |
Timeframe: | Multi-Timeframe MT5 Indicators |
Trading Style: | Intraday MT5 Indicators |
Trading Instruments: | Forex MT5 Indicators Crypto MT5 Indicators Stock MT5 Indicators Forward MT5 Indicators Share Stock MT5 Indicators |
Uptrend Conditions
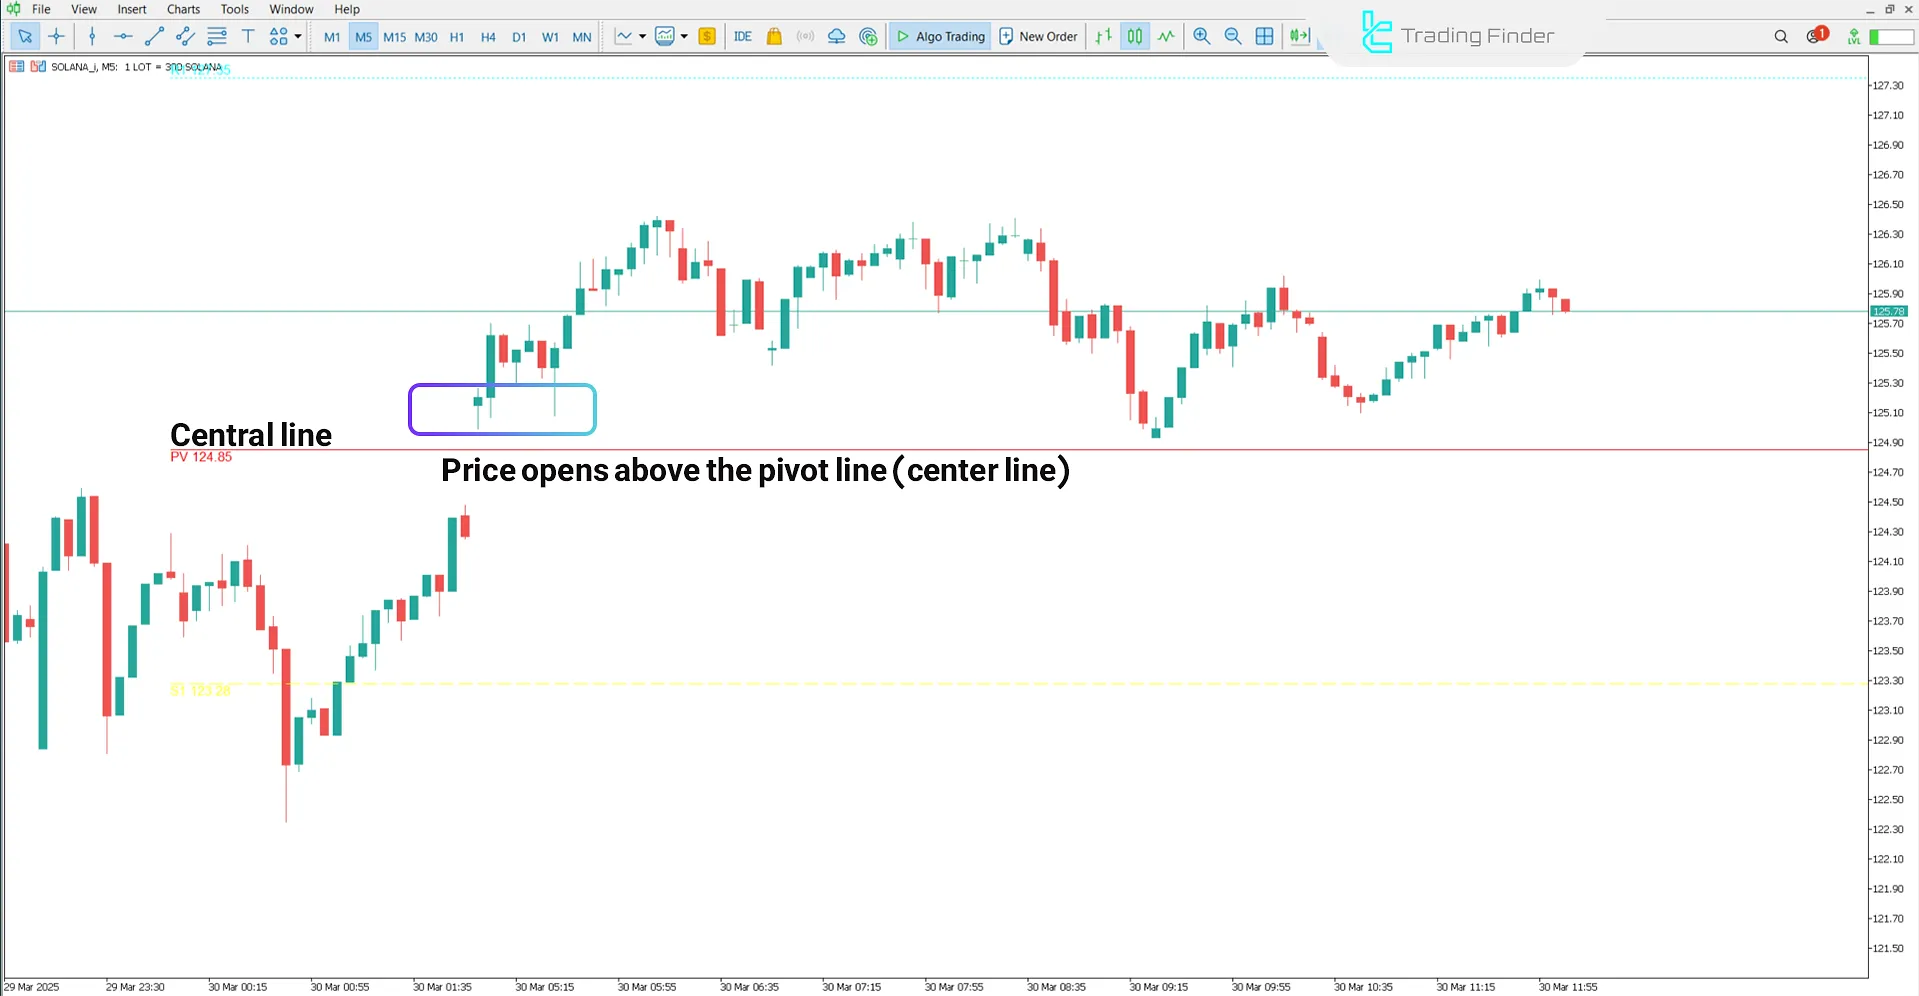
In Solana's 5-minute chart, the price opens above the central line (red) and stabilizes in that zone. This price behavior indicates a potential continuation of the bullish trend until it reaches the next resistance level.

Downtrend Conditions
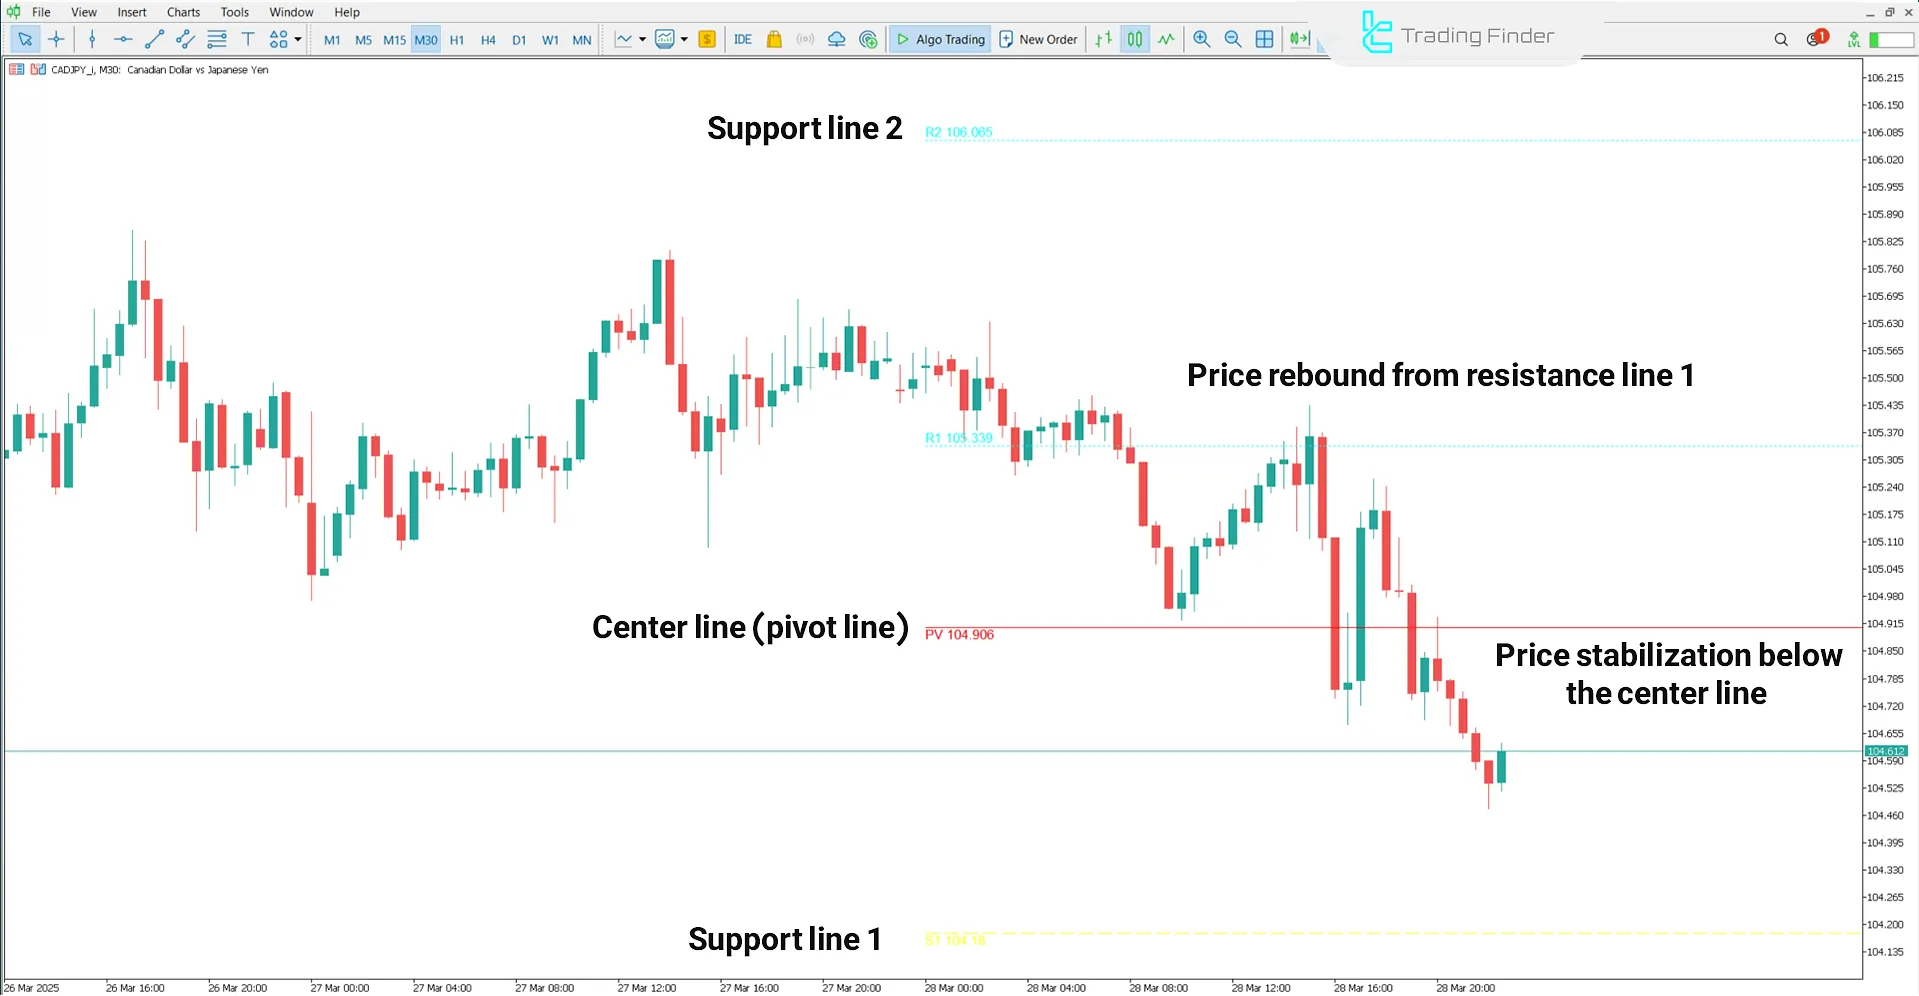
The image below displays a 30-minute CAD/JPY currency pair chart. After retesting the resistance (blue line) and failing to break through, the price remains below the central CPR line.
Price stabilization below the pivot may confirm seller strength, increasing the likelihood of continued bearish movement toward previous support levels.

Indicator Settings
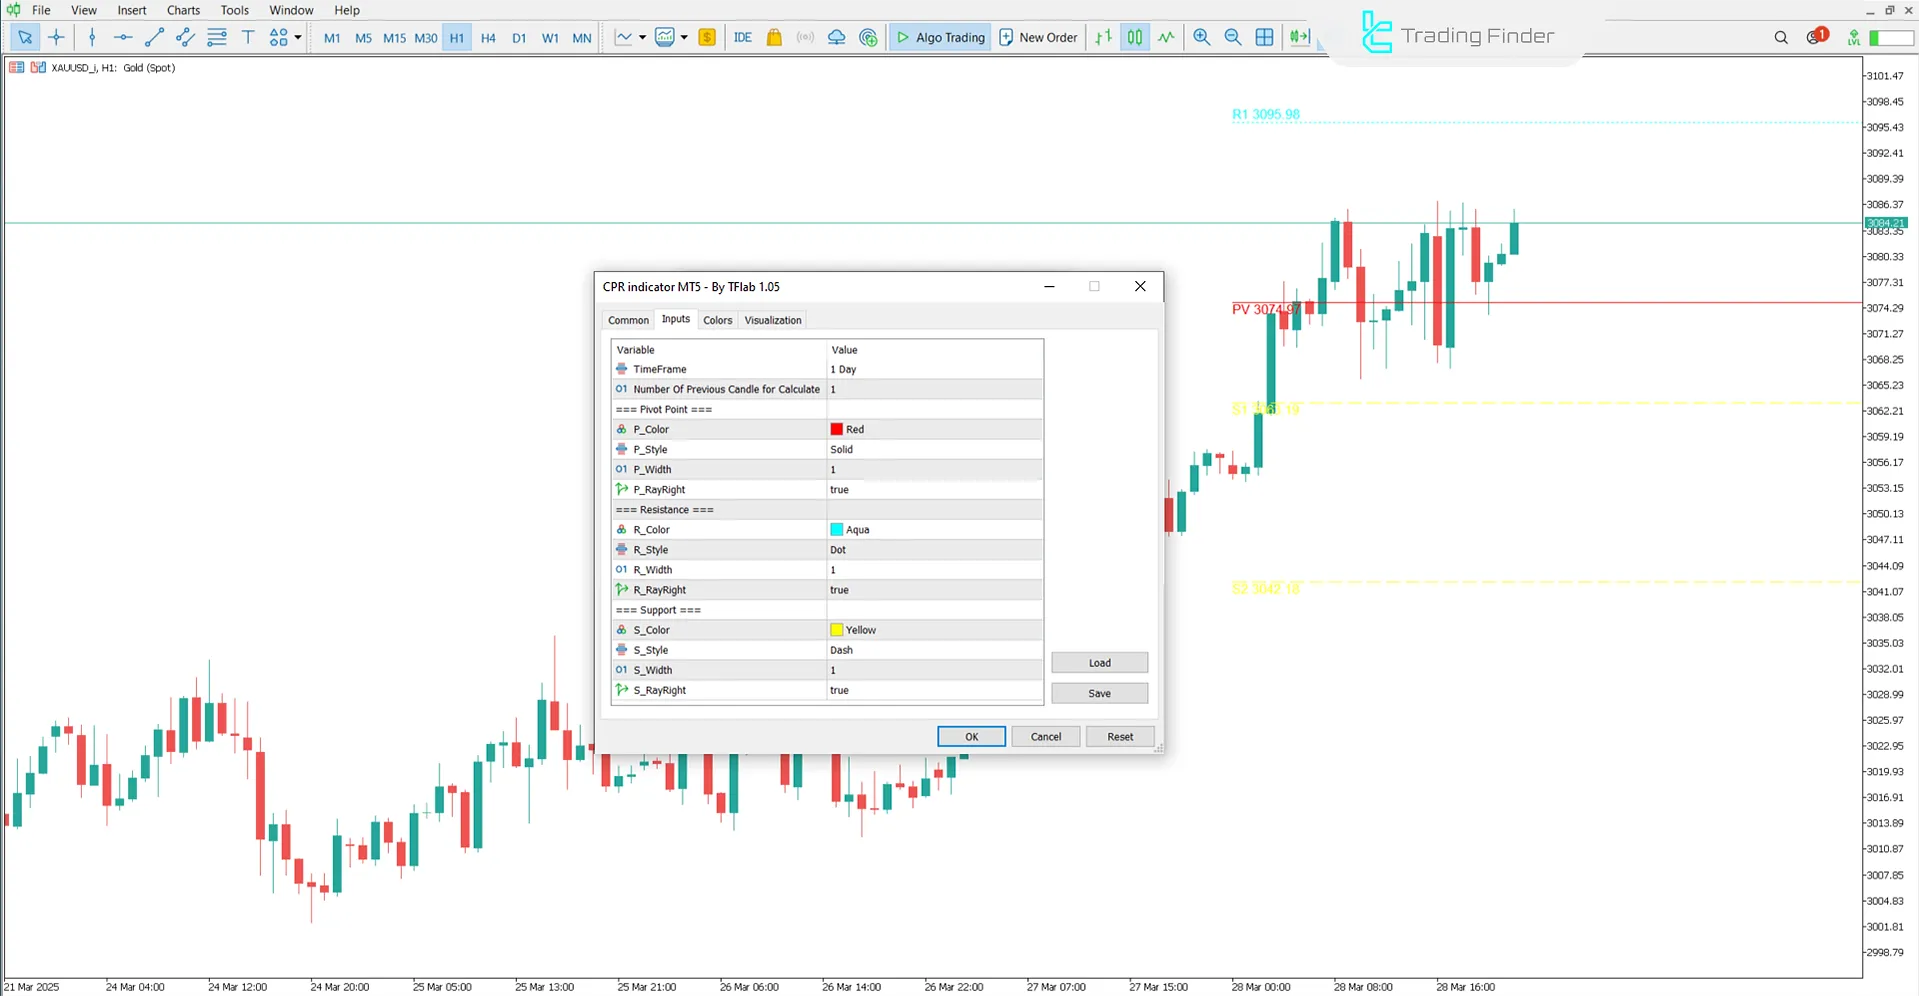
The image below shows the customizable settings section of the CPR (Central Pivot Range) indicator:

- Timeframe: Timeframe used for indicator calculation
- Number Of Previous Candles for Calculate: Number of previous candles to calculate
- P_Color: Color of the pivot point line
- P_Style: Style of the pivot point line
- P_Width: Width of the pivot point line
- P_RayRight: Extend the pivot line to the right
- R_Color: Resistance line color
- R_Style: Resistance line style
- R_Width: Resistance line thickness
- R_RayRight: Extend the resistance line to the right
- S_Color: Support line color
- S_Style: Support line style
- S_Width: Support line thickness
- S_RayRight: Extend the support line to the right
Conclusion
The CPR indicator is a multi-timeframe tool that enables price action analysis across different timeframes. This support and resistance level for MetaTrader 5 is designed to accurately identify support/resistance zones and potential market turning points.
Moreover, this trading tool suits all financial markets, including stocks, forex, and cryptocurrencies.
CPR Central Pivot Range MT5 PDF
CPR Central Pivot Range MT5 PDF
Click to download CPR Central Pivot Range MT5 PDFHow many levels does the CPR indicator consist of?
This trading tool consists of three primary levels: the central point, the upper level, and the lower level.
How is CPR used to identify trends?
This indicator can identify market trends by analyzing the price position relative to the central, upper, and lower lines.


