![Chop Zone Indicator for MT5 Download – Free – [TradingFinder]](https://cdn.tradingfinder.com/image/633576/13-243-en-chop-zone-mt5-01.webp)
![Chop Zone Indicator for MT5 Download – Free – [TradingFinder] 0](https://cdn.tradingfinder.com/image/633576/13-243-en-chop-zone-mt5-01.webp)
![Chop Zone Indicator for MT5 Download – Free – [TradingFinder] 1](https://cdn.tradingfinder.com/image/633572/13-243-en-chop-zone-mt5-02.webp)
![Chop Zone Indicator for MT5 Download – Free – [TradingFinder] 2](https://cdn.tradingfinder.com/image/633574/13-243-en-chop-zone-mt5-03.webp)
![Chop Zone Indicator for MT5 Download – Free – [TradingFinder] 3](https://cdn.tradingfinder.com/image/633573/13-243-en-chop-zone-mt5-04.webp)
The Chop Zone Indicator is designed to display market movement conditions and distinguish active trends from neutral phases in MetaTrader 5.
Through its internal calculations, this indicator evaluates the strength and weakness of price movement and presents the results in the form of a colored histogram (in a separate window).
The histogram not only reflects the current market status but also helps identify potential trading opportunities.
Chop Zone Oscillator Specification Table
The table below shows the specifications of the Chop Zone Indicator:
Indicator Categories: | Oscillators MT5 Indicators Signal & Forecast MT5 Indicators Trading Assist MT5 Indicators |
Platforms: | MetaTrader 5 Indicators |
Trading Skills: | Elementary |
Indicator Types: | Reversal MT5 Indicators |
Timeframe: | Multi-Timeframe MT5 Indicators |
Trading Style: | Swing Trading MT5 Indicators Intraday MT5 Indicators Scalper MT5 Indicators |
Trading Instruments: | Forex MT5 Indicators Crypto MT5 Indicators Stock MT5 Indicators |
Chop Zone Indicator at a Glance
In the Chop Zone Oscillator, the color change of histogram bars represents the current market condition.
Each color corresponds to a specific signal, as follows:
- Green Bar: bullish trend
- Red Bar: bearish trend
- Gray Bar: neutral or ranging condition
Bullish Trend
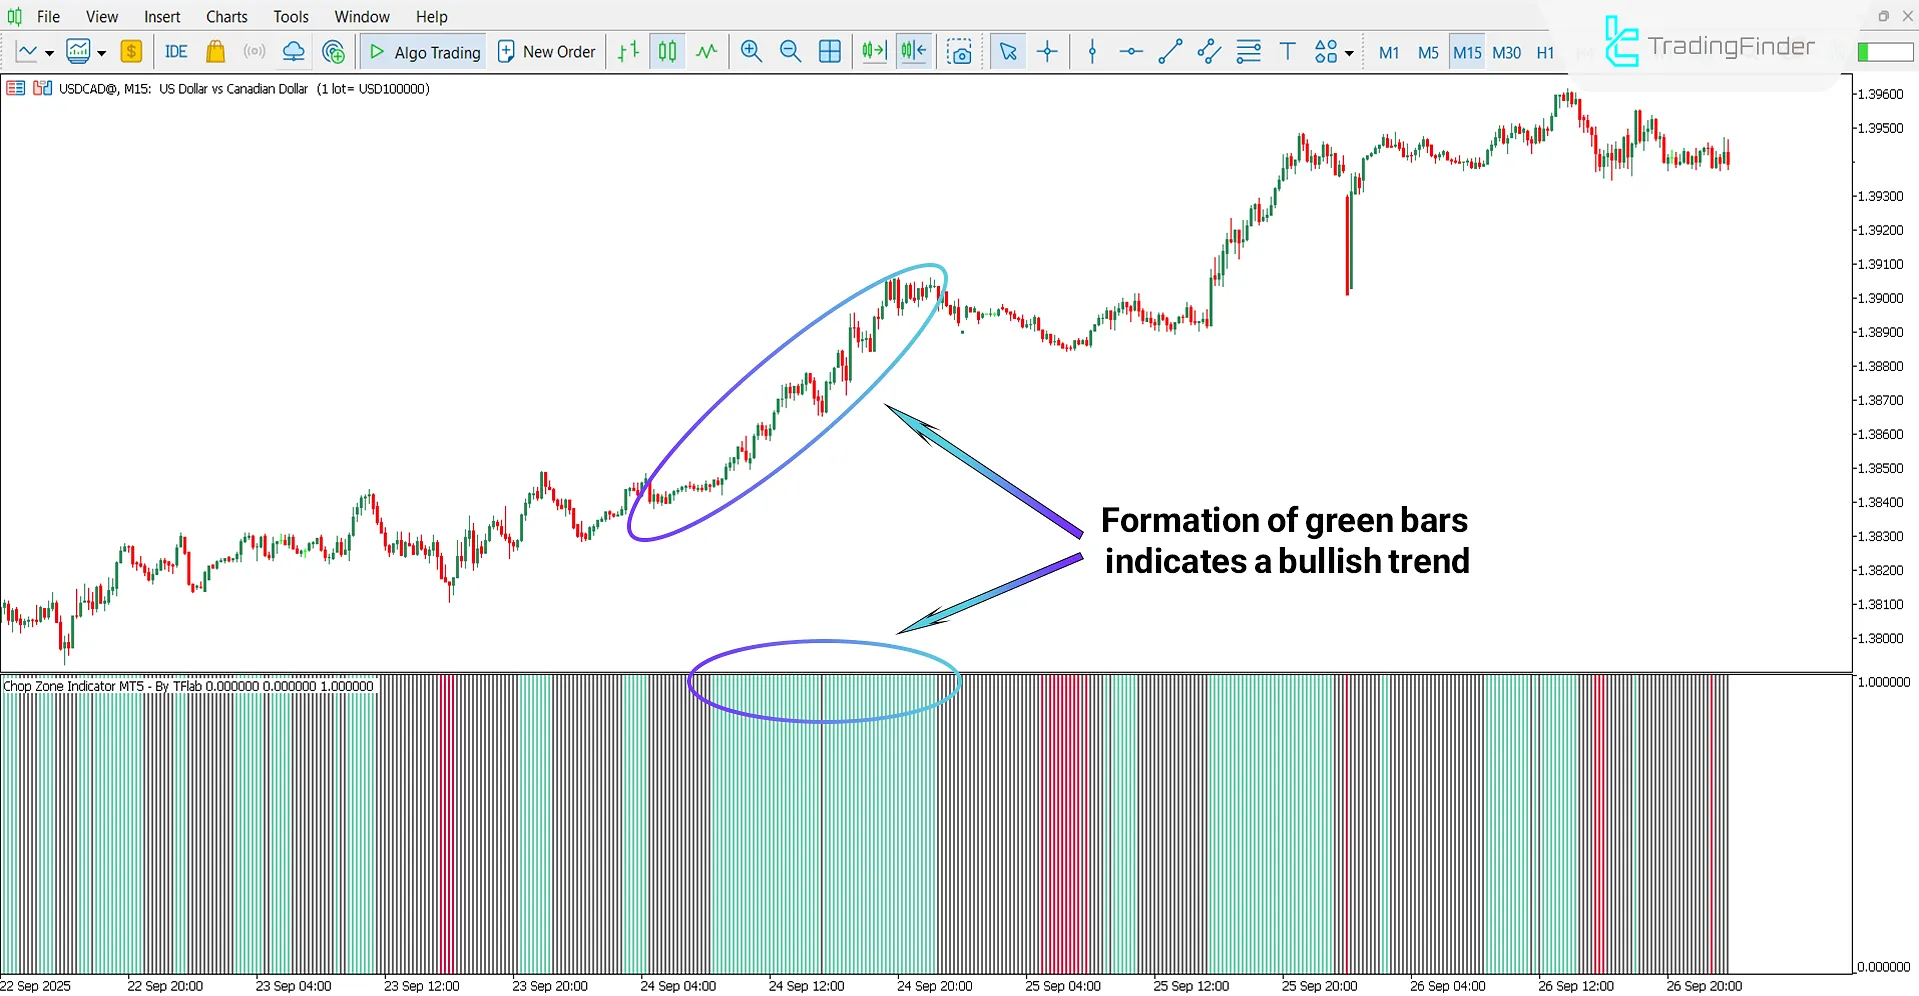
According to the 15-minute USD/CAD chart, the appearance of green bars on the histogram indicates the beginning of a bullish movement.
The consecutive formation of these bars signifies the continuation of buying pressure and the ongoing upward trend.
In such a scenario, the trader can keep the buy position open until red bars appear, signaling a potential trend reversal.

Bearish Trend
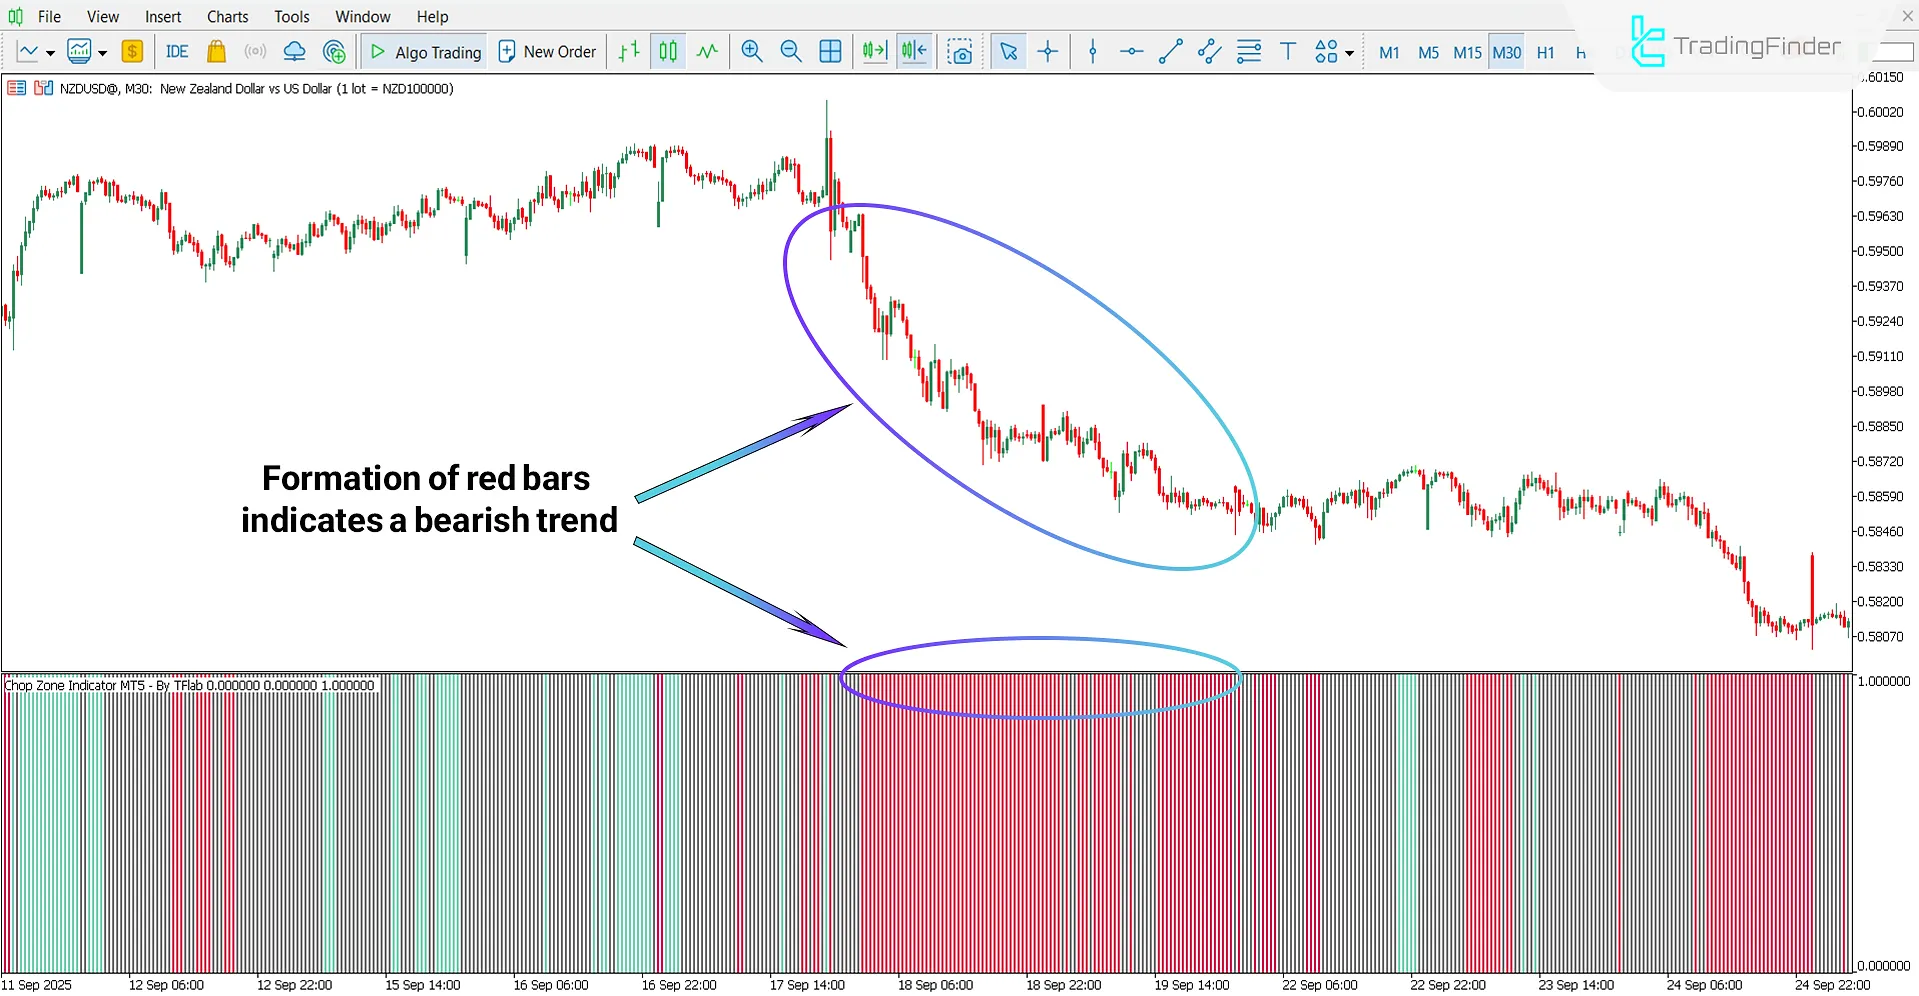
Based on the 30-minute NZD/USD chart, the presence of red bars in the Chop Zone Oscillator indicates the dominance of sellers and the beginning of a bearish movement.
In these conditions, depending on market behavior, sell positions can be considered.

Chop Zone Oscillator Settings
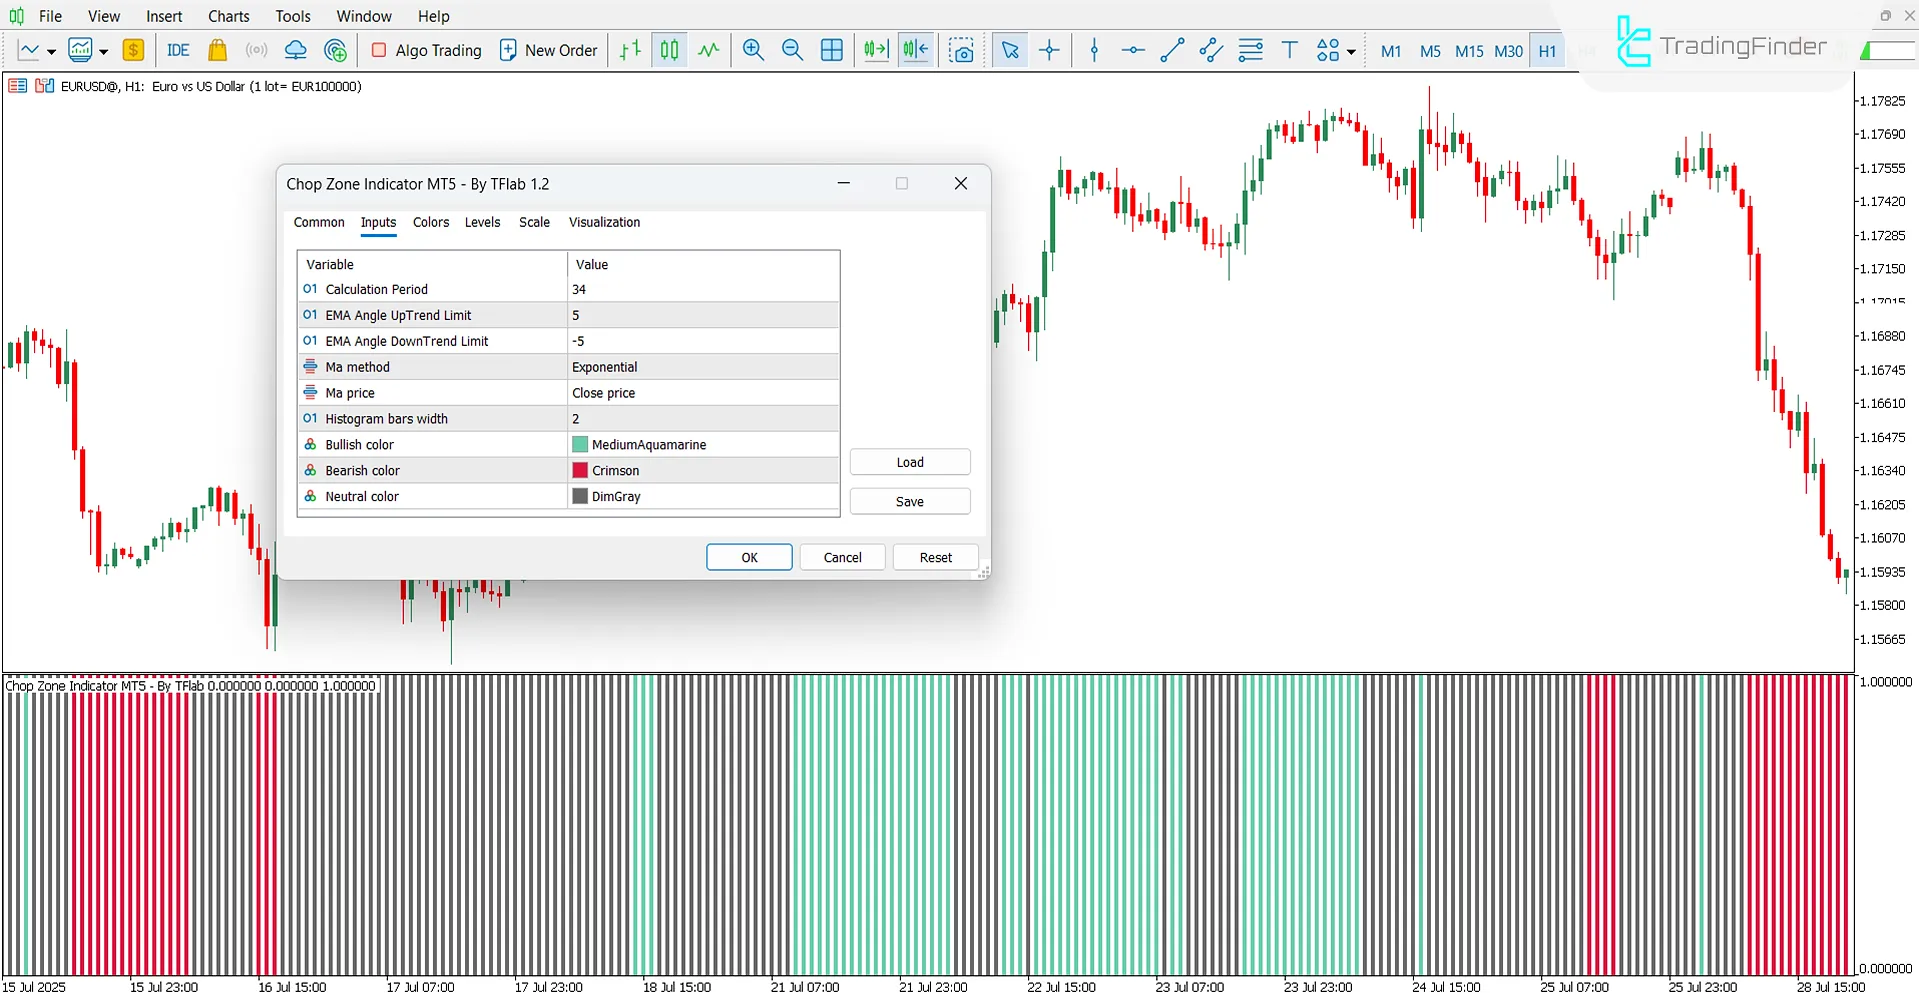
The settings of the Chop Zone Indicator are shown in the image below:

- Calculation Period: period of the indicator
- EMA Angle UpTrend Limit: EMA angle threshold for bullish trend
- EMA Angle DownTrend Limit: EMA angle threshold for bearish trend
- MA Method: type of moving average
- MA Price: price basis of the moving average
- Histogram Bars Width: width of histogram bars
- Bullish Color: color for bullish momentum
- Bearish Color: color for bearish momentum
- Neutral Color: color for neutral condition
Conclusion
The Chop Zone Oscillator is considered an analytical tool in technical analysis. The color changes in the histogram provide a simple and intuitive method for identifying potential price reversal zones and make it easier to determine suitable entry and exit points for buy and sell trades.
In addition, the indicator’s settings allow users to adjust calculation parameters according to their trading instrument and personal trading strategy.
Chop Zone Indicator for MT5 PDF
Chop Zone Indicator for MT5 PDF
Click to download Chop Zone Indicator for MT5 PDFIs this tool suitable for scalping?
Yes, because the rapid color changes enable traders to identify real-time market conditions.
Is this indicator only applicable in the Forex market?
No, the Chop Zone Indicator can be used across all markets.


