![CISD - CSD + High & Low ICT Indicator in MT5 Download - Free - [TFlab]](https://cdn.tradingfinder.com/image/252576/13-77-en-cisd-csd-high-low-mt5-01.webp)
![CISD - CSD + High & Low ICT Indicator in MT5 Download - Free - [TFlab] 0](https://cdn.tradingfinder.com/image/252576/13-77-en-cisd-csd-high-low-mt5-01.webp)
![CISD - CSD + High & Low ICT Indicator in MT5 Download - Free - [TFlab] 1](https://cdn.tradingfinder.com/image/252587/13-77-en-cisd-csd-high-low-mt5-02.webp)
![CISD - CSD + High & Low ICT Indicator in MT5 Download - Free - [TFlab] 2](https://cdn.tradingfinder.com/image/252575/13-77-en-cisd-csd-high-low-mt5-03.webp)
![CISD - CSD + High & Low ICT Indicator in MT5 Download - Free - [TFlab] 3](https://cdn.tradingfinder.com/image/252588/13-77-en-cisd-csd-high-low-mt5-04.webp)
The CISD – CSD + High and Low Indicator displays the High and Low price levels along with the CISD on the chart. This ICT indicator identifies liquidity Concept in forex and false breaks at High and Low levels and marks the formation of CISD with an arrow.
CISD + High/Low Indicator Specifications Table
The table below contains the specifications and features of the CISD - CSD + High and Low Indicator.
Indicator Categories: | Smart Money MT5 Indicators Signal & Forecast MT5 Indicators ICT MT5 Indicators |
Platforms: | MetaTrader 5 Indicators |
Trading Skills: | Advanced |
Indicator Types: | Reversal MT5 Indicators |
Timeframe: | Multi-Timeframe MT5 Indicators |
Trading Style: | Day Trading MT5 Indicators |
Trading Instruments: | Forex MT5 Indicators Crypto MT5 Indicators Stock MT5 Indicators |
CISD - CSD Indicator at a Glance
This indicator displays the CISD and high/low lines daily, weekly, and monthly. Arrows indicate the formation of CISD and serve as trade entry signals.
Indicator in an Uptrend
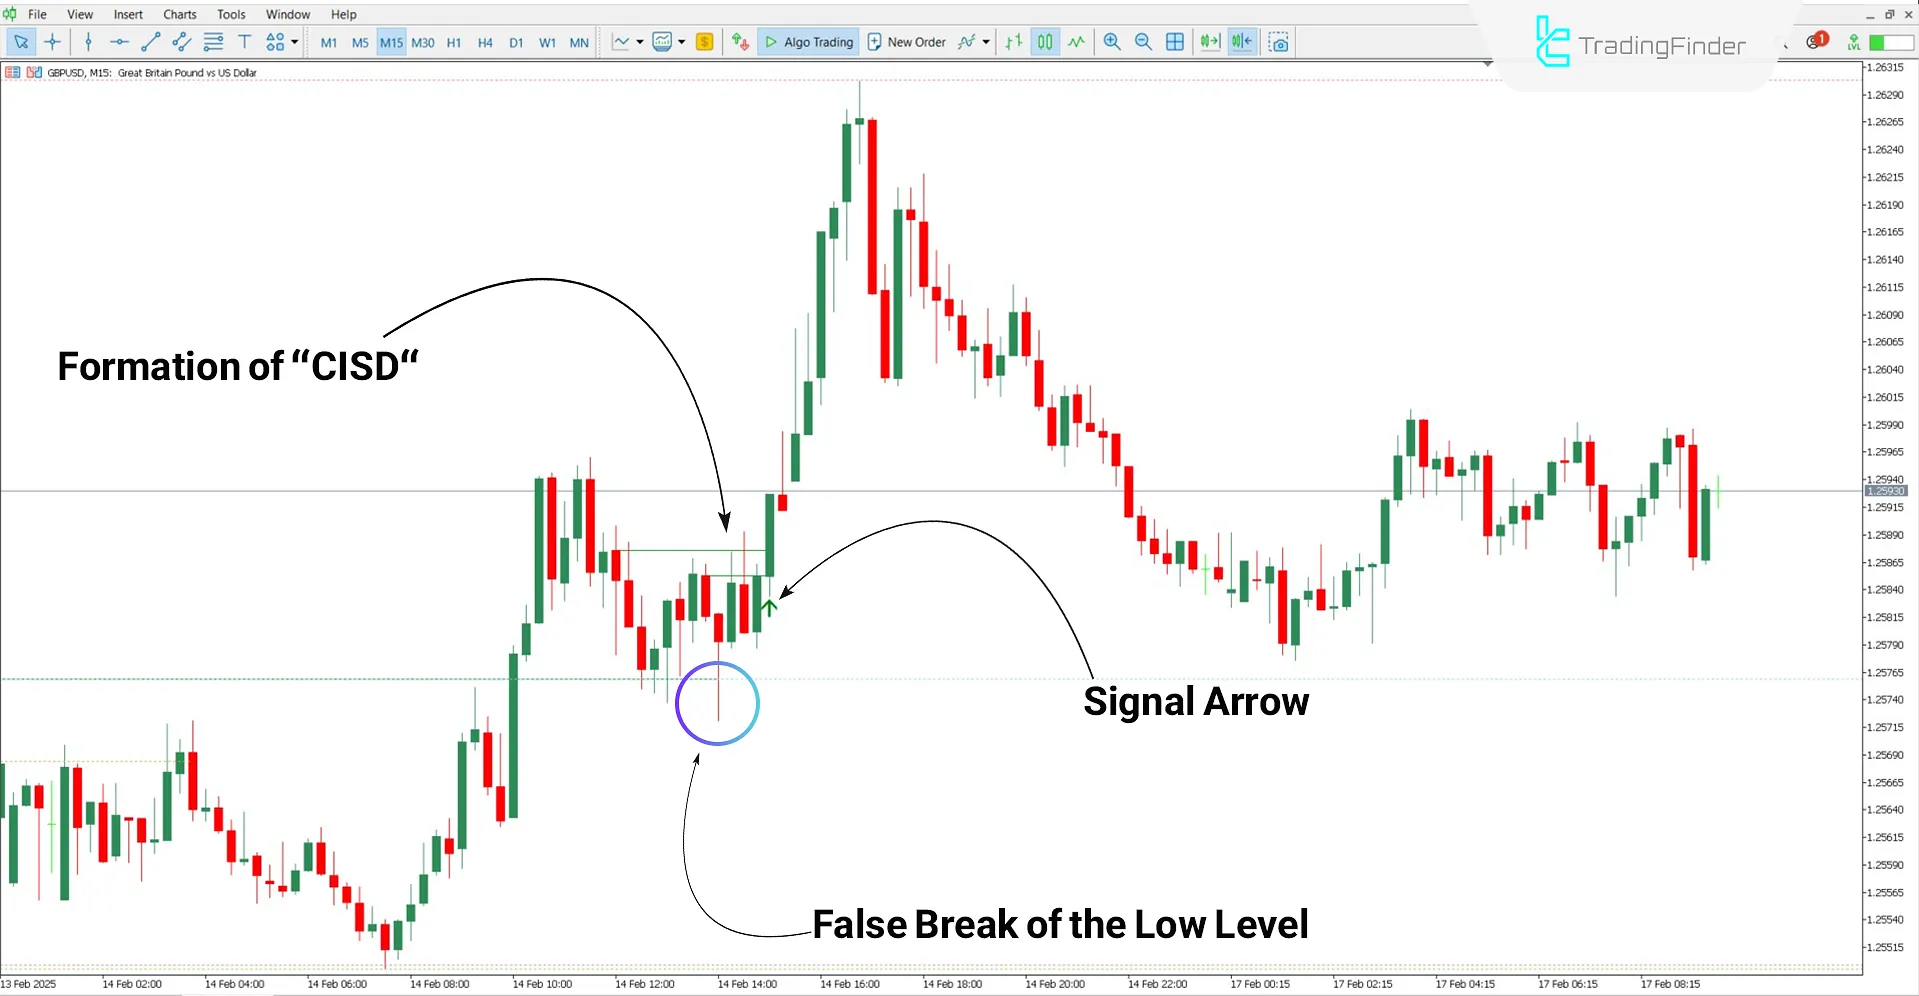
In the 15-minute chart analysis of the GBP/USD pair, the price creates a false break of the swing Low, reverses direction, and forms a CISD.
The indicator marks the CISD formation with a green arrow in this scenario, signaling a buy trade entry.

Indicator in a Downtrend
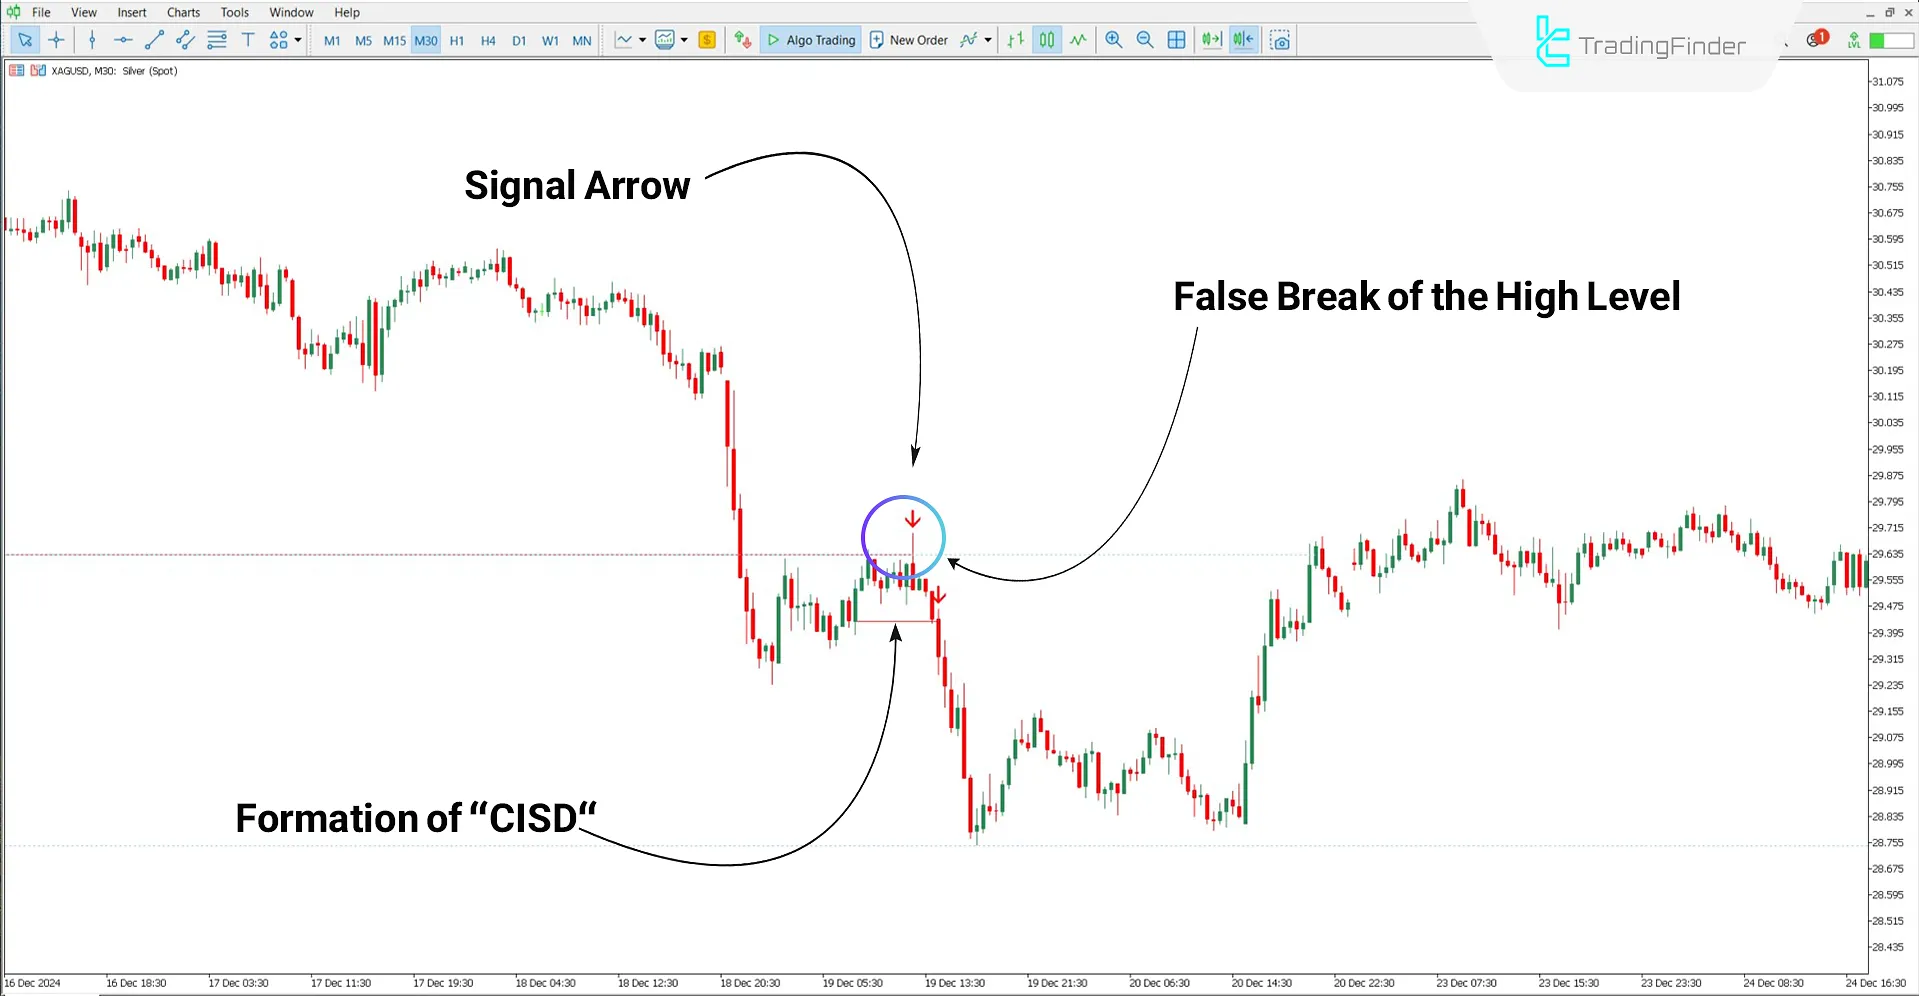
In the 30-minute chart of XAG/USD (Silver/USD), the price forms a false break during a bullish correction, then creates a CISD.
The indicator marks this with a red arrow, signaling a suitable sell trade entry.

CISD + High and Low Indicator Settings
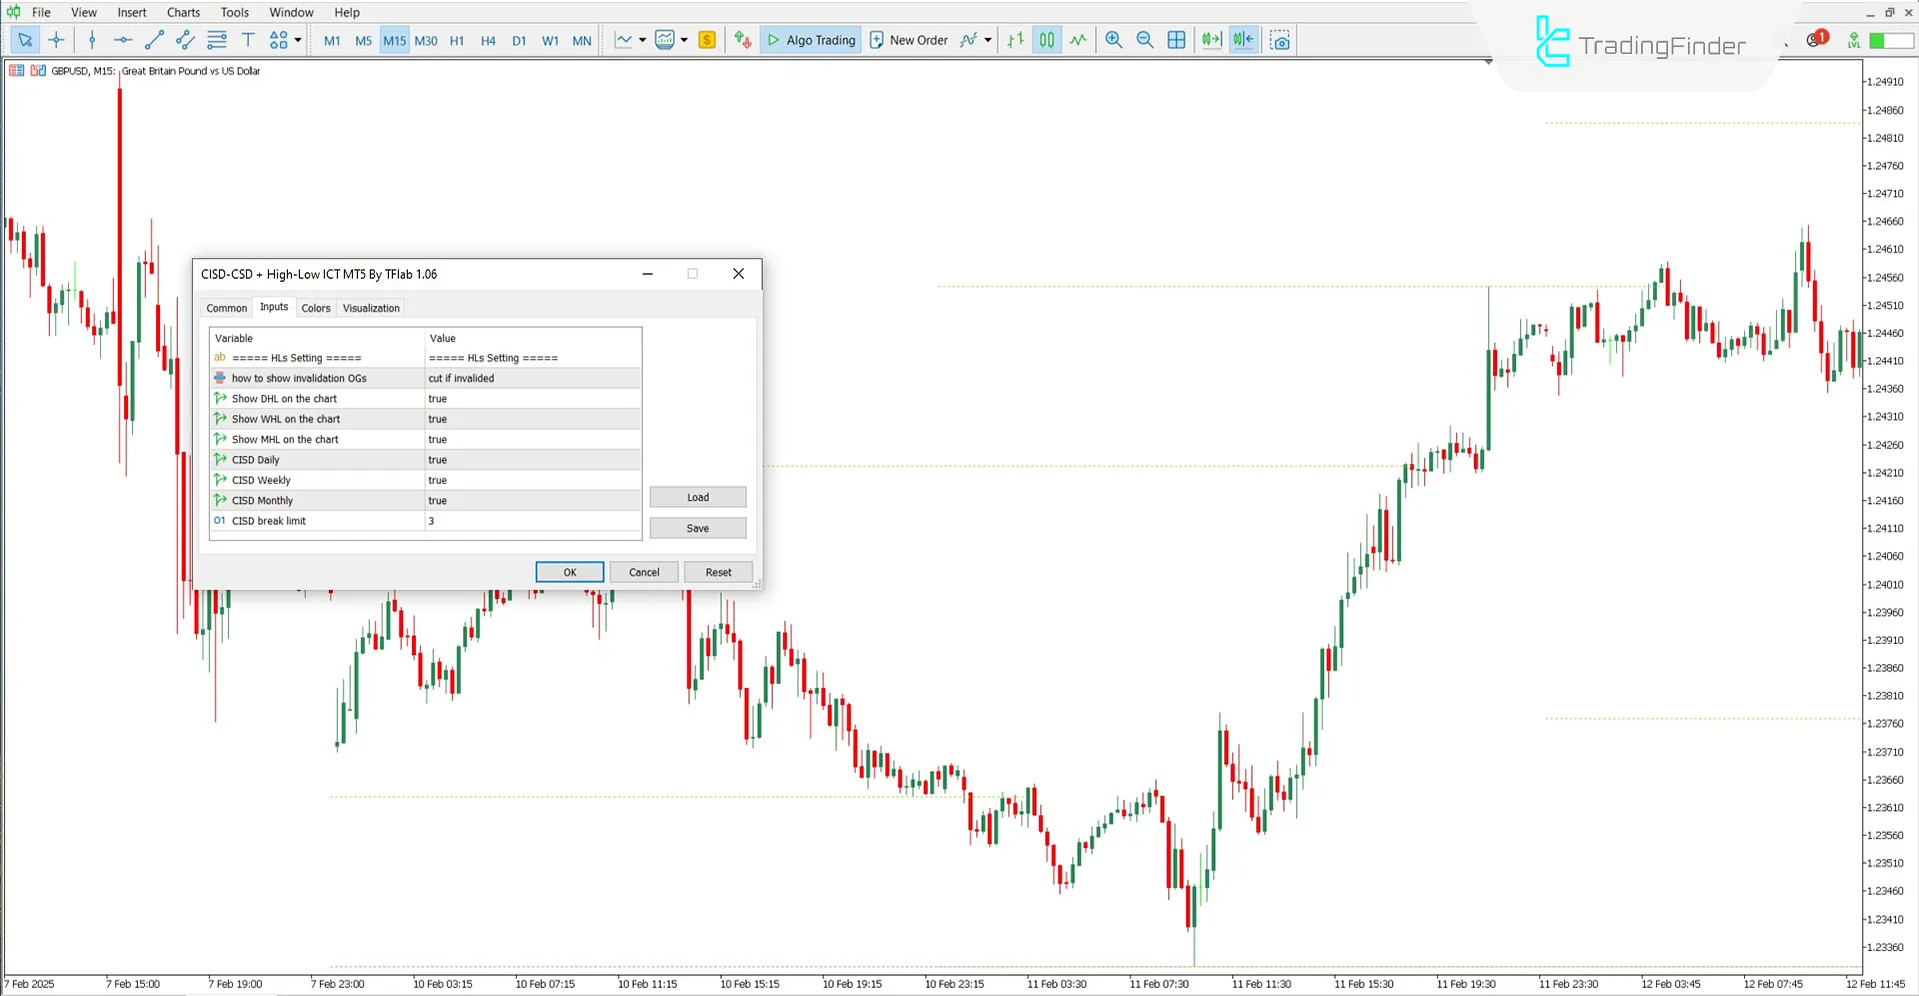
The image below displays the settings panel of the CISD – CSD + High and Low Indicator:

- How to show invalidation OGs: Displaying invalid zones
- Show DHL on the chart: Display daily timeframe high and low points
- Show WHL on the chart: Display weekly timeframe high and low points
- Show MHL on the chart: Display monthly timeframe high and low points
- CISD Daily: Display daily CISD
- CISD Weekly: Display weekly CISD
- CISD Monthly: Display monthly CISD
- CISD break limit: Set the limit for CISD level breaks
Conclusion
The CISD – CSD + High and Low Indicator facilitates market forecasting by displaying High/Low price levels and CISD lines.
This Trading tool plots High and Low levels and CISD based on daily, weekly, and monthly timeframes.
Designed using the Change in Supply and Demand (CISD) trading style, this indicator is ideal for liquidity based and ICT strategy traders.
CISD CSD High Low MT5 PDF
CISD CSD High Low MT5 PDF
Click to download CISD CSD High Low MT5 PDFIs the CISD – CSD + High and Low Indicator limited to Forex markets?
No, this indicator is compatible with all markets, including crypto, stocks, and commodities.
Is the CISD – CSD + High and Low Indicator suitable for beginners?
No, using this indicator requires familiarity with liquidity concepts and ICT methodology.


