![Current Volume Profile Indicator MT5 Download – Free – [TradingFinder]](https://cdn.tradingfinder.com/image/379783/13-124-en-current-volume-profile-mt5-01.webp)
![Current Volume Profile Indicator MT5 Download – Free – [TradingFinder] 0](https://cdn.tradingfinder.com/image/379783/13-124-en-current-volume-profile-mt5-01.webp)
![Current Volume Profile Indicator MT5 Download – Free – [TradingFinder] 1](https://cdn.tradingfinder.com/image/379784/13-124-en-current-volume-profile-mt5-02.webp)
![Current Volume Profile Indicator MT5 Download – Free – [TradingFinder] 2](https://cdn.tradingfinder.com/image/379785/13-124-en-current-volume-profile-mt5-03.webp)
![Current Volume Profile Indicator MT5 Download – Free – [TradingFinder] 3](https://cdn.tradingfinder.com/image/379782/13-124-en-current-volume-profile-mt5-04.webp)
The Current Volume Profile Indicator is a specialized tool for visualizing how trading volume is distributed across different market price levels.
Unlike many time based indicators, this tool focuses on transaction volume at specific price zones. This trading tool uses horizontal purple lines to show the volume traded at each price level.
The Current Volume Profile Indicator is an analytical tool that can be used alongside technical and even fundamental analysis to gain deeper insight into market behavior.
Current Volume Profile Indicator Specifications
The features and specifications of the Current Volume Profile Indicator are presented in the table below.
Indicator Categories: | Volume MT5 Indicators Liquidity Indicators MT5 Indicators Trading Assist MT5 Indicators Volume Profile Indicators for MetaTrader 5 |
Platforms: | MetaTrader 5 Indicators |
Trading Skills: | Intermediate |
Indicator Types: | Reversal MT5 Indicators |
Timeframe: | M1-M5 Timeframe MT5 Indicators M15-M30 Timeframe MT5 Indicators H1-H4 Timeframe MT5 Indicators |
Trading Style: | Swing Trading MT5 Indicators Scalper MT5 Indicators Day Trading MT5 Indicators |
Trading Instruments: | Forex MT5 Indicators Crypto MT5 Indicators Stock MT5 Indicators Forward MT5 Indicators |
Current Volume Profile at a Glance
One of the main features of the Current Volume Profile Indicator is its ability to identify the price level with the highest traded volume, known as POC (Point of Control).
This level is displayed using orange bars on the chart.
It's important to note that concentrated volume at a particular price often reflects large traders' activity and marks important support or resistance zones.
Bullish Trend Conditions
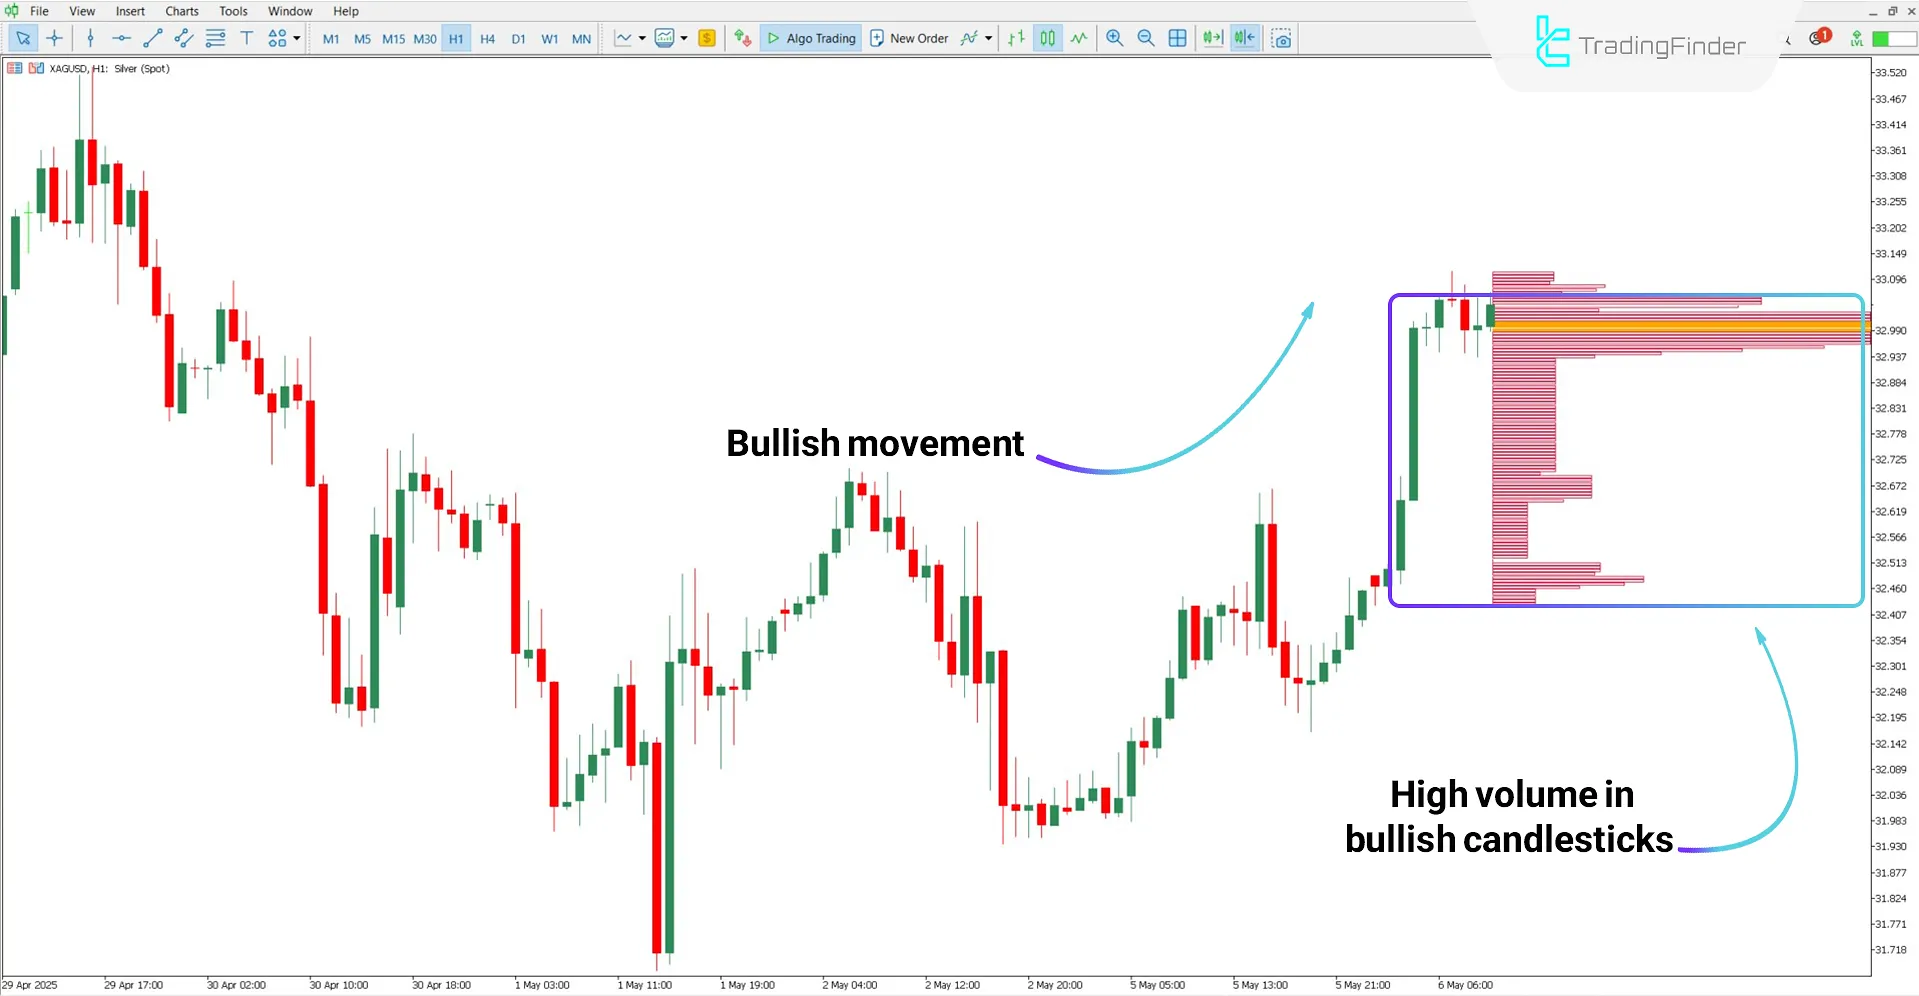
According to the XAG/USD (Silver/US Dollar) 1-hour chart, the overall market trend appears bullish, as higher lows confirm this upward move.
In the highlighted area, the distribution of trading volume across various price levels is displayed using purple histograms.
As shown, the bullish candle volume is higher than that of bearish ones, indicating buying strength when entering the market.

Bearish Trend Conditions
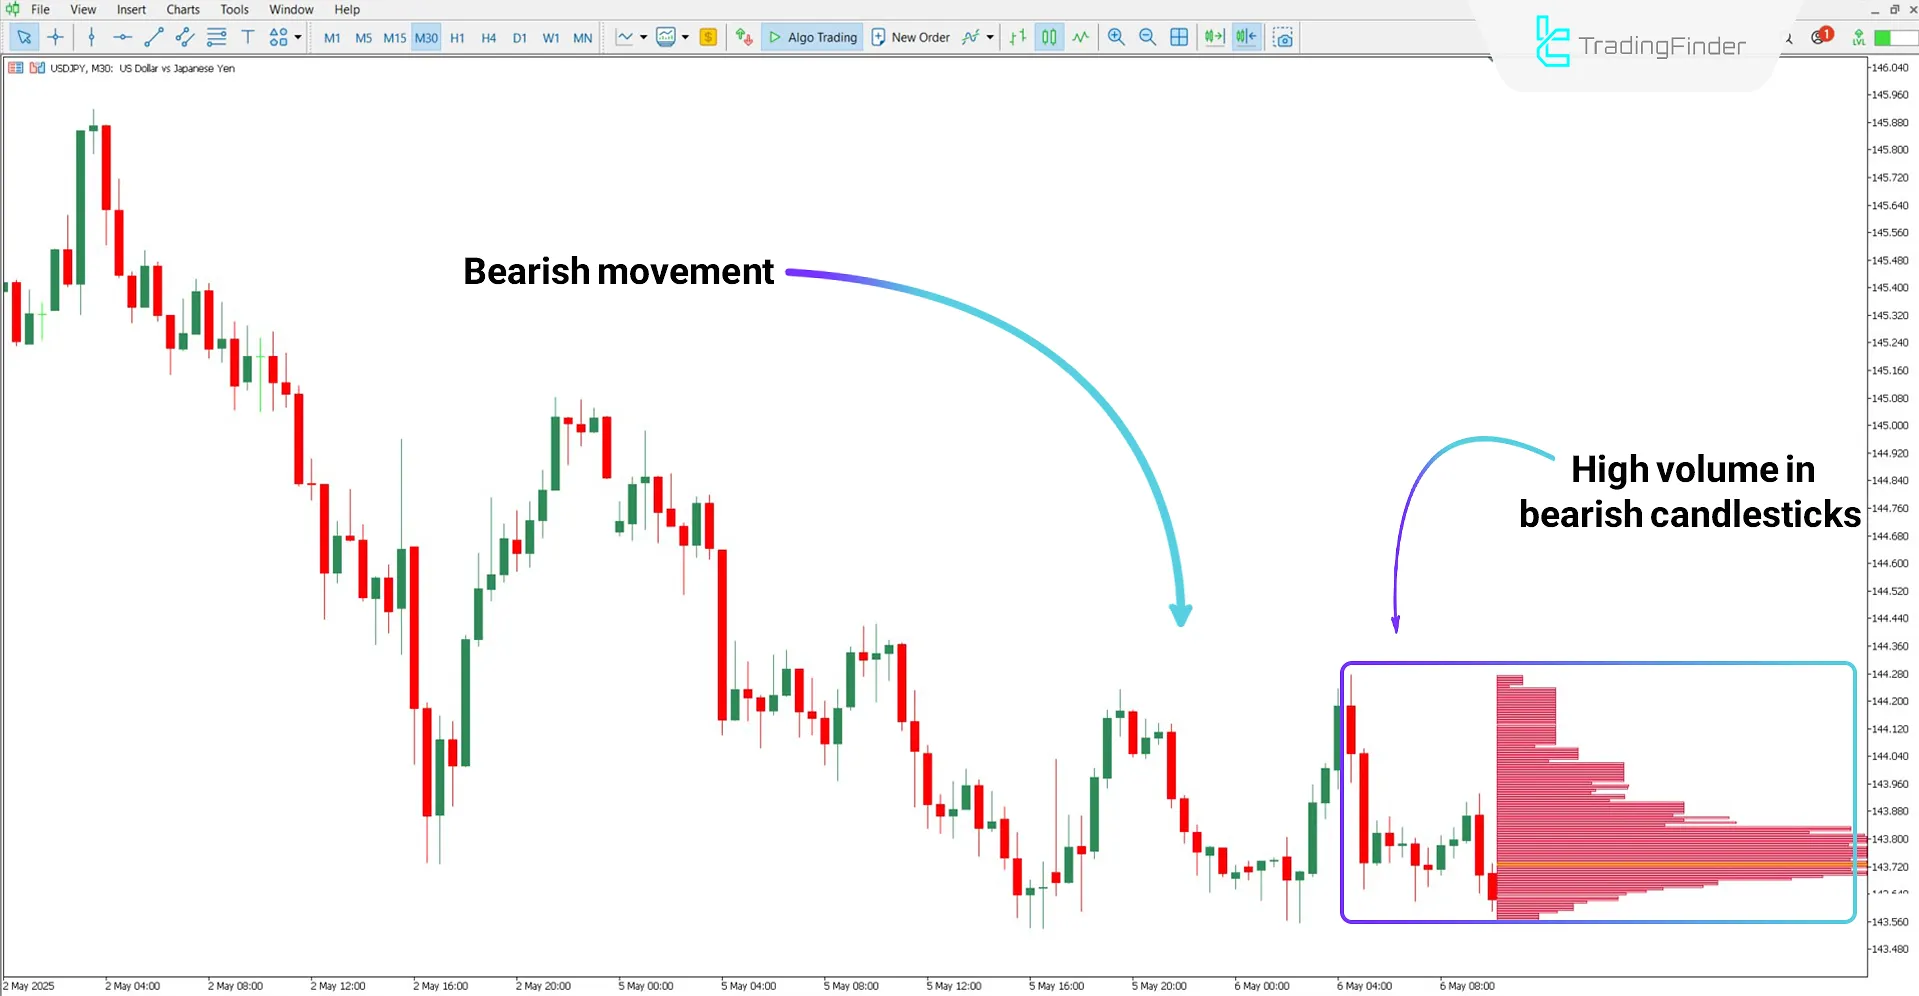
Based on the USD/JPY 30-minute chart, the volume histograms of bearish candles show a significant increase in trading volume.
This may indicate seller dominance and confirm ongoing downward pressure.
Additionally, orange bars on the chart highlight the levels with the highest trading volume, known as POC.

Current Volume Profile Indicator Settings
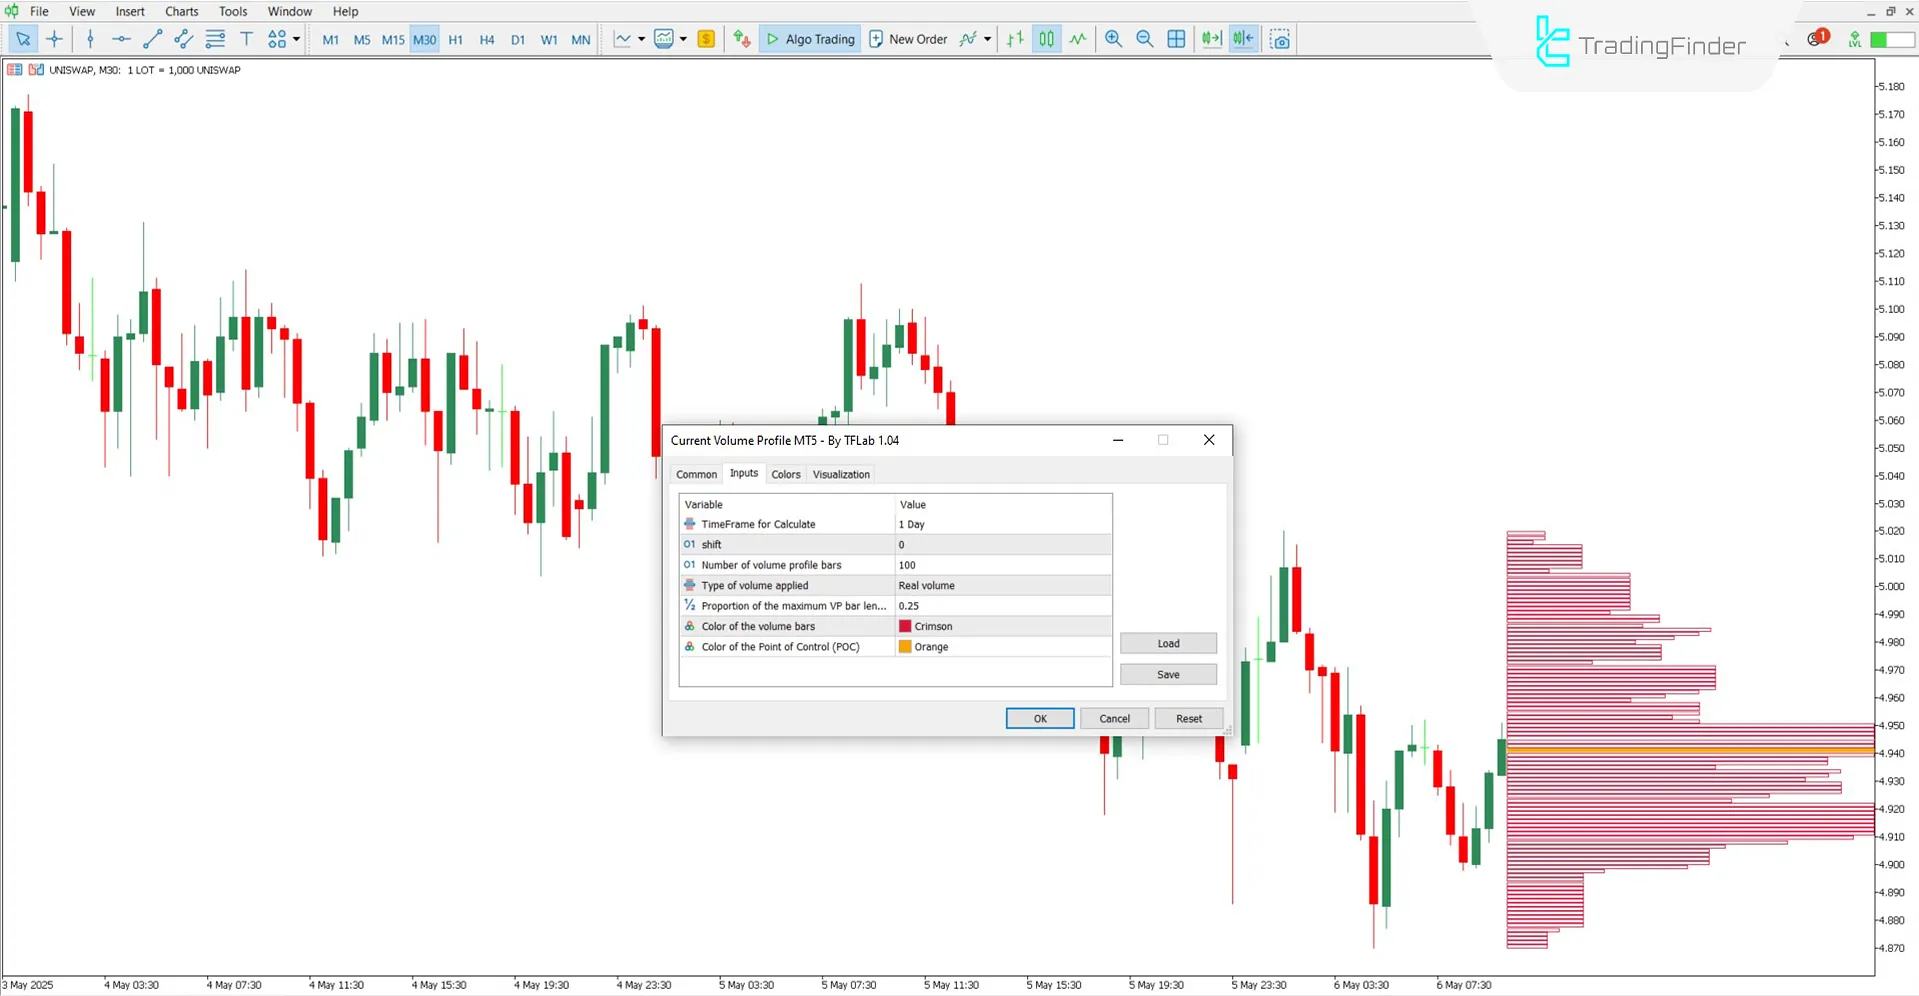
The following image shows the settings panel of the Current Volume Profile Indicator in MetaTrader 5:

- Timeframe for Calclulate: Defines the time range for analyzing volume data
- Shift: Adjusts the position of the histograms
- Number of VP bars: Sets the number of bars to display volume
- The ratio of maximum VP bar length to chart width: Controls the width ratio of the longest bar to chart width
- Bars color: Sets the color of volume bars
- POC color: Sets the color of high-volume (POC) bars
- Volume Profile Position: Determines where the volume profile is displayed on the chart
Note: For the indicator to function properly, the timeframe in the "TimeFrame for Calclulate" field must be greater than the timeframe in the active chart.
Conclusion
In technical analysis, combining price structure with volume profile distribution is one of the most effective ways to identify likely market direction.
The Current Volume Profile Indicator graphically displays volume at different price levels, allowing traders to anticipate market flow before price reacts.
Current Volume Profile MT5 PDF
Current Volume Profile MT5 PDF
Click to download Current Volume Profile MT5 PDFIs this indicator suitable for higher timeframes?
No, the Current Volume Profile Indicator is only usable on timeframes between 1 minute and 1 hour.
What does the "POC" level represent?
The POC (Point of Control) is the price level with the highest traded volume, often considered a key area in market behavior.


