![Custom High Low Indicator for MT5 Download - Free - [TradingFinder]](https://cdn.tradingfinder.com/image/277943/13-87-en-custom-high-low-mt5-01.webp)
![Custom High Low Indicator for MT5 Download - Free - [TradingFinder] 0](https://cdn.tradingfinder.com/image/277943/13-87-en-custom-high-low-mt5-01.webp)
![Custom High Low Indicator for MT5 Download - Free - [TradingFinder] 1](https://cdn.tradingfinder.com/image/277941/13-87-en-custom-high-low-mt5-02.webp)
![Custom High Low Indicator for MT5 Download - Free - [TradingFinder] 2](https://cdn.tradingfinder.com/image/277942/13-87-en-custom-high-low-mt5-03.webp)
![Custom High Low Indicator for MT5 Download - Free - [TradingFinder] 3](https://cdn.tradingfinder.com/image/277944/13-87-en-custom-high-low-mt5-04.webp)
The Custom High Low Indicator is designed to predict future price movements and identify support and resistance levels. This trading tool plots different price interaction levels across timeframes, from daily to 1-minute charts, using horizontal and colored lines.
Custom High Low Indicator Specifications
The table below lists the features and specifications of the Custom High Low Indicator.
Indicator Categories: | Support & Resistance MT5 Indicators Signal & Forecast MT5 Indicators Levels MT5 Indicators |
Platforms: | MetaTrader 5 Indicators |
Trading Skills: | Elementary |
Indicator Types: | Reversal MT5 Indicators |
Timeframe: | Multi-Timeframe MT5 Indicators |
Trading Style: | Intraday MT5 Indicators Scalper MT5 Indicators Fast Scalper MT5 Indicators |
Trading Instruments: | Forex MT5 Indicators Crypto MT5 Indicators Stock MT5 Indicators Commodity MT5 Indicators Forward MT5 Indicators |
Custom High Low Indicator at a Glance
The Custom High Low Indicator seamlessly adapts to various trading strategies with its flexible settings. Users can customize line colors and appearance and activate support and resistance levels for their preferred timeframes.
Bullish Trend Condition
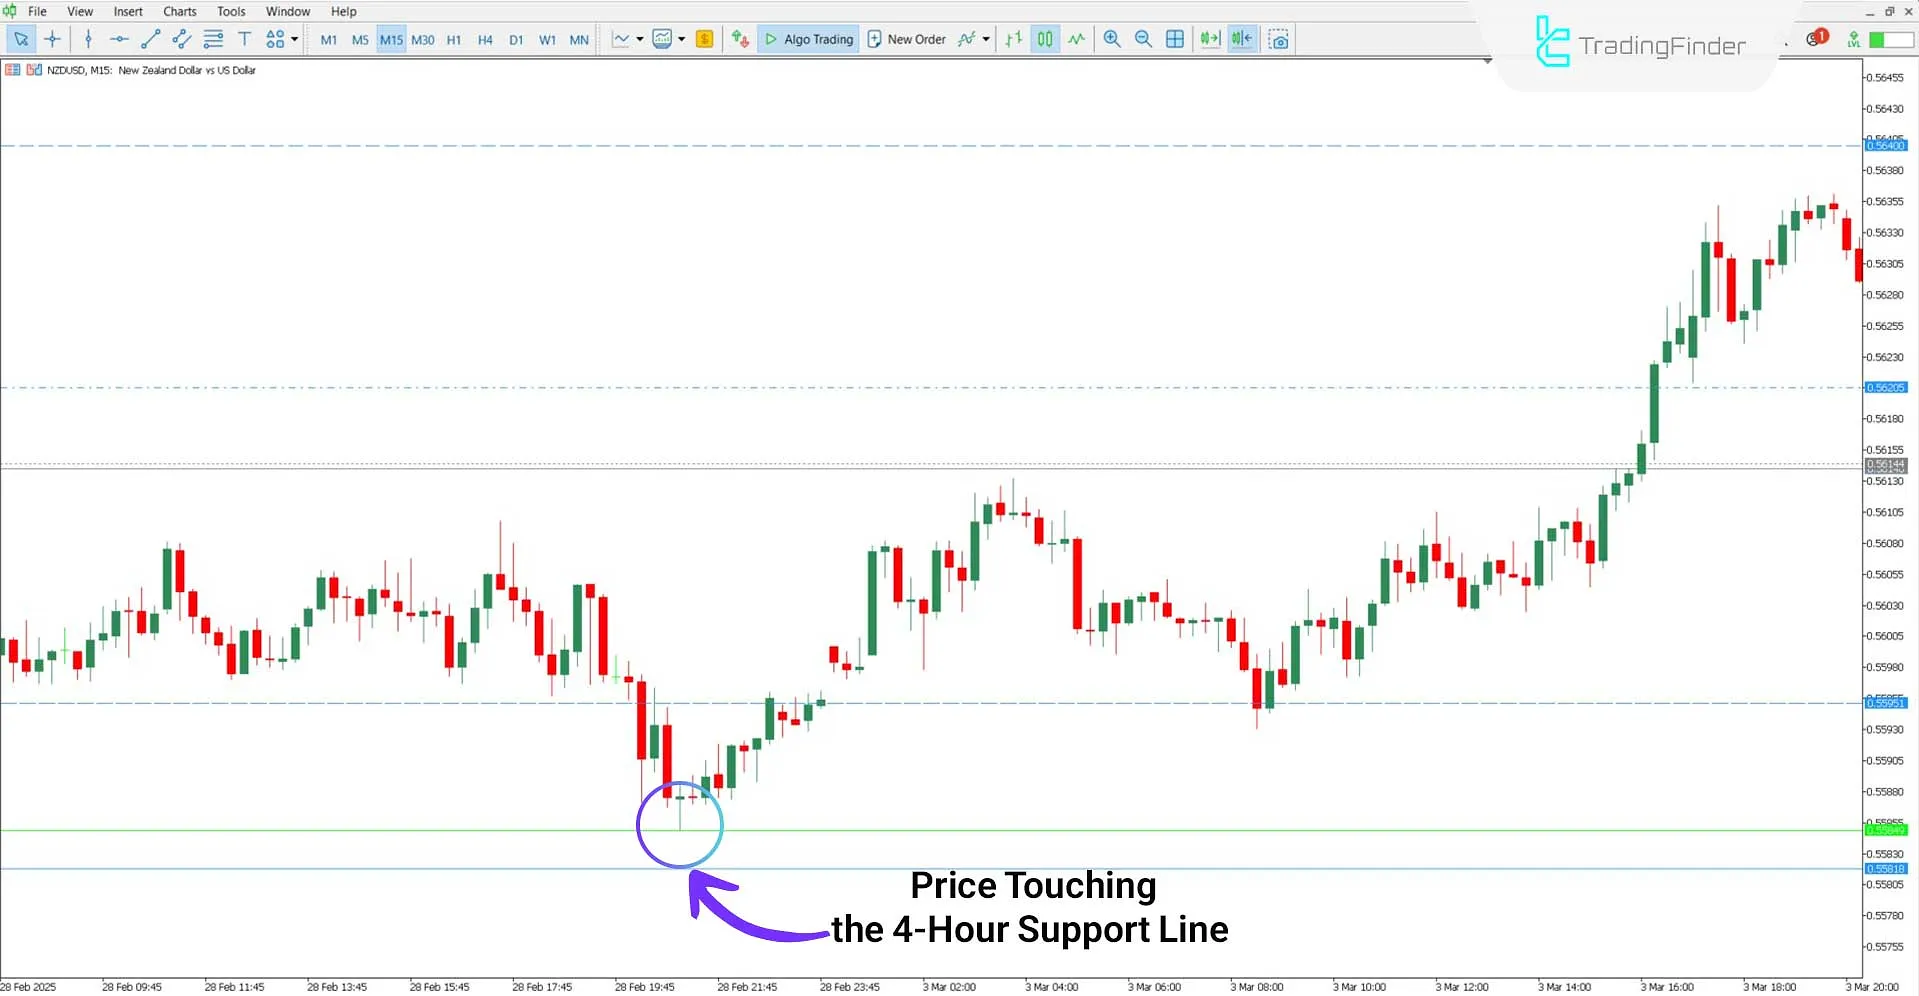
An analysis of the NZD/USD currency pair in the 15-minute timeframe demonstrates the functionality of the Custom High Low Indicator.
The chart below illustrates a trend reversal from bearish to bullish after the price touches the 4-hour support level.

Bearish Trend Condition
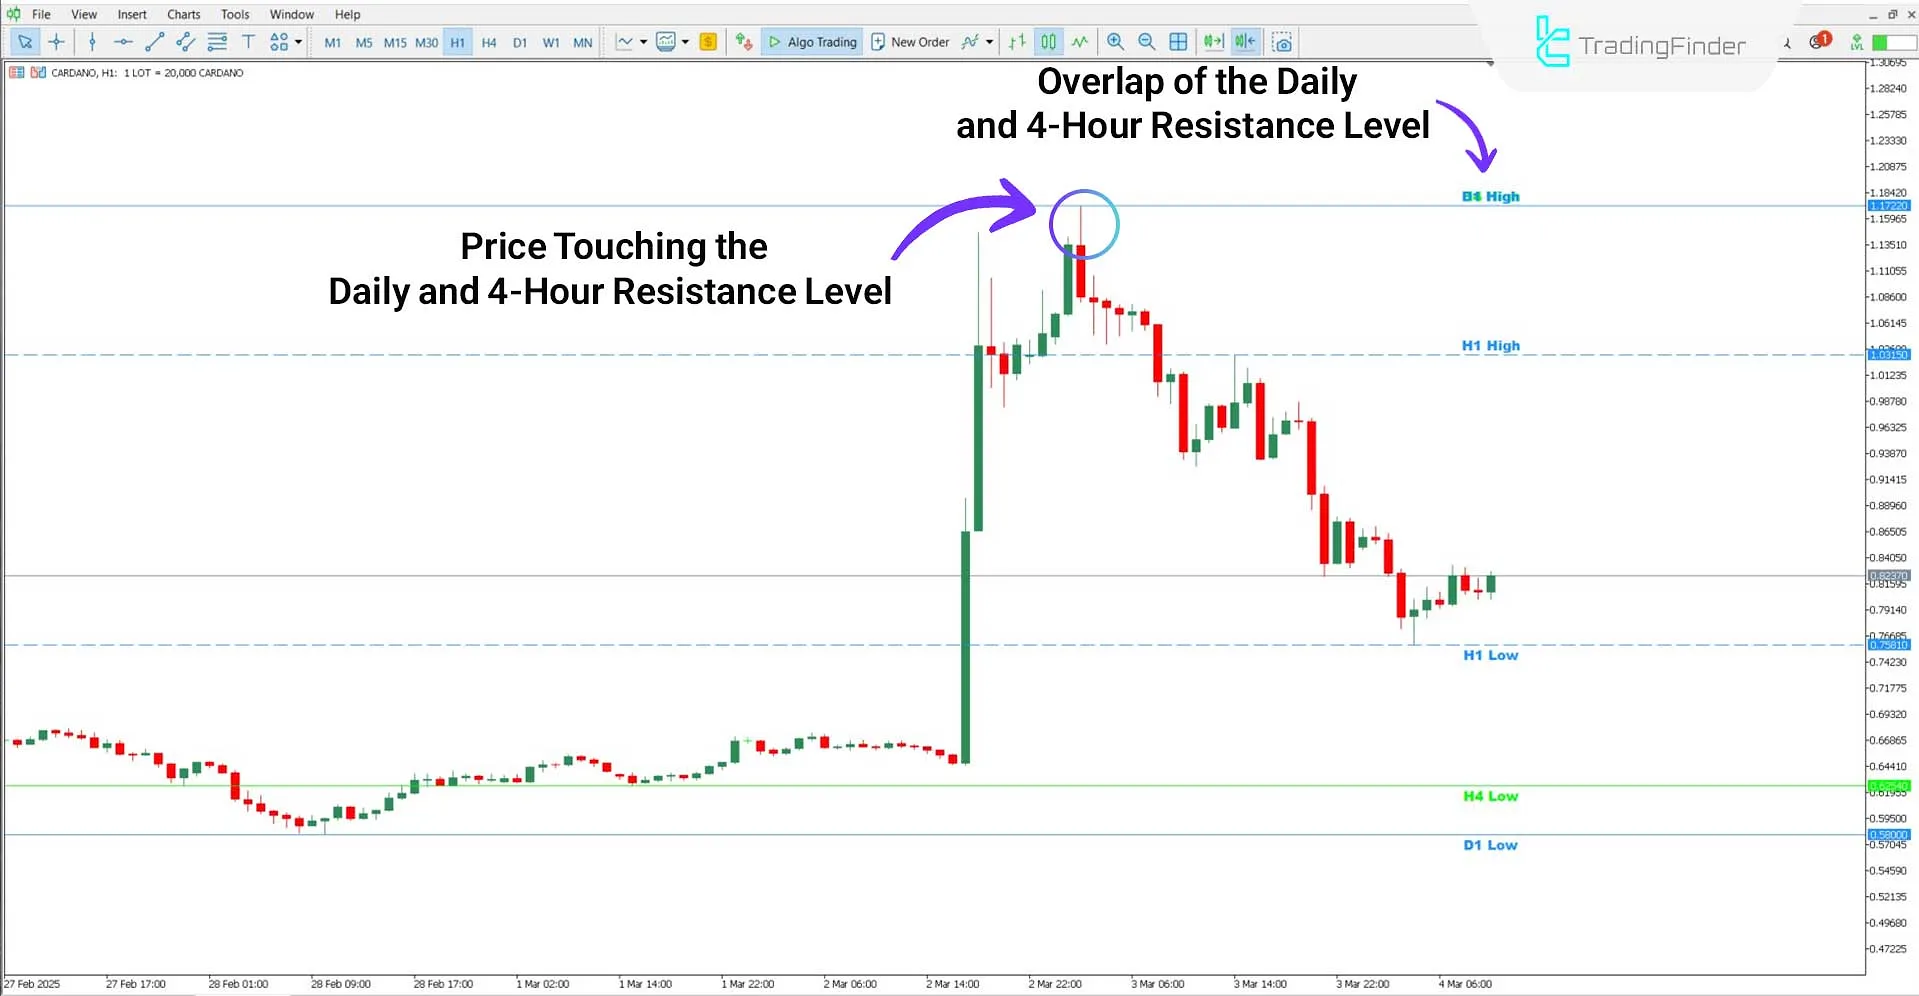
In Cardano's (ADA) one-hour chart, the daily and 4-hour resistance levels overlap, forming a strong resistance zone.
The image shows that the price moves downward after encountering this resistance.

Custom High Low Indicator Settings
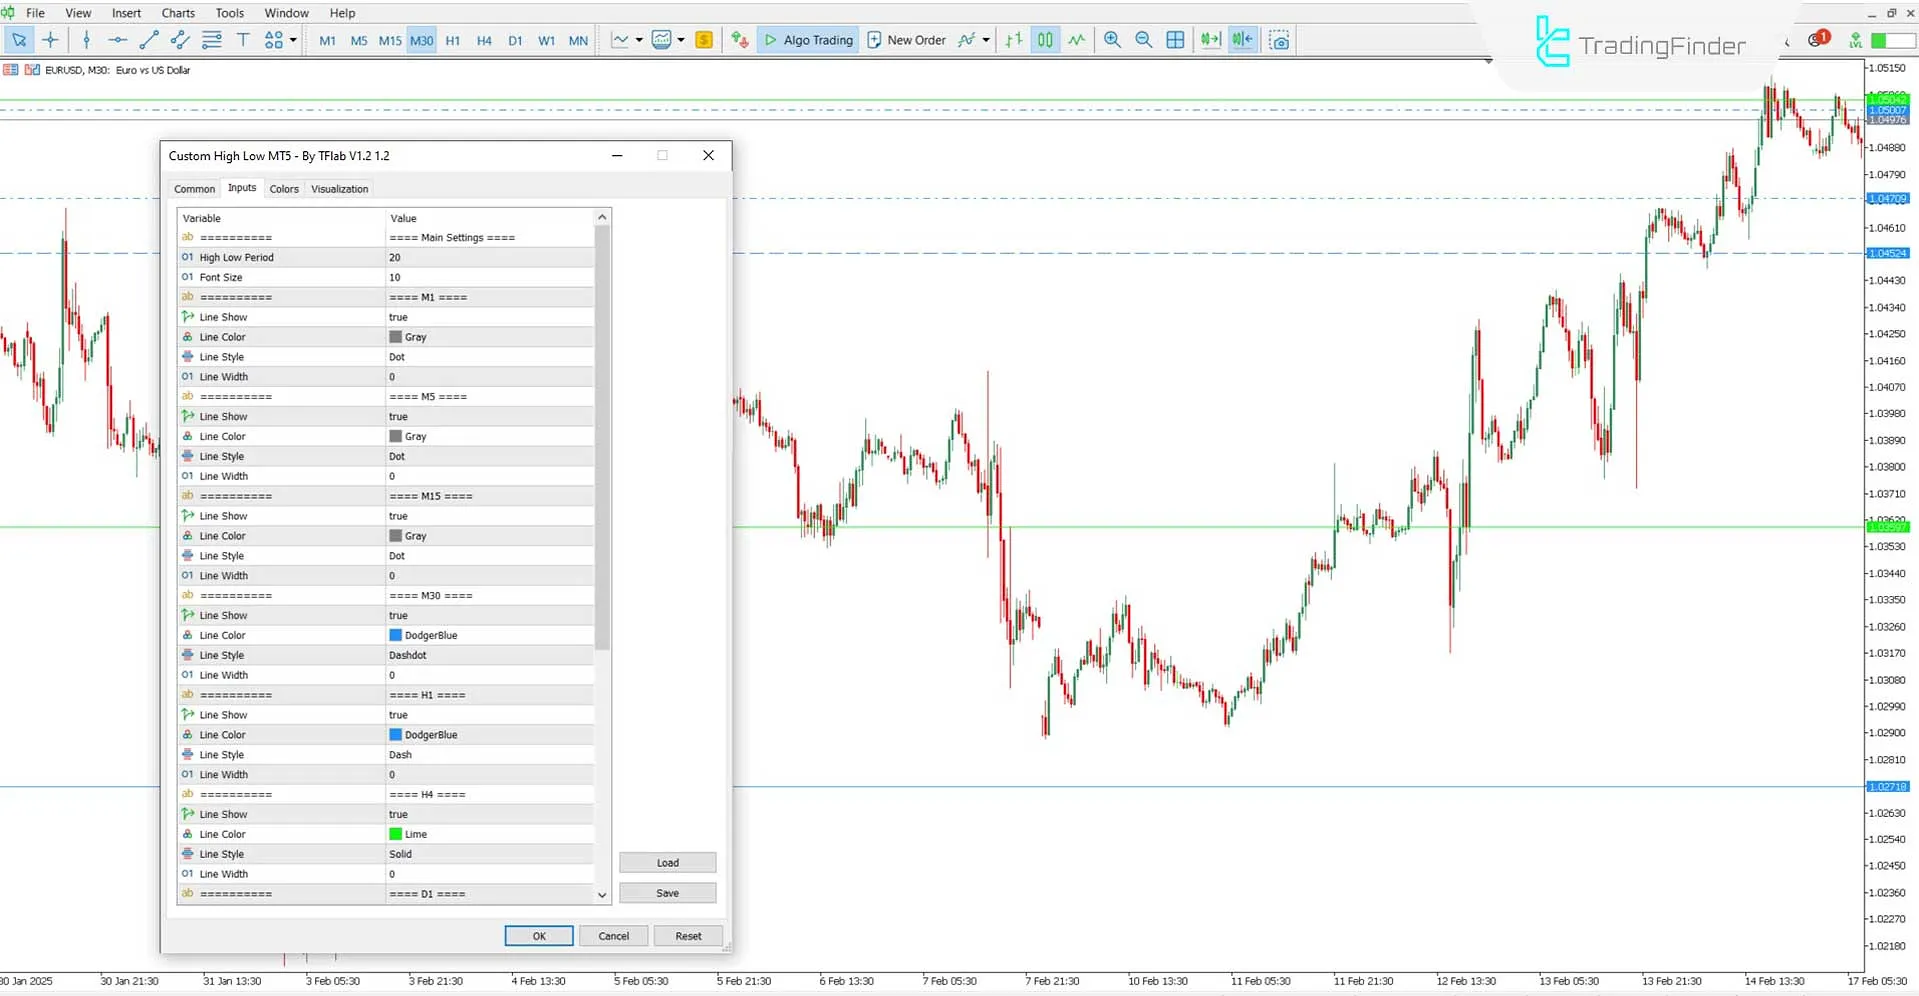
The following options are available in the Custom High Low Support & Resistance Indicator:

Main Setting
- High Low Period: Defines the calculation period for highs and lows
- Font Size: Adjust the label font size
Time Setting
Settings for support and resistance levels across all time frames are as follows:
- Line Show: Enables or disables the display of support and resistance lines
- Line Color: Sets the color of indicator lines
- Line Style: Select the appearance of the lines
- Line Width: Adjusts the thickness of support and resistance lines
Alert Setting
- Alert ON: Enables alerts
- Alert Sound ON: Activates the indicator's sound alert
- Sound File: Select the sound file for the alert
- Alert Email ON: Enables email alerts
Conclusion
The Custom High Low Indicator is a technical tool that visualizes key price interaction levels. This MT5 Levels indicator helps traders identify market fluctuations and optimal entry and exit points.
Furthermore, its extensive customization settings make it adaptable to various trading strategies.
Custom High Low MT5 PDF
Custom High Low MT5 PDF
Click to download Custom High Low MT5 PDFIs this indicator designed for professional traders?
No, this indicator suits traders of all skill levels due to its simple settings and clear visual representation.
Can this indicator identify breakout levels?
No, this indicator only plots price interaction levels using horizontal lines.


