![Daily High Low Indicator for MetaTrader 5 Download - Free - [Trading Finder]](https://cdn.tradingfinder.com/image/104776/10-18-en-daily-h-l-mt5-1.webp)
![Daily High Low Indicator for MetaTrader 5 Download - Free - [Trading Finder] 0](https://cdn.tradingfinder.com/image/104776/10-18-en-daily-h-l-mt5-1.webp)
![Daily High Low Indicator for MetaTrader 5 Download - Free - [Trading Finder] 1](https://cdn.tradingfinder.com/image/104710/10-18-en-daily-h-l-mt5-05.webp)
![Daily High Low Indicator for MetaTrader 5 Download - Free - [Trading Finder] 2](https://cdn.tradingfinder.com/image/104754/10-18-en-daily-h-l-mt5-06.webp)
![Daily High Low Indicator for MetaTrader 5 Download - Free - [Trading Finder] 3](https://cdn.tradingfinder.com/image/104724/10-18-en-daily-h-l-mt5-03.webp)
The Daily High-Low Indicator is part of a series of indicators for MetaTrader 5 that can be a suitable tool for identifying support and resistance levels on price charts. This indicator identifies the highest and lowest prices an asset or symbol registers on a trading day and marks them with two green and red lines.
These levels can be significant for traders in the next trading day. The prices of various assets often react to their previous day's support and resistance levels.
Indicator Table
Indicator Categories: | Price Action MT5 Indicators Support & Resistance MT5 Indicators Levels MT5 Indicators |
Platforms: | MetaTrader 5 Indicators |
Trading Skills: | Elementary |
Indicator Types: | Trend MT5 Indicators Breakout MT5 Indicators Reversal MT5 Indicators |
Timeframe: | Multi-Timeframe MT5 Indicators |
Trading Style: | Swing Trading MT5 Indicators Intraday MT5 Indicators Day Trading MT5 Indicators |
Trading Instruments: | Forex MT5 Indicators Crypto MT5 Indicators Stock MT5 Indicators Commodity MT5 Indicators Indices MT5 Indicators Forward MT5 Indicators Share Stock MT5 Indicators |
Indicator at a Glance
The Daily High and Low Indicator is an ideal tool for traders seeking to identify the previous day's high and low price levels to plan their trades accordingly.
This MetaTrader5 Support and Resistance indicator plots the previous day's high level in green and the last day's low level in red, helping traders easily recognize the price levels of the prior day and utilize this information in their decision-making process.
Buy Signal Conditions of the Indicator (Support Level)
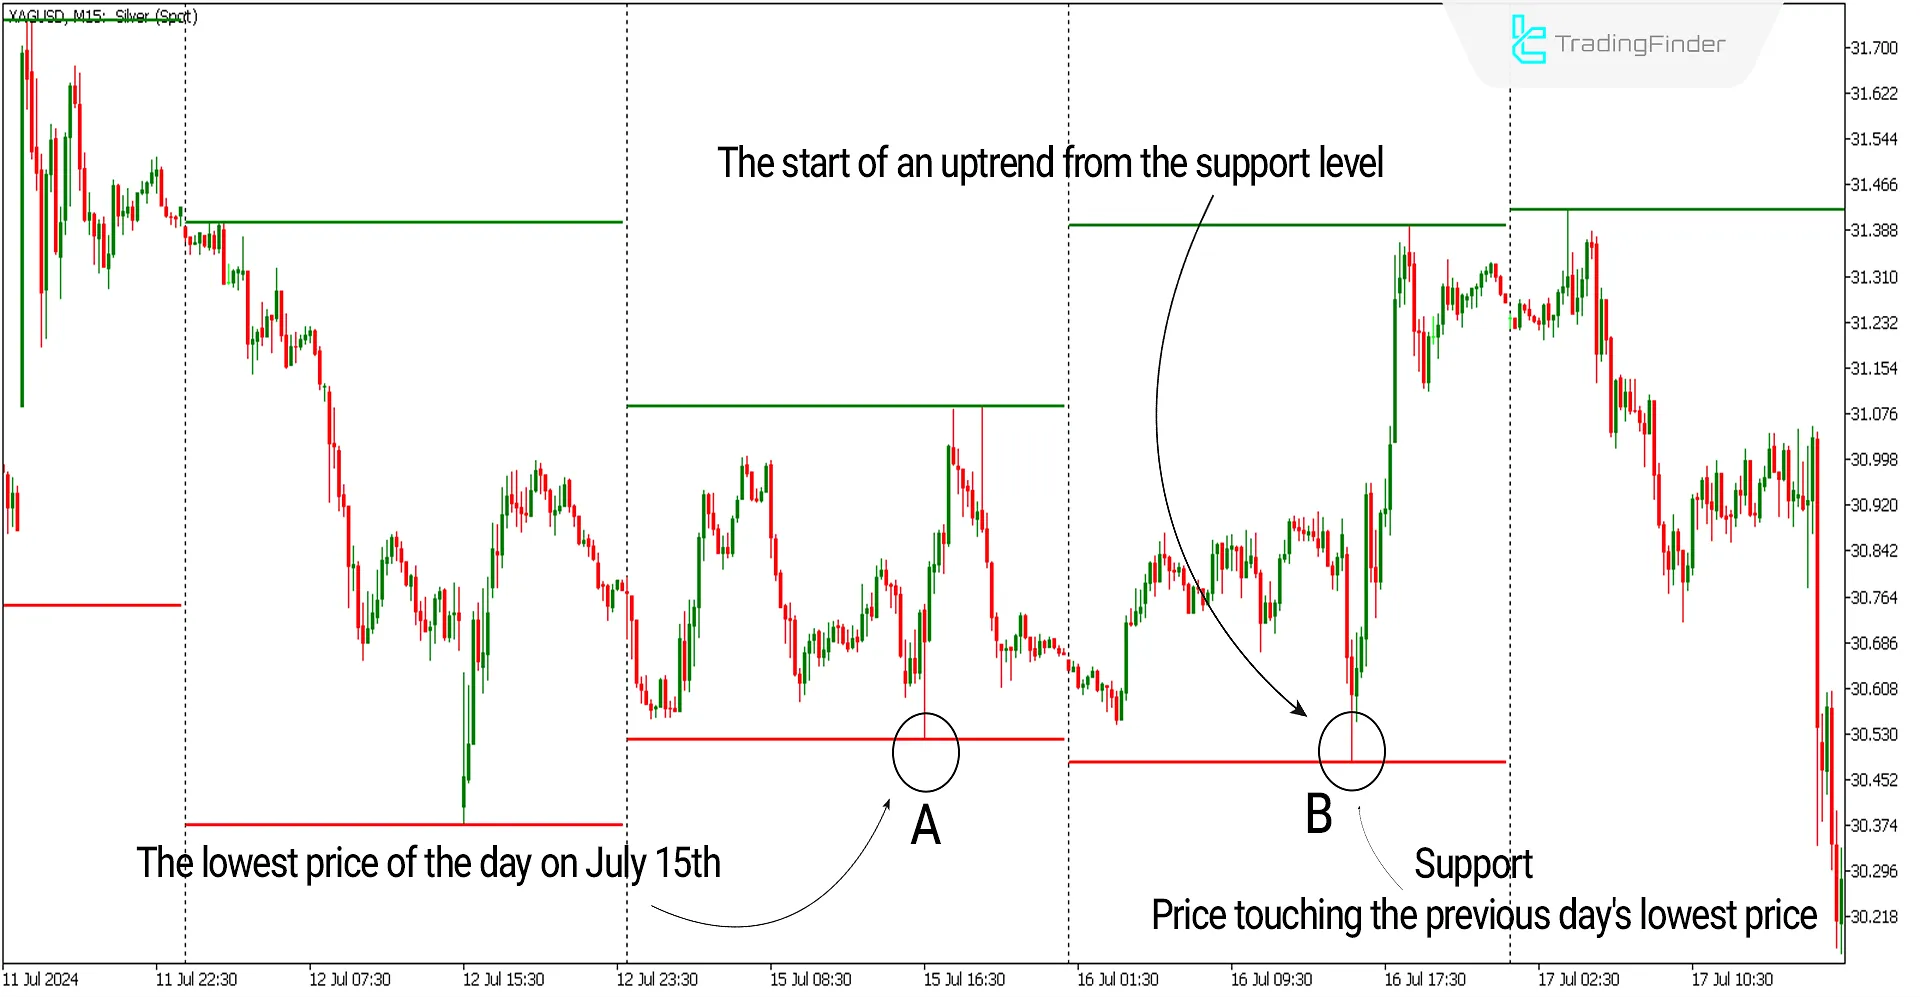
The chart below shows the price of global Silver (symbol XAGUSD) in a 15-minute timeframe. On July 15th, the chart had the lowest price of the day at point (A) of 530/30. On the next trading day, the price returned to the same range at point (B) and showed a bullish reaction to the previous day's support (Support) level. Traders could have looked for an entry trigger, such as candlestick patterns, to enter Buy trades in this range on lower timeframes.
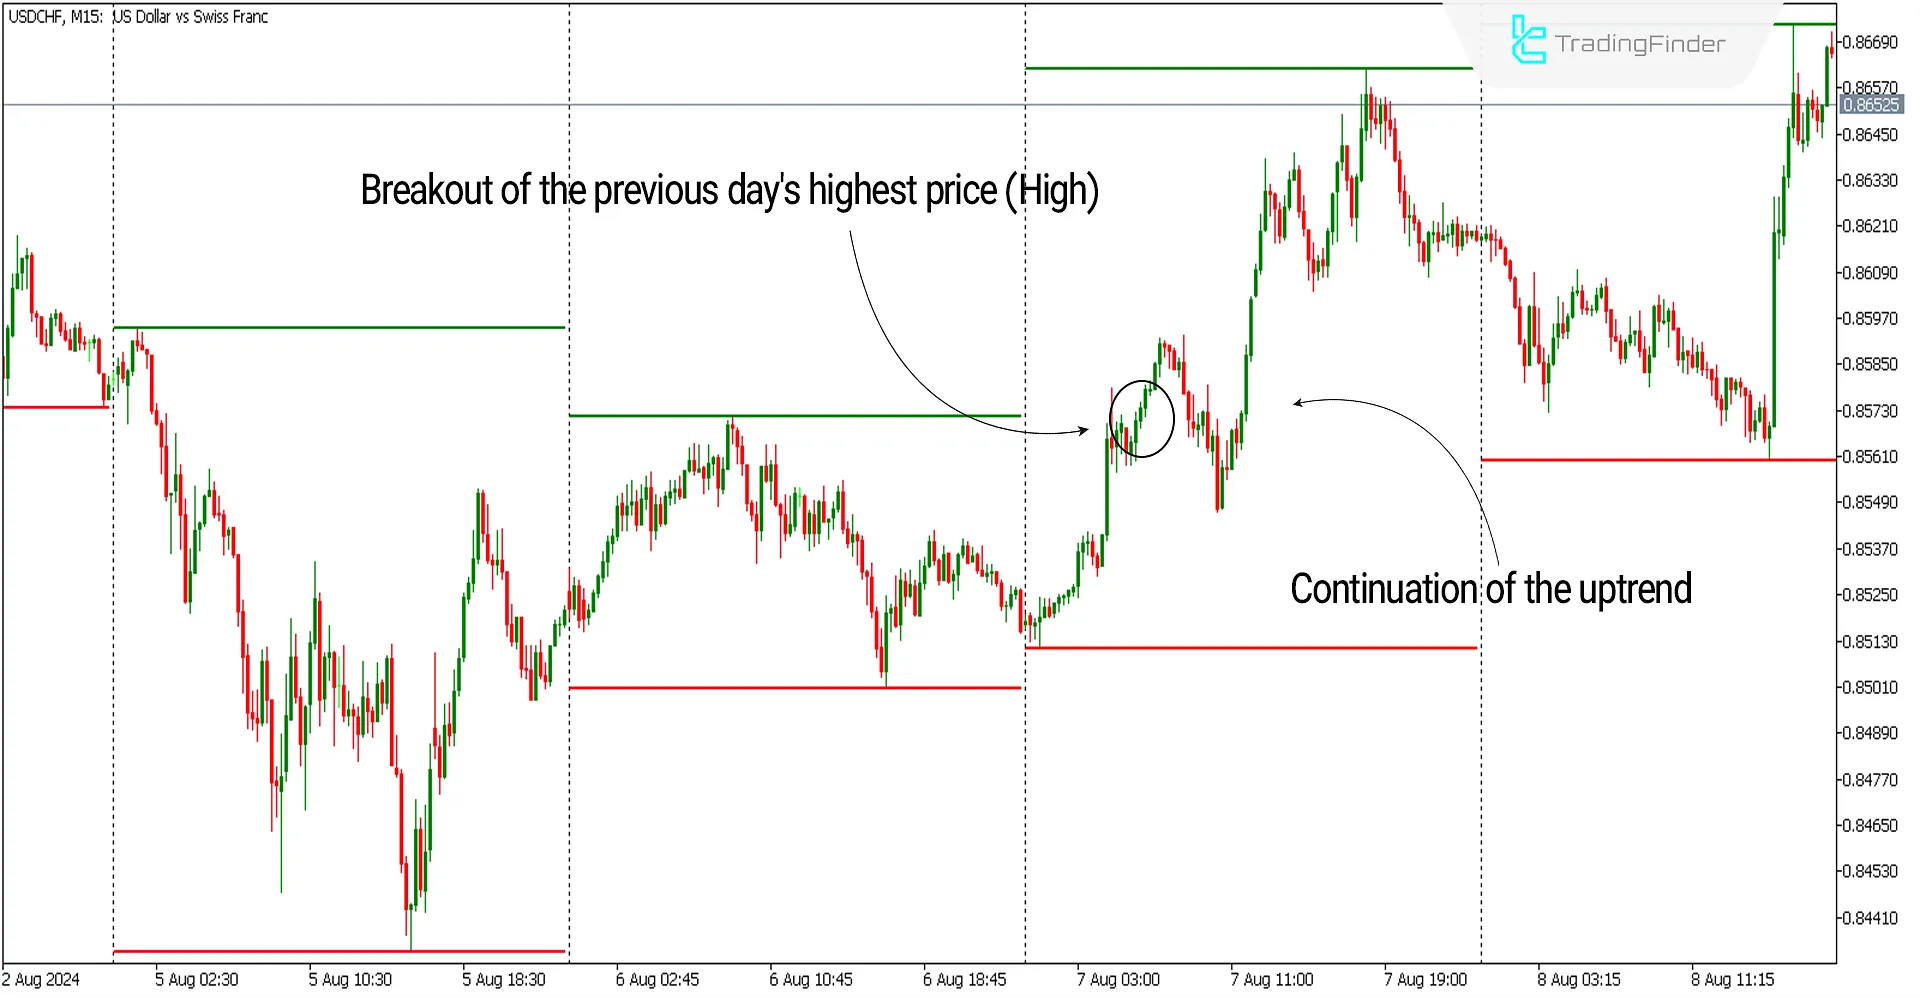
In the chart below for the USD to CHF currency pair (USDCHF), the price strongly broke the previous day's resistance level (the highest price) and continued its uptrend after a retracement.
Sell Signal Conditions of the Indicator (Resistance Level)
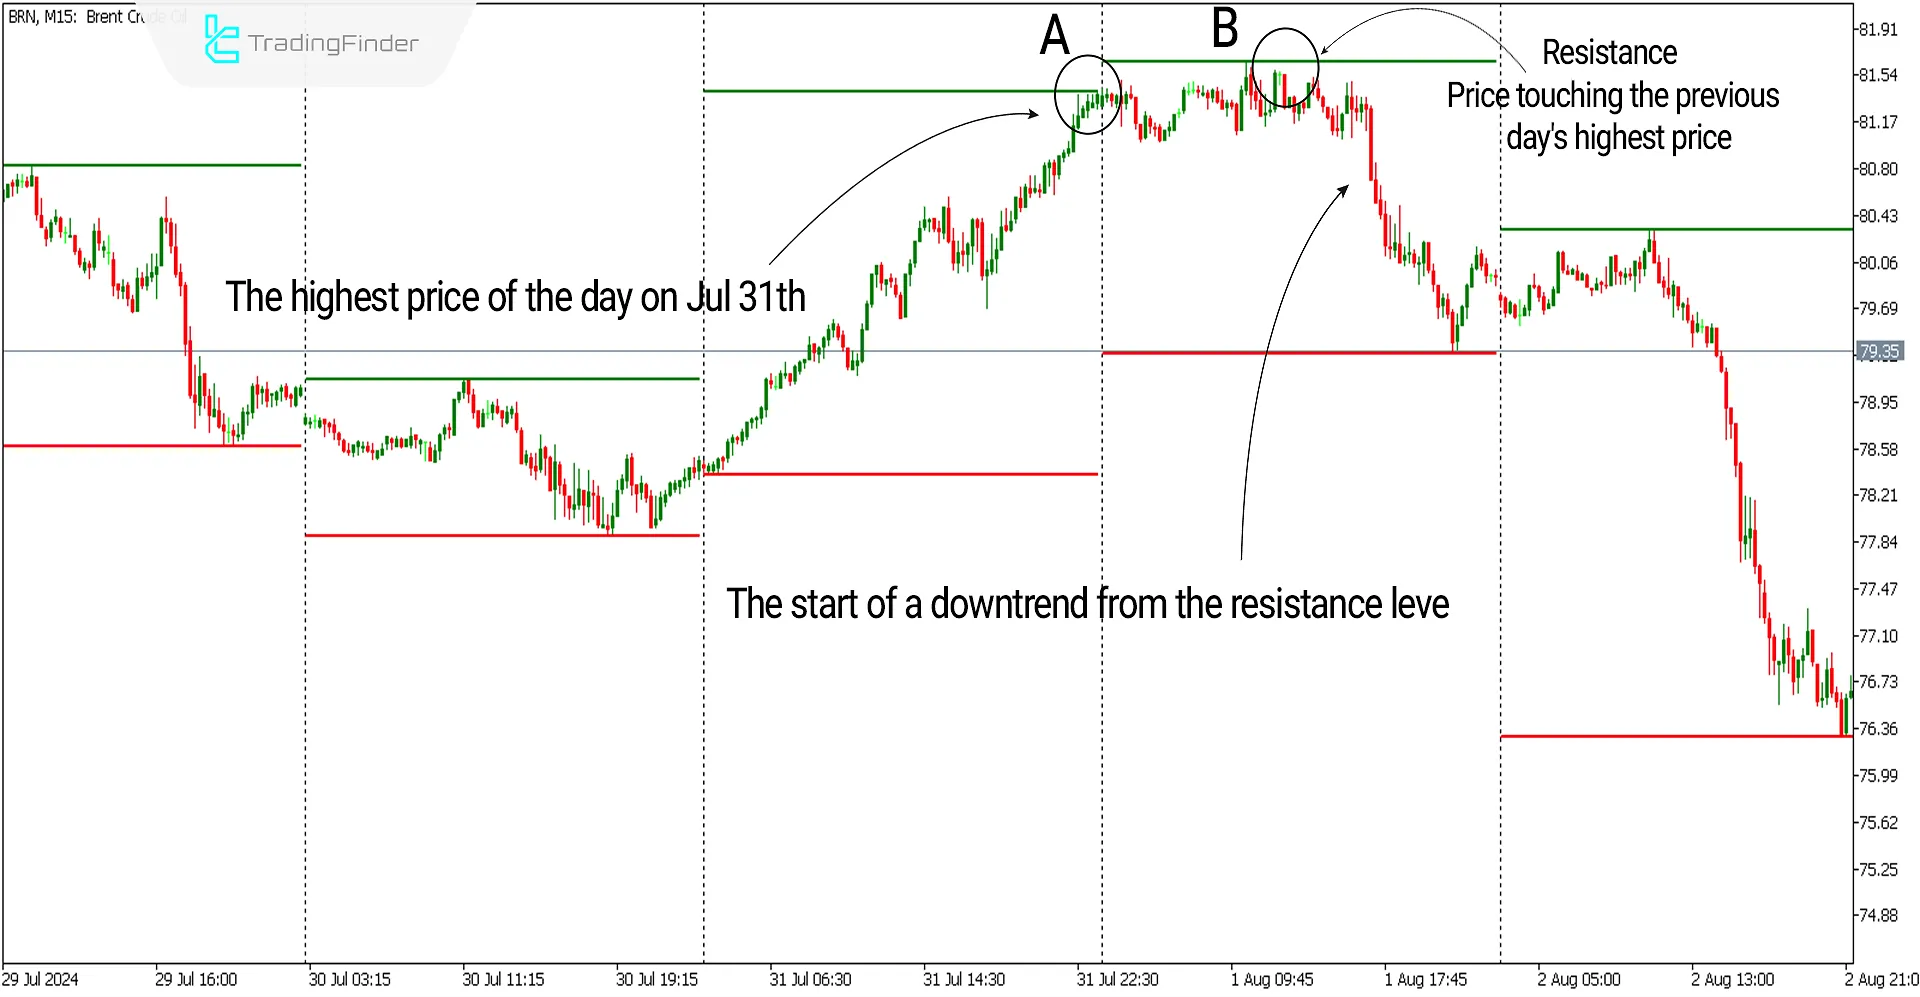
The chart below shows the price of Brent Crude Oil (symbol BRN) in a 15-minute timeframe. On July 31st, the chart had the highest price of the day at point (A), 54/81. On the next trading day, the price returned to the same range at point (B) and showed a significant bearish reaction to the previous day's resistance (Resistance) level, a crucial point to note for cautious traders.
Traders in this range could have identified an Ending Wedge pattern in the same timeframe and entered Sell trades upon breaking it downwards.
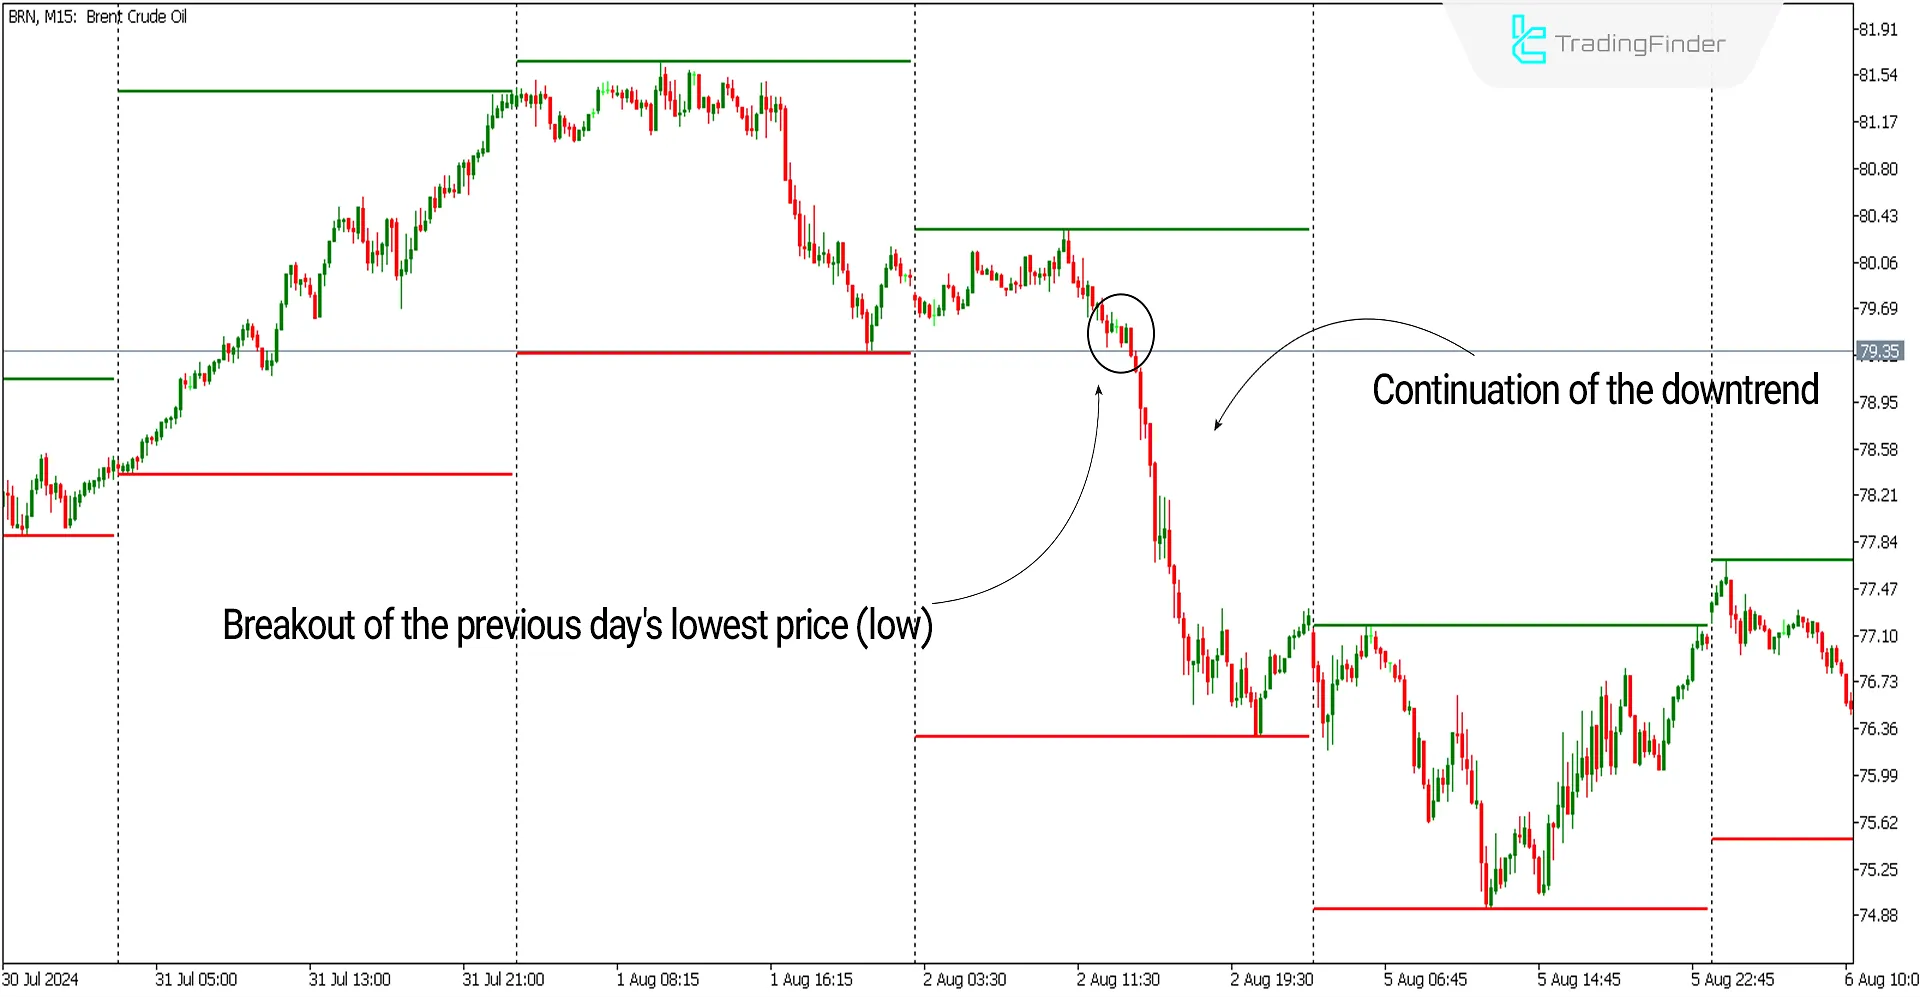
The next day, on August 2nd, the same symbol (Brent Crude Oil) broke the previous day's lowest price and continued the current downtrend.
Daily High-Low Indicator Settings
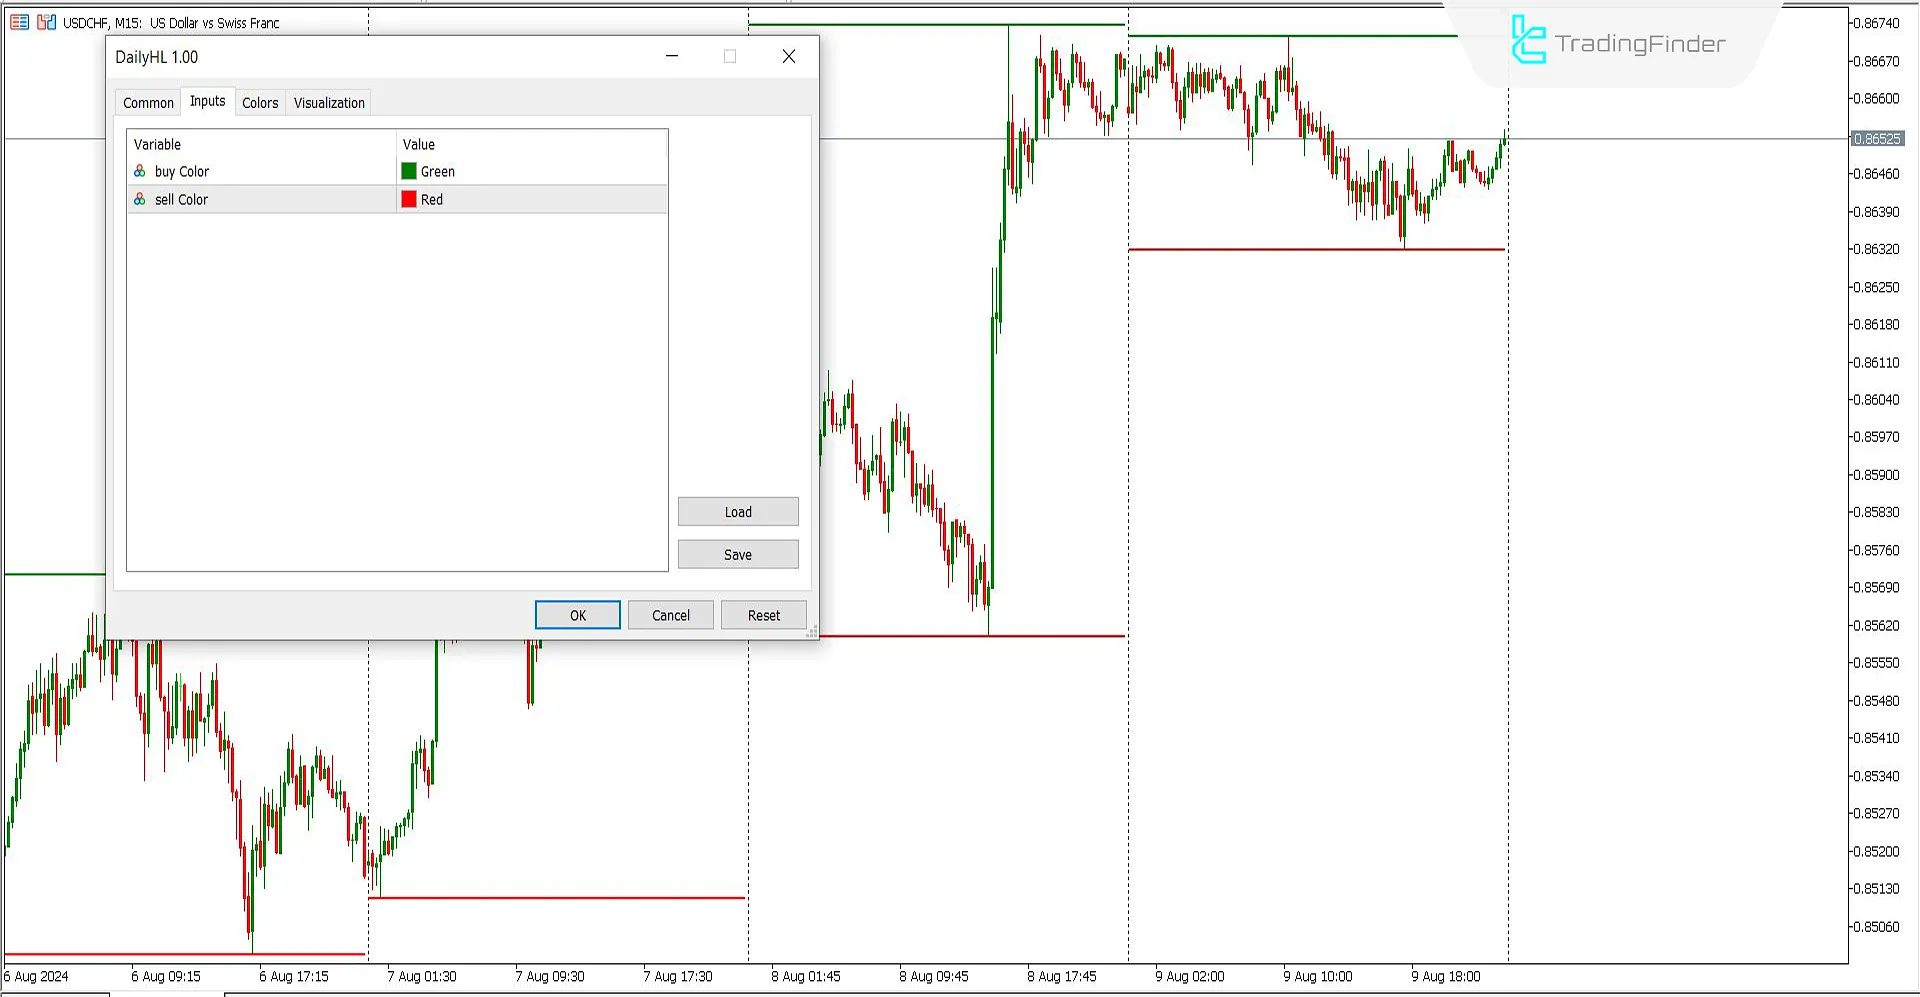
- Buy Color: The color for the highest price level can be green or any preferred color;
- Sell Color: The color for the lowest price level can be green or any preferred color.
Conclusion
The Daily H-L Indicator identifies significant and valid support and resistance levels for traders to use on their charts. These levels can be considered trading opportunities using several complementary technical analysis tools. Additionally, this indicator automatically displays these levels with green and red colors, eliminating the need to spend time analyzing the chart.
Daily High Low MT5 PDF
Daily High Low MT5 PDF
Click to download Daily High Low MT5 PDFWhat is the use of the Daily High-Low Indicator?
This indicator identifies each trading day's highest and lowest prices, which can act as support and resistance, and displays them on the chart.
Can the Daily H-L Indicator be used alongside other tools?
This indicator can be combined with other technical tools, such as Reversal and Continuation Patterns, to enhance trading signals and increase accuracy.


