![Diamond Pattern Indicator for MetaTrader5 Download - free - [TradingFinder]](https://cdn.tradingfinder.com/image/106700/10-19-en-diamond-pattern-mt5.webp)
![Diamond Pattern Indicator for MetaTrader5 Download - free - [TradingFinder] 0](https://cdn.tradingfinder.com/image/106700/10-19-en-diamond-pattern-mt5.webp)
![Diamond Pattern Indicator for MetaTrader5 Download - free - [TradingFinder] 1](https://cdn.tradingfinder.com/image/31139/10-19-en-diamond-pattern-mt5-02.avif)
![Diamond Pattern Indicator for MetaTrader5 Download - free - [TradingFinder] 2](https://cdn.tradingfinder.com/image/31142/10-19-en-diamond-pattern-mt5-03.avif)
![Diamond Pattern Indicator for MetaTrader5 Download - free - [TradingFinder] 3](https://cdn.tradingfinder.com/image/31147/10-19-en-diamond-pattern-mt5-04.avif)
The Diamond Pattern Indicator is part of a series of MetaTrader 5 Indicatorsthat identifies the diamond pattern, one of the chart patterns. This pattern helps traders predict the direction of future trends.
In areas of the chart that could be more easily analyzed for the trader, this indicator provides trading ideas regarding the price direction by identifying this pattern.
The Bullish Diamond Pattern forms at the end of a downtrend, indicating a reversal to an uptrend, while the Bearish Diamond Pattern forms at the end of an uptrend, suggesting a reversal to a downtrend.
Indicator Table
Indicator Categories: | Signal & Forecast MT5 Indicators Chart & Classic MT5 Indicators Candle Sticks MT5 Indicators |
Platforms: | MetaTrader 5 Indicators |
Trading Skills: | Intermediate |
Indicator Types: | Entry & Exit MT5 Indicators Reversal MT5 Indicators |
Timeframe: | Multi-Timeframe MT5 Indicators |
Trading Style: | Swing Trading MT5 Indicators Intraday MT5 Indicators Day Trading MT5 Indicators |
Trading Instruments: | Forex MT5 Indicators Crypto MT5 Indicators Stock MT5 Indicators Commodity MT5 Indicators Indices MT5 Indicators Share Stock MT5 Indicators |
Overview
Like other technical analysis tools, the Diamond Pattern Indicator identifies classic and chart patterns in price charts.
The diamond pattern, like reversal patterns, can help determine the direction of the trend. It can be used more effectively at support and resistance levels and at the end of price retracements.
Buy Signal Conditions
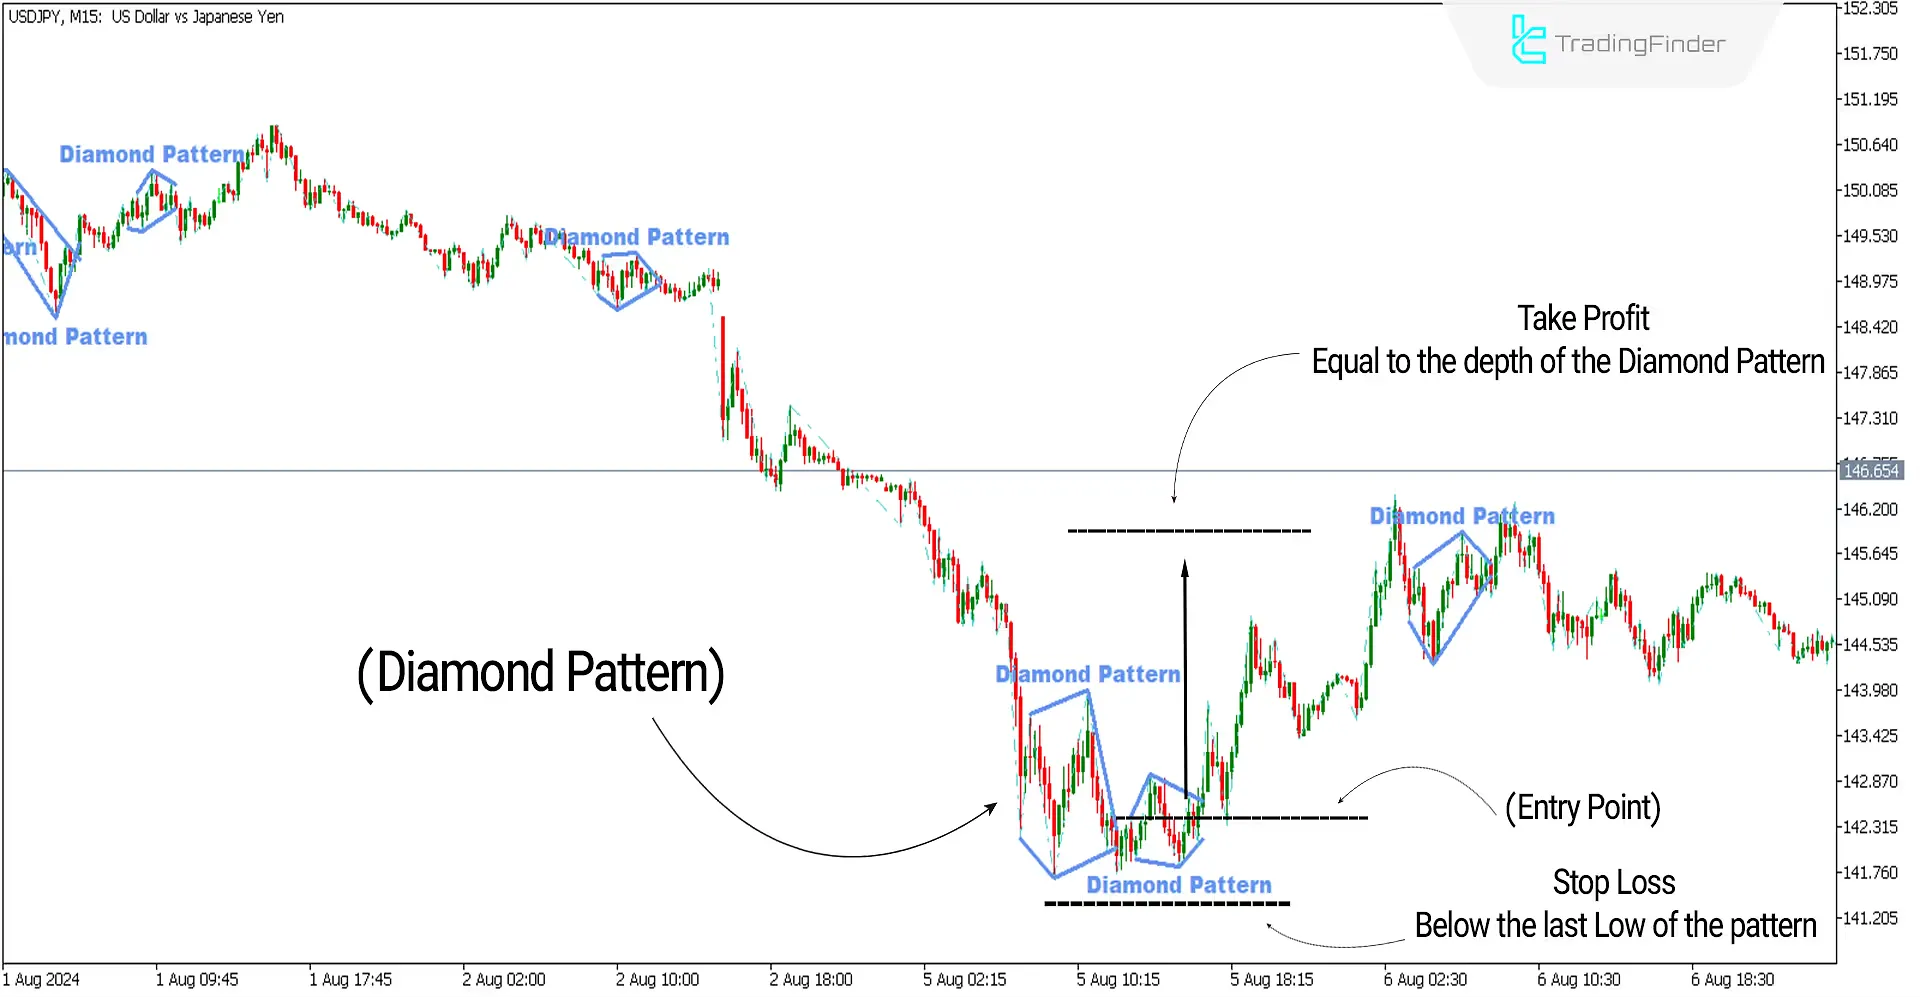
The chart below shows the USD to JPY (USDJPY) currency pair in a 15-minute timeframe. At the end of a downtrend, the indicator identified a Bullish Diamond Pattern, providing a suitable opportunity for Buy Positions. A buy signal is issued upon breaking the upper line of the pattern.
Take Profit and Stop Loss for the Cup and Handle Pattern
In trading the bullish diamond pattern, the stop loss can be set below the last low of the pattern, and the take profit can be set equal to the depth of the diamond (the distance between the lowest and highest price within the diamond).

Sell Signal Conditions
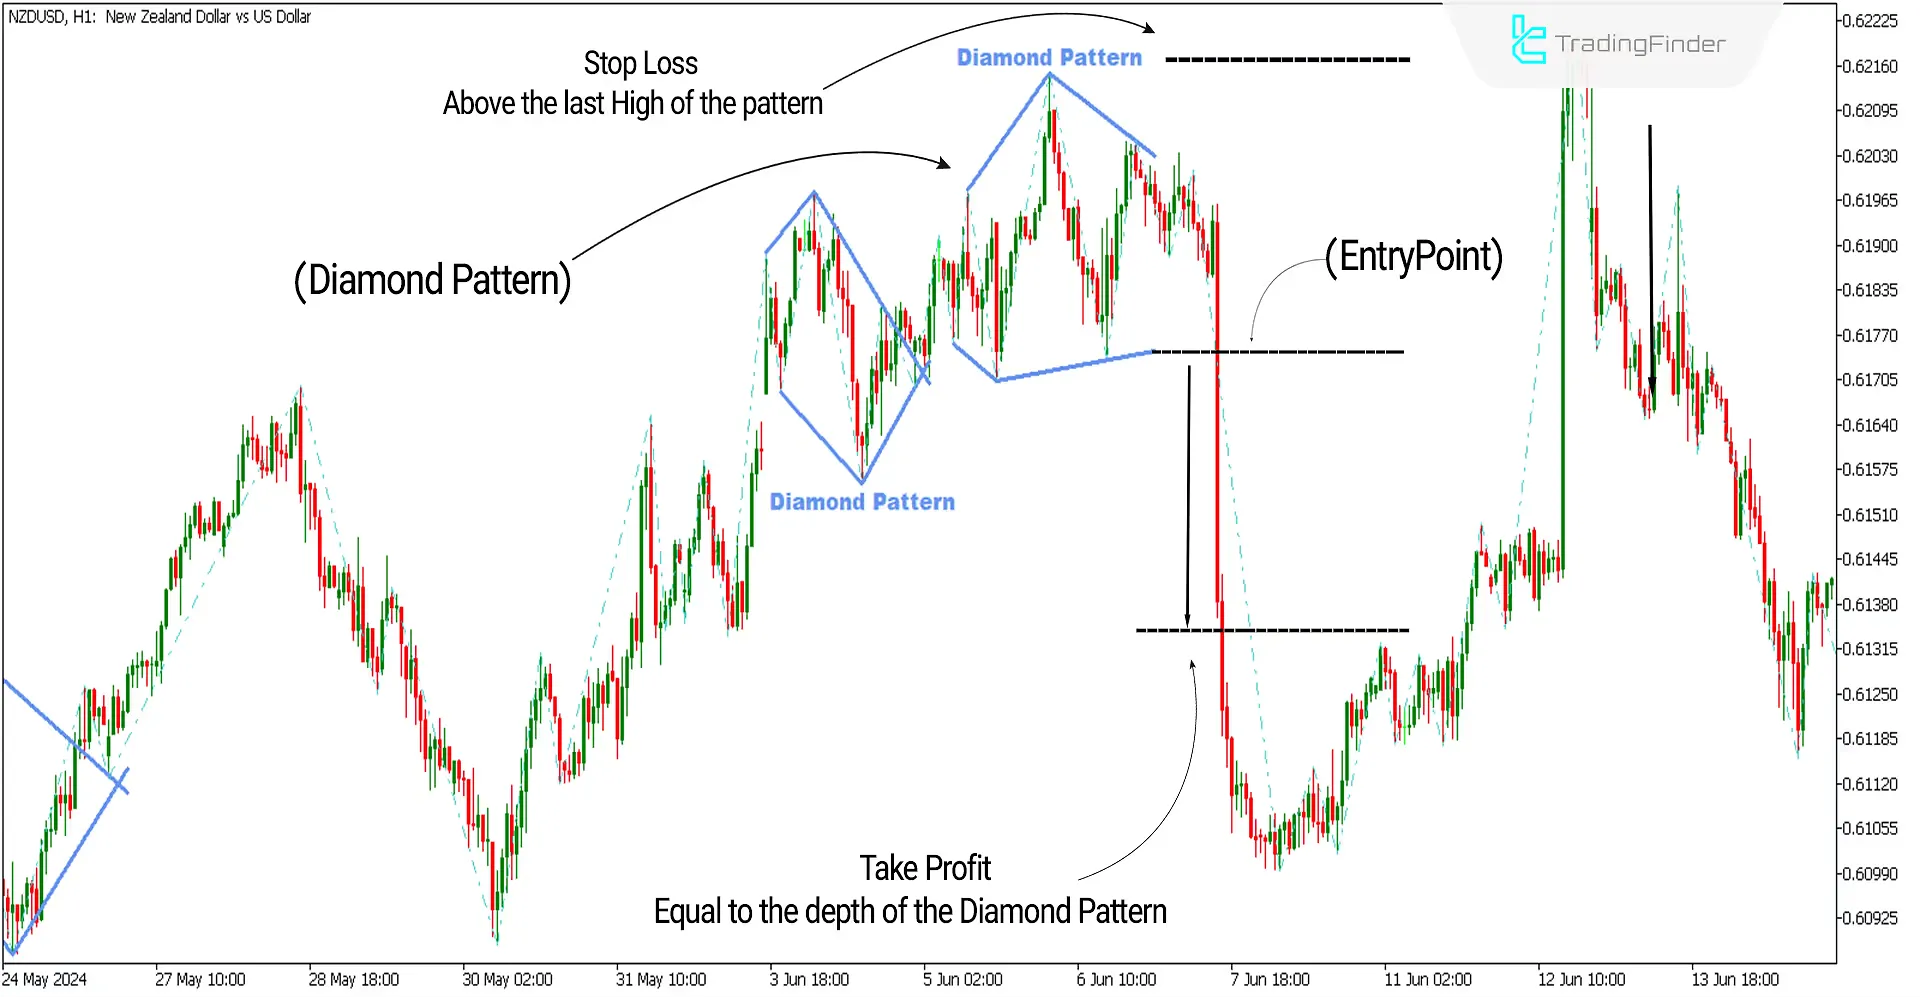
The chart below shows the NZD to USD (NZDUSD) currency pair in a 1-hour timeframe. At the end of an uptrend, the indicator identified a Bearish Diamond Pattern, providing a suitable opportunity for Sell Positions. A sell signal is issued upon breaking the lower line of the pattern.
Take Profit and Stop Loss for the Reversal Cup and Handle Pattern
In trading the bearish diamond pattern, the stop loss can be set above the last high of the pattern, and the take profit can be set equal to the depth of the diamond (the distance between the lowest and highest price within the diamond).

Diamond Pattern Indicator Settings

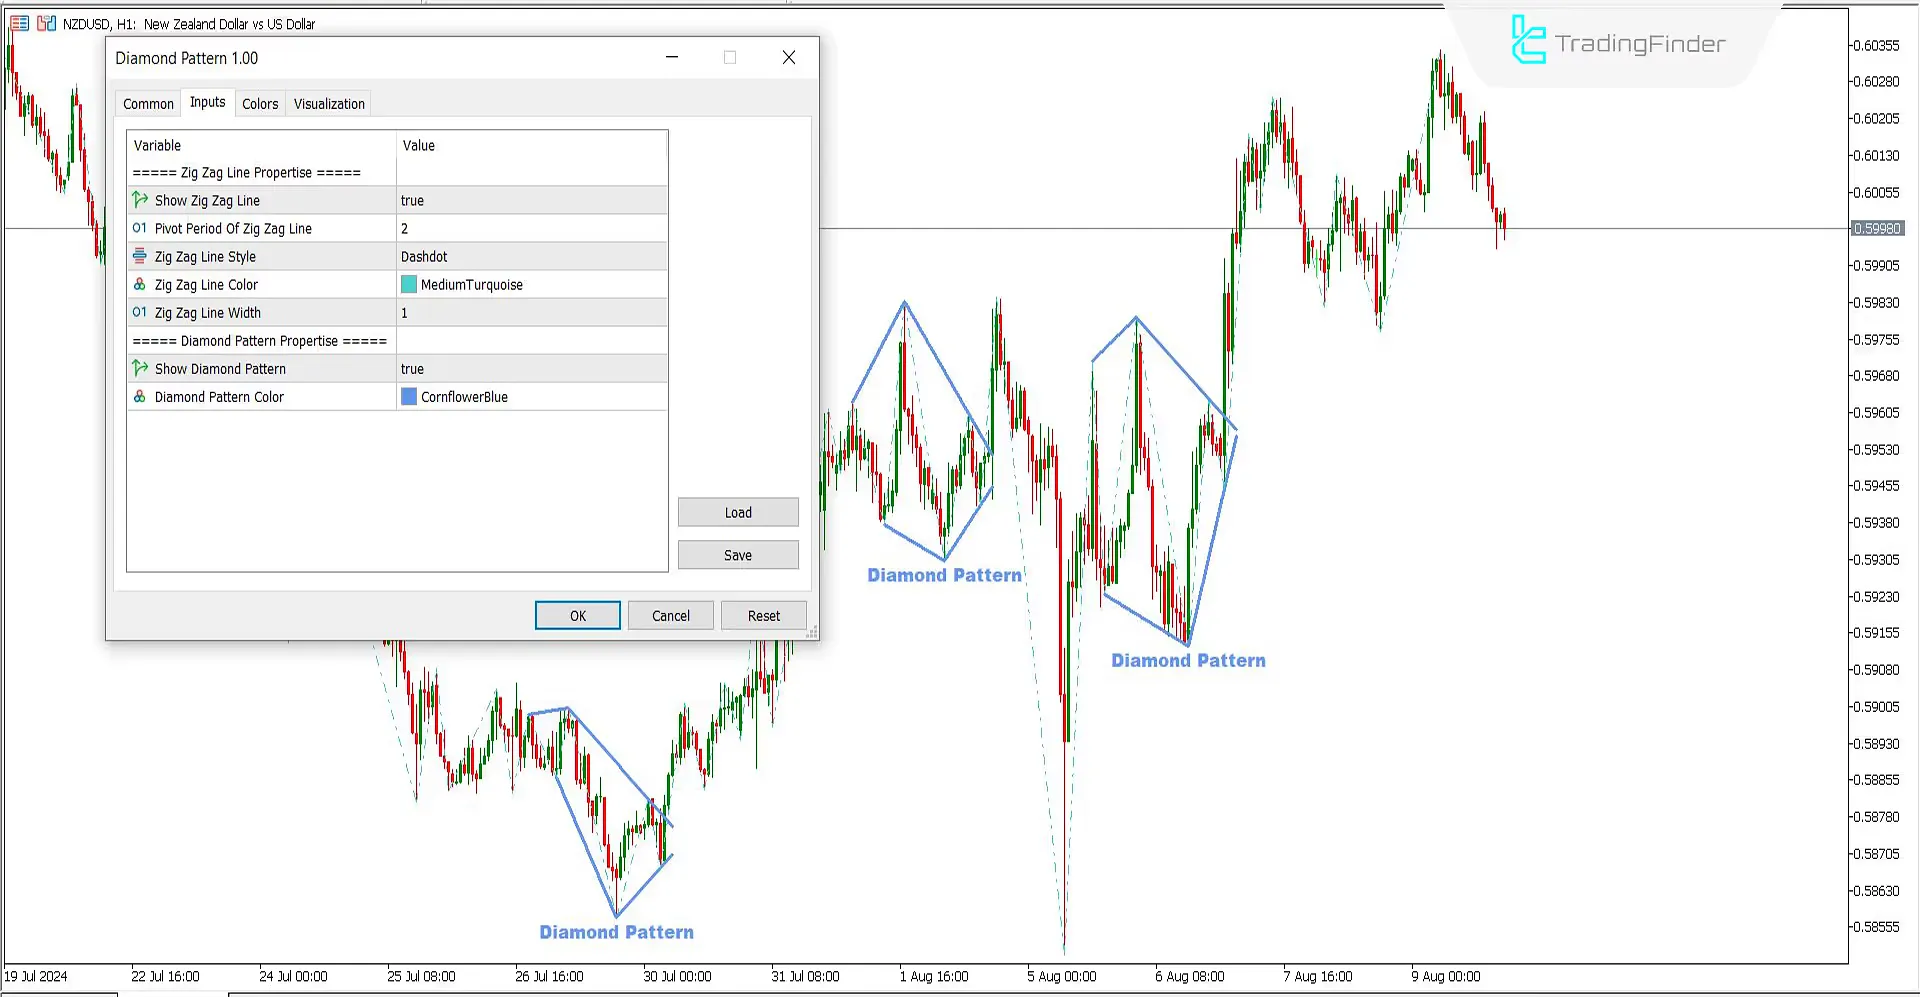
- Zig Zag Line Properties:
- Show Zig Zag Line: Set to true to display the Zig Zag line.
- Pivot Period of Zig Zag Line: The Zig Zag line period is set to 2.
- Zig Zag Line Style: Displayed as a Dashdot line.
- Zig Zag Line Color: Blue, customizable.
- Zig Zag Line Width: Set to 1.
- Diamond Pattern Properties:
- Show Diamond Pattern: Set to true to display the pattern.
- Diamond Pattern Color: Dark Blue.
Summary
The Diamond Pattern Metatrader5 Chart and Classic Indicator can be used alongside classic and modern support and resistance levels.
Additionally, to identify valid patterns, you can use higher timeframes (High Timeframe) to recognize the trend and trade in that direction.
Diamond Pattern MT5 PDF
Diamond Pattern MT5 PDF
Click to download Diamond Pattern MT5 PDFHow does the Diamond Pattern Indicator work?
This indicator identifies diamond chart patterns without the need for chart analysis and marks them in blue.
How to enter a trade in the Diamond Pattern?
Entering a trade should be done when the pattern line (upper-lower) is broken, with an increase in volume at the time of the breakout.


