![Double Fibonacci Indicator for MetaTrader 5 Download – [TradingFinder]](https://cdn.tradingfinder.com/image/302111/2-42-en-double-fib-mt5-1.webp)
![Double Fibonacci Indicator for MetaTrader 5 Download – [TradingFinder] 0](https://cdn.tradingfinder.com/image/302111/2-42-en-double-fib-mt5-1.webp)
![Double Fibonacci Indicator for MetaTrader 5 Download – [TradingFinder] 1](https://cdn.tradingfinder.com/image/302108/2-42-en-double-fib-mt5-2.webp)
![Double Fibonacci Indicator for MetaTrader 5 Download – [TradingFinder] 2](https://cdn.tradingfinder.com/image/302107/2-42-en-double-fib-mt5-3.webp)
![Double Fibonacci Indicator for MetaTrader 5 Download – [TradingFinder] 3](https://cdn.tradingfinder.com/image/302109/2-42-en-double-fib-mt5-4.webp)
The Double Fibonacci Indicator (Double Fib) is a trading tool on the MetaTrader 5 platform that combines two types of Fibonacci levels retracement and extension to identify key support and resistance levels.
These support and resistance Tools, in addition to displaying Fibonacci levels [yellow and blue levels] and fractal points [black solid and dashed lines], also identify market reversal zones.
Double Fibonacci Specifications Table
The table below displays the general specifications of the Double Fibonacci Indicator on the MetaTrader 5 platform.
Indicator Categories: | Pivot Points & Fractals MT5 Indicators Support & Resistance MT5 Indicators Levels MT5 Indicators |
Platforms: | MetaTrader 5 Indicators |
Trading Skills: | Intermediate |
Indicator Types: | Reversal MT5 Indicators |
Timeframe: | Multi-Timeframe MT5 Indicators |
Trading Style: | Intraday MT5 Indicators |
Trading Instruments: | Forex MT5 Indicators Crypto MT5 Indicators Stock MT5 Indicators Forward MT5 Indicators |
Indicator Overview
In the Double Fibonacci Indicator, when fractal levels overlap with Fibonacci levels, these areas are considered significant entry points into the market.
This MetaTrader 5 indicator aims to identify reversal zones where Fibonacci retracement and extension levels intersect with fractal levels to create optimal trade entry zones.
Uptrend Conditions
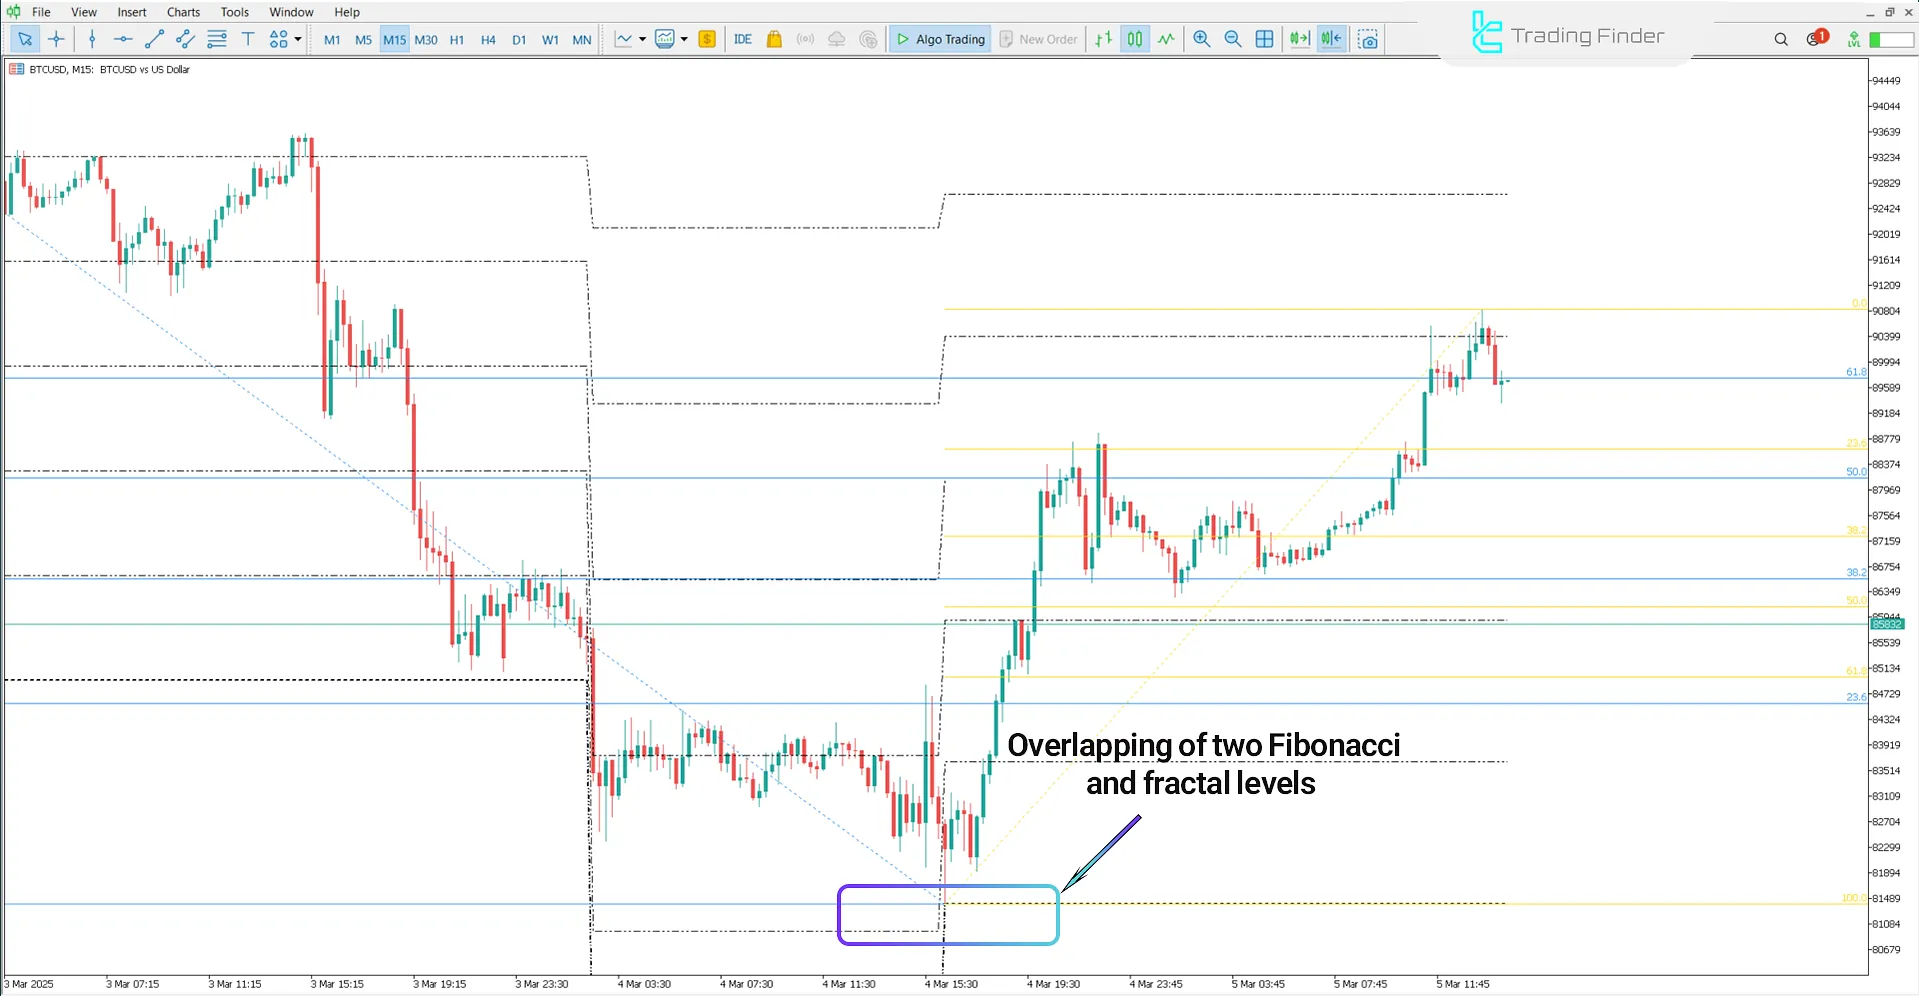
Image below shows the Bitcoin index with the symbol (ETH/USD) in a 15-minute timeframe. In this chart, the Double Fibonacci Indicator (Double Fib) simultaneously plots Fibonacci retracement and extension levels.
These levels overlap with fractal price points in a region, creating an optimal entry zone for buy trades. This overlap indicates a strong support level, increasing the likelihood of a price reversal.

Downtrend Conditions
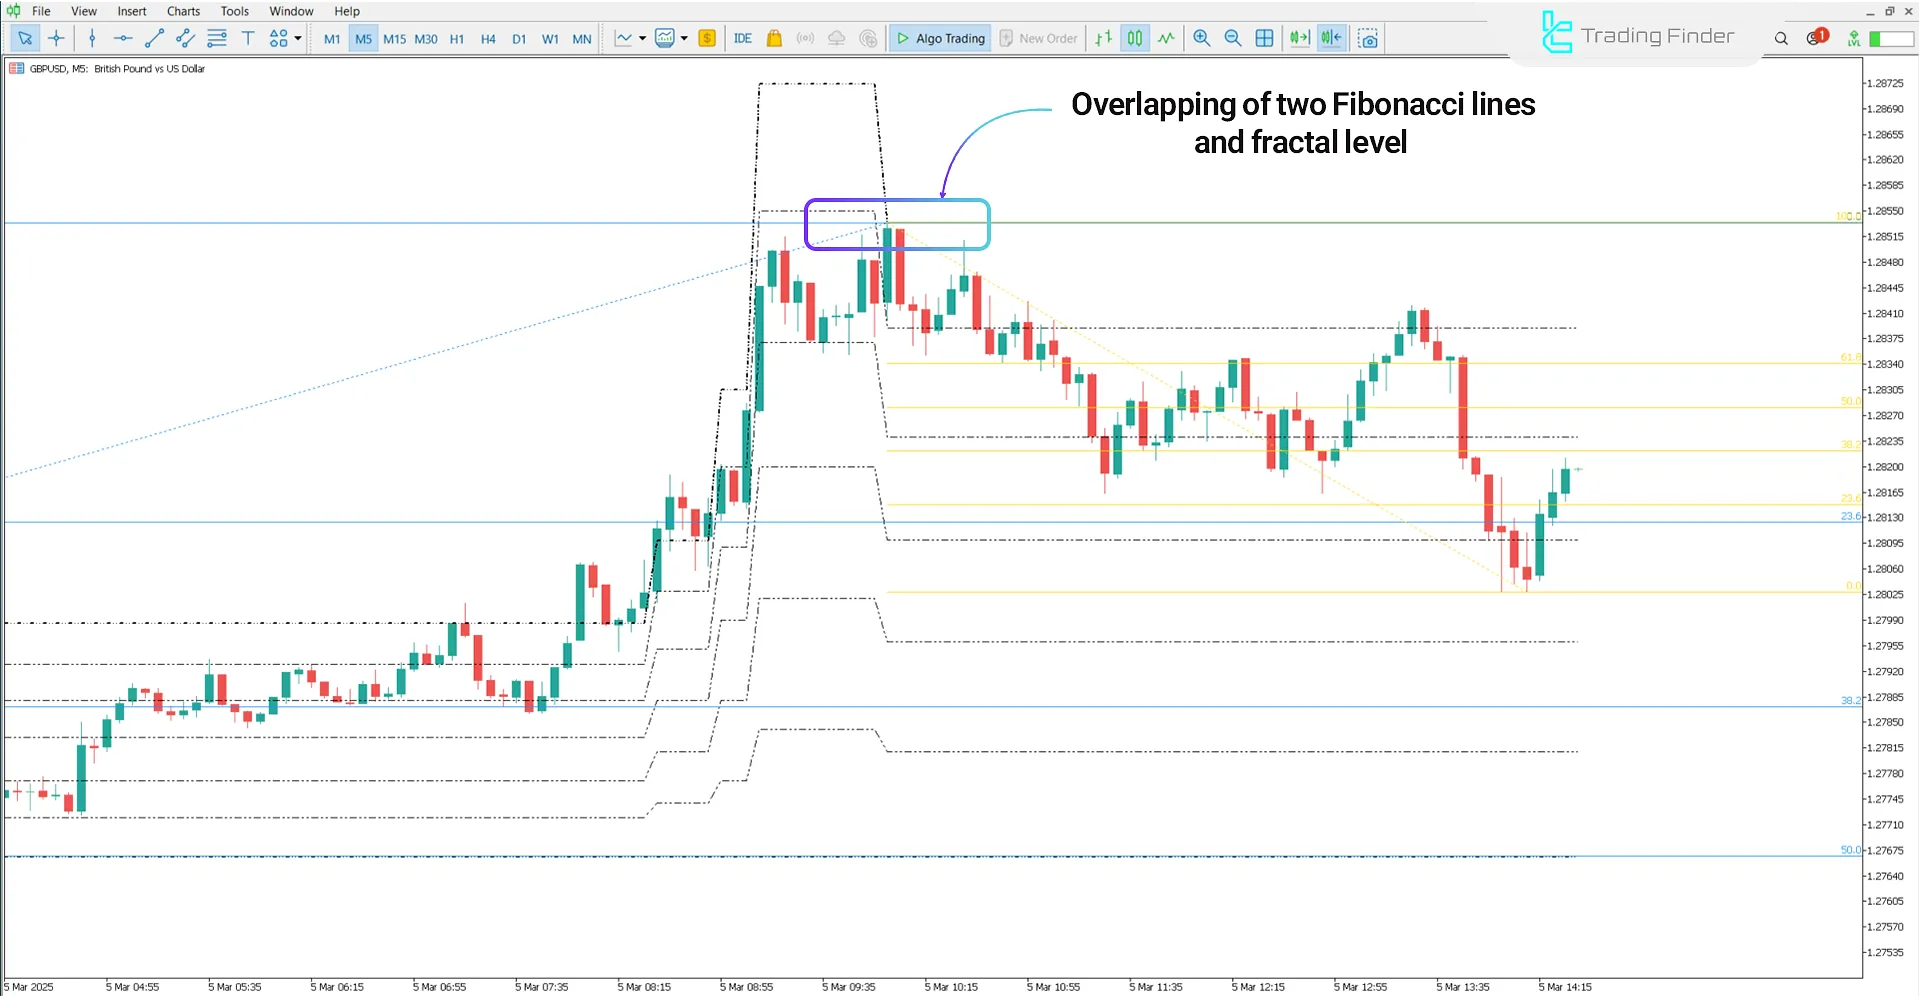
The price chart below displays the British Pound against the US Dollar with the symbol (GBP/USD) in a 5-minute timeframe.
The overlap of Fibonacci retracement and extension levels with fractal points can indicate a reversal zone. This overlap near a key resistance level provides an opportunity to enter sell trades.

Indicator Settings
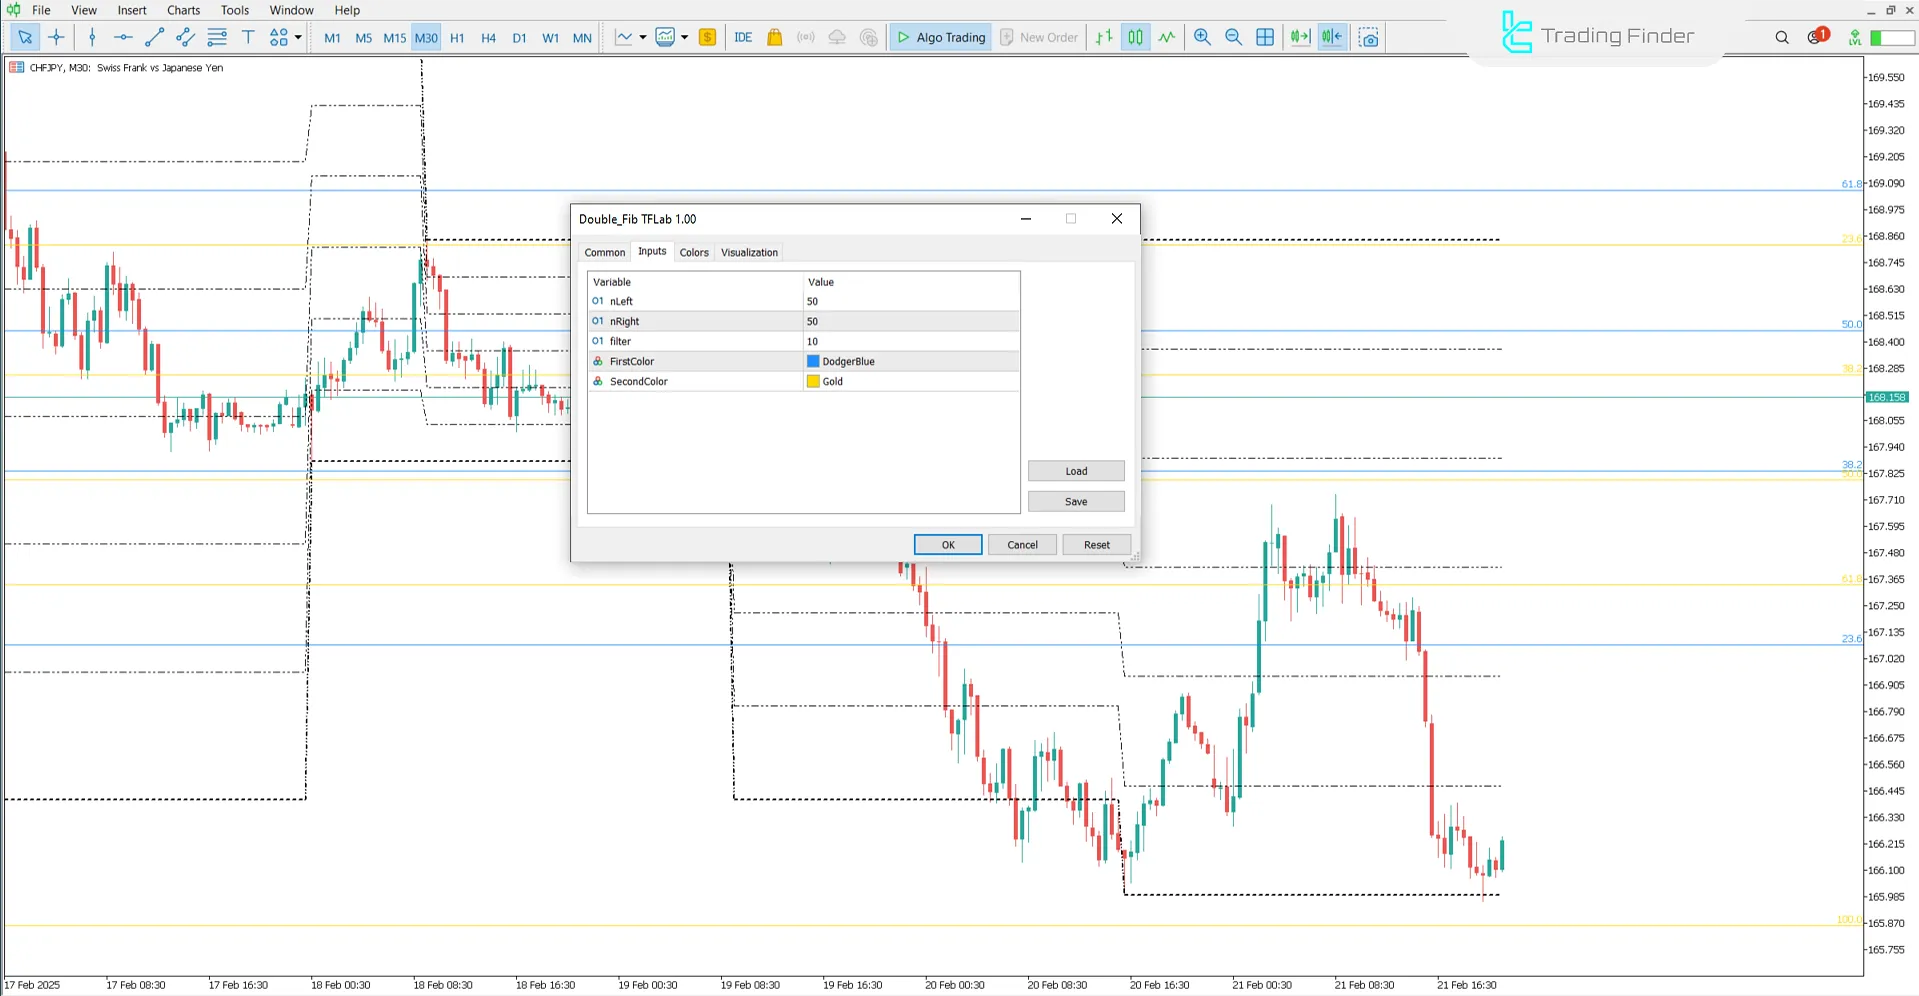
The settings of the Double Fibonacci Indicator can be seen in the image below:

- NLeft: Left pivot
- NRight: Right pivot
- Filter: Signal refinement
- First Color: Primary trend color
- Second Color: Secondary trend color
Conclusion
The Double Fibonacci Indicator is applicable for trading in various financial markets and across all timeframes.
This MT5 indicator automatically plots Fibonacci support and resistance levels and identifies optimal trade entry zones by combining Fibonacci retracement and extension levels with fractal reversal points.
Double Fibonacci MT5 PDF
Double Fibonacci MT5 PDF
Click to download Double Fibonacci MT5 PDFWhat components make up the Double Fibonacci Indicator?
This indicator combines three trading tools: Fibonacci retracement, Fibonacci extension, and fractal levels.
Is this indicator only usable in the Forex market?
No, it is suitable and usable for all trading markets.


