![Envelopes Indicator for MetaTrader 5 Download – Free - [TradingFinder]](https://cdn.tradingfinder.com/image/195584/1-8-en-envelopes-indicator-mt5-1.webp)
![Envelopes Indicator for MetaTrader 5 Download – Free - [TradingFinder] 0](https://cdn.tradingfinder.com/image/195584/1-8-en-envelopes-indicator-mt5-1.webp)
![Envelopes Indicator for MetaTrader 5 Download – Free - [TradingFinder] 1](https://cdn.tradingfinder.com/image/195585/1-8-en-envelopes-indicator-mt5-2.webp)
![Envelopes Indicator for MetaTrader 5 Download – Free - [TradingFinder] 2](https://cdn.tradingfinder.com/image/195589/1-8-en-envelopes-indicator-mt5-3.webp)
![Envelopes Indicator for MetaTrader 5 Download – Free - [TradingFinder] 3](https://cdn.tradingfinder.com/image/195588/1-8-en-envelopes-indicator-mt5-4.webp)
The Envelopes Indicator is a technical analysis tool used to identify support, resistance zones, and trend changes in financial markets.
This Volatility MT5 indicator consists oftwo lines that are a fixed percentage away from the moving average. The blue and red lines are used to identify overbought and oversold levels.
Envelopes Indicator Specifications Table
Table below contains information about the Envelopes Indicator in MetaTrader 5:
Indicator Categories: | Volatility MT5 Indicators Bands & Channels MT5 Indicators Levels MT5 Indicators |
Platforms: | MetaTrader 5 Indicators |
Trading Skills: | Intermediate |
Indicator Types: | Range MT5 Indicators Breakout MT5 Indicators |
Timeframe: | Multi-Timeframe MT5 Indicators |
Trading Style: | Intraday MT5 Indicators |
Trading Instruments: | Forex MT5 Indicators Crypto MT5 Indicators Stock MT5 Indicators Commodity MT5 Indicators Indices MT5 Indicators Share Stock MT5 Indicators |
Indicator Overview
In the Envelopes Indicator, when the price crosses the blue or red lines, the probability of a trend reversal increases if the price breaks these lines and then returns to them. In these situations, traders can go Buy when the price touches the blue line and Sell when it touches the red line.
Uptrend Conditions
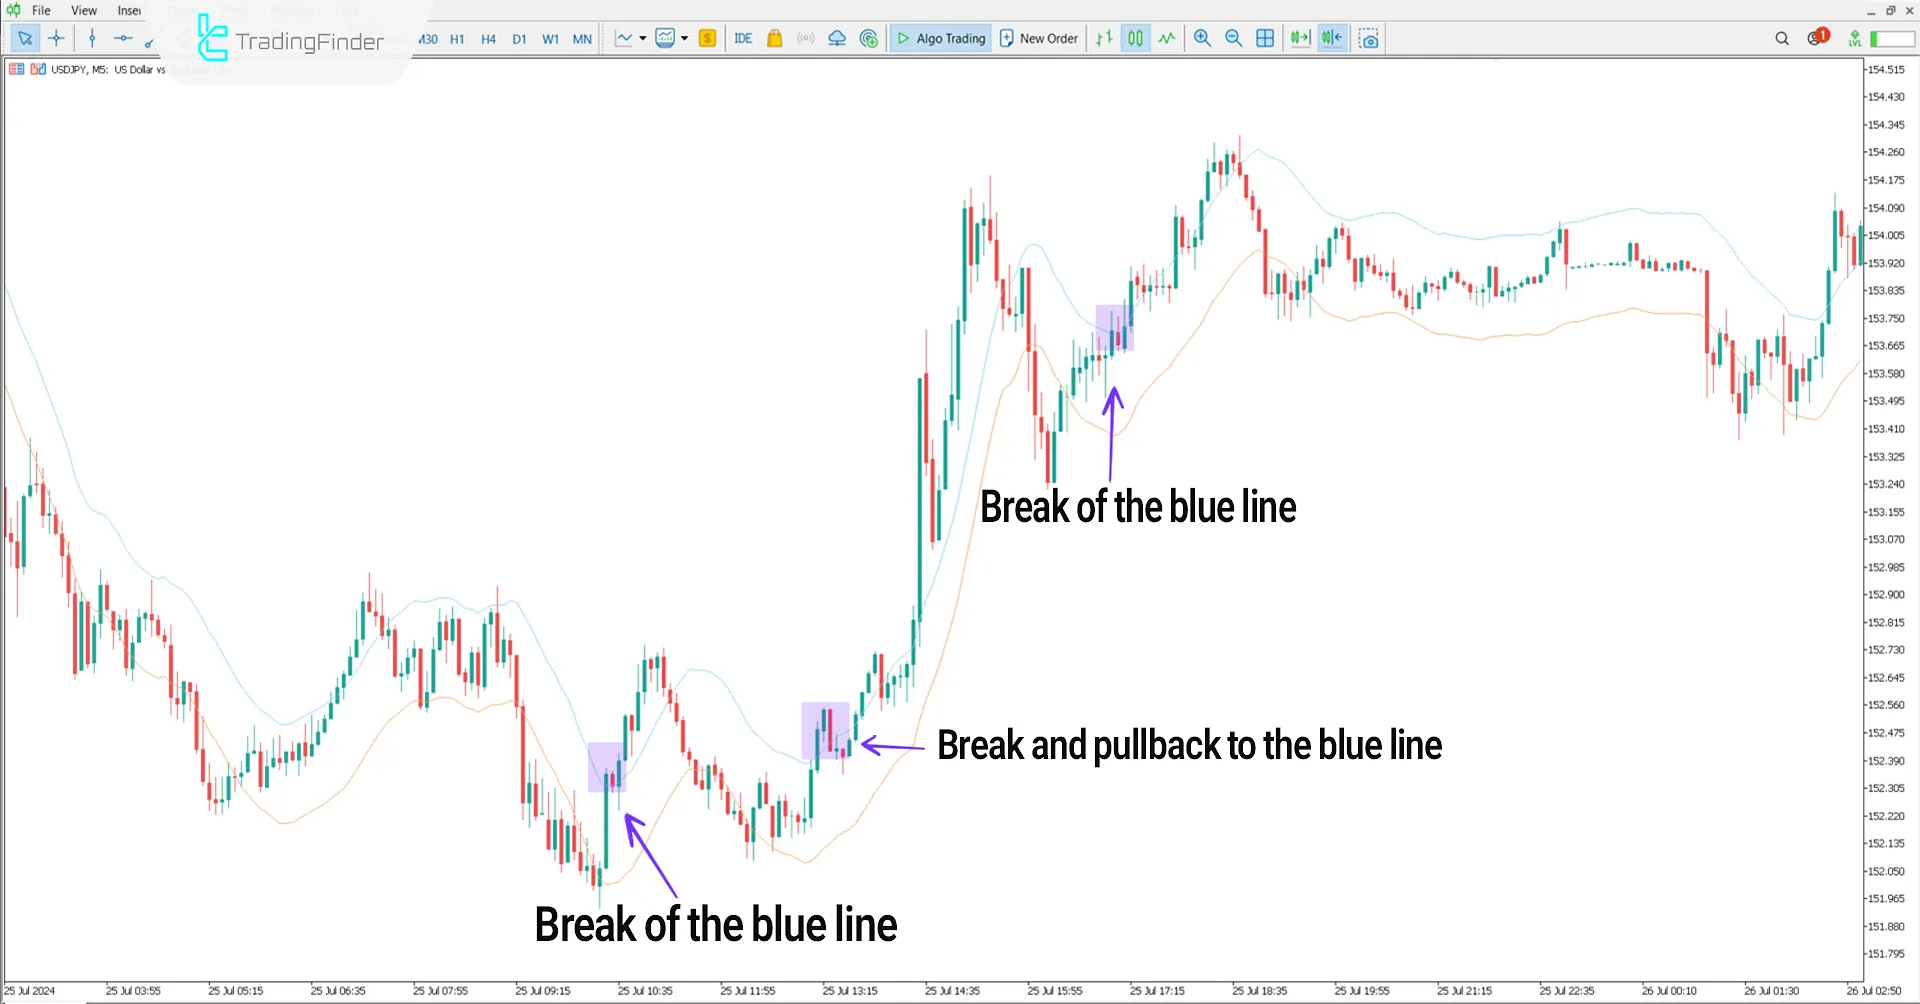
The image below shows the price chart of the USD/JPY pair on the 5 minute timeframe.
Breakingthe blue line indicates a potential trend reversal from bearish to bullish.In such situations, theEnvelopes Indicator issues a Buy signal.

Bearish Trend Conditions
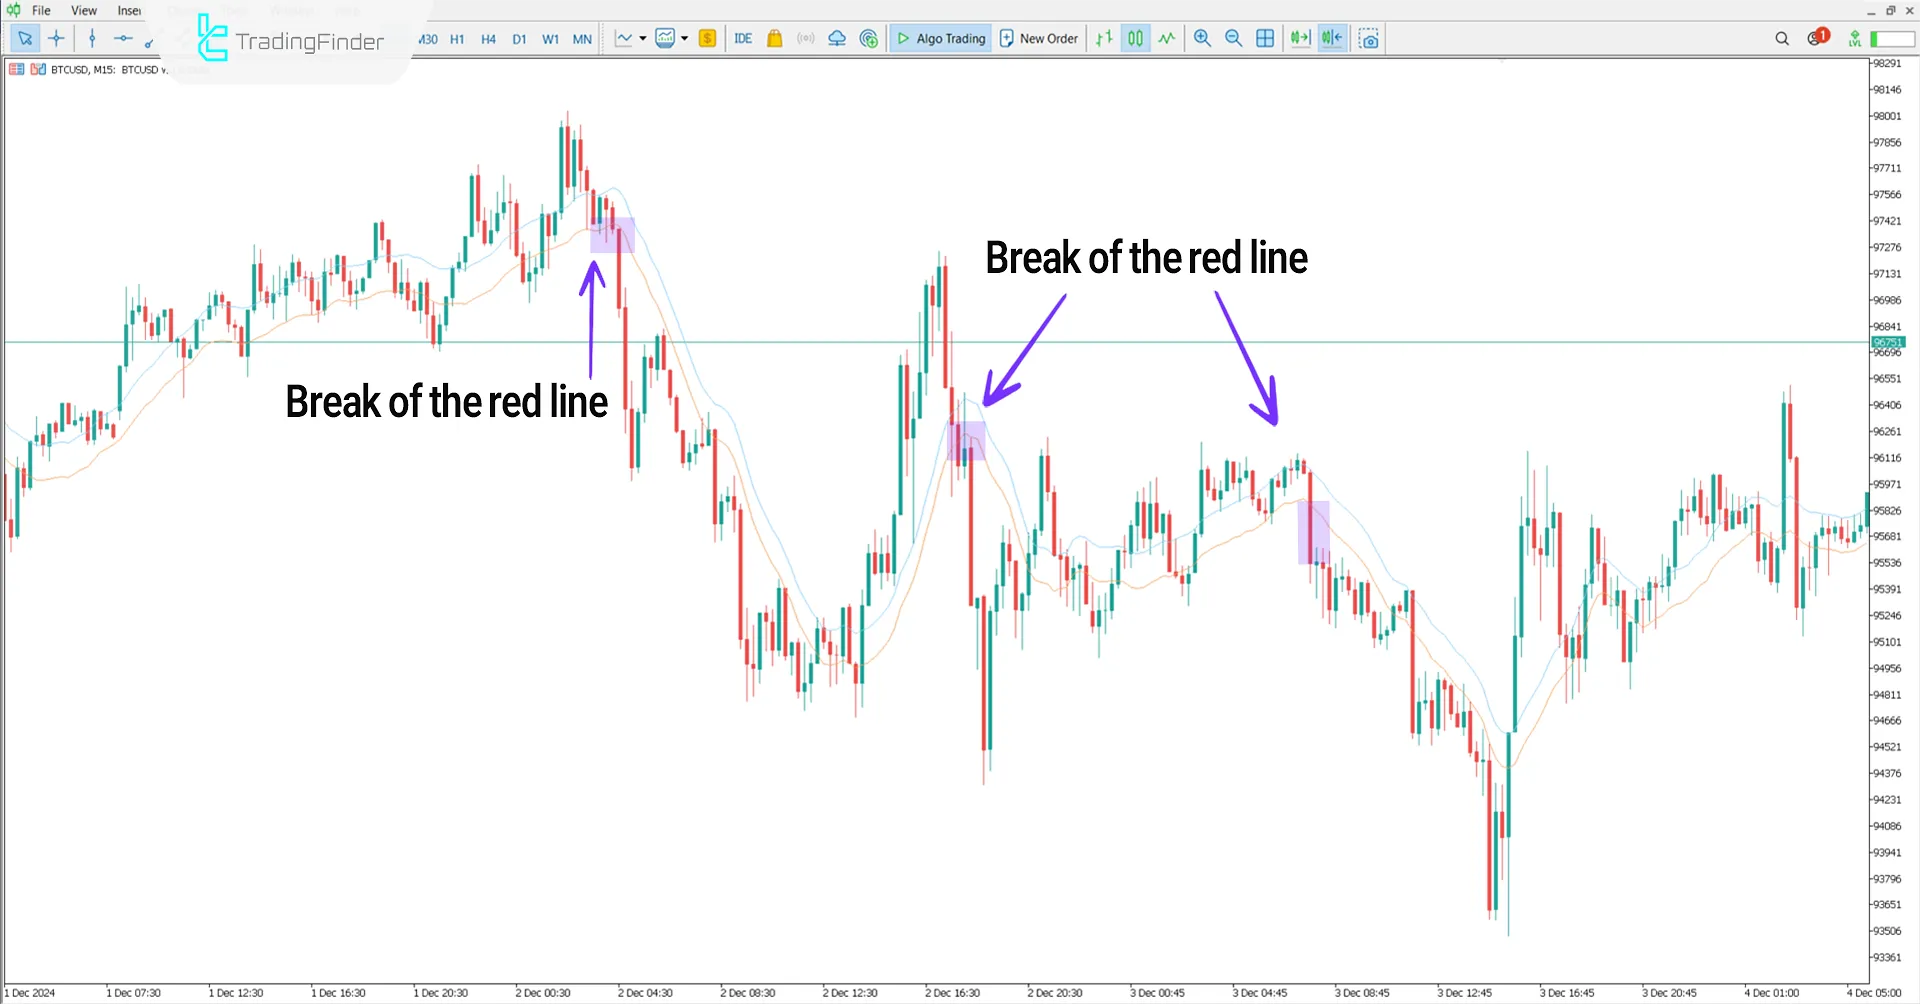
The image below shows the price chart of Bitcoin (BTC/USD) on the 15-minute timeframe.
In theEnvelopes Indicator, when the orange line breaks downward, there is a likelihood of a trend reversal from bullish to bearish, and a Sell signal is issued.

Indicator Settings
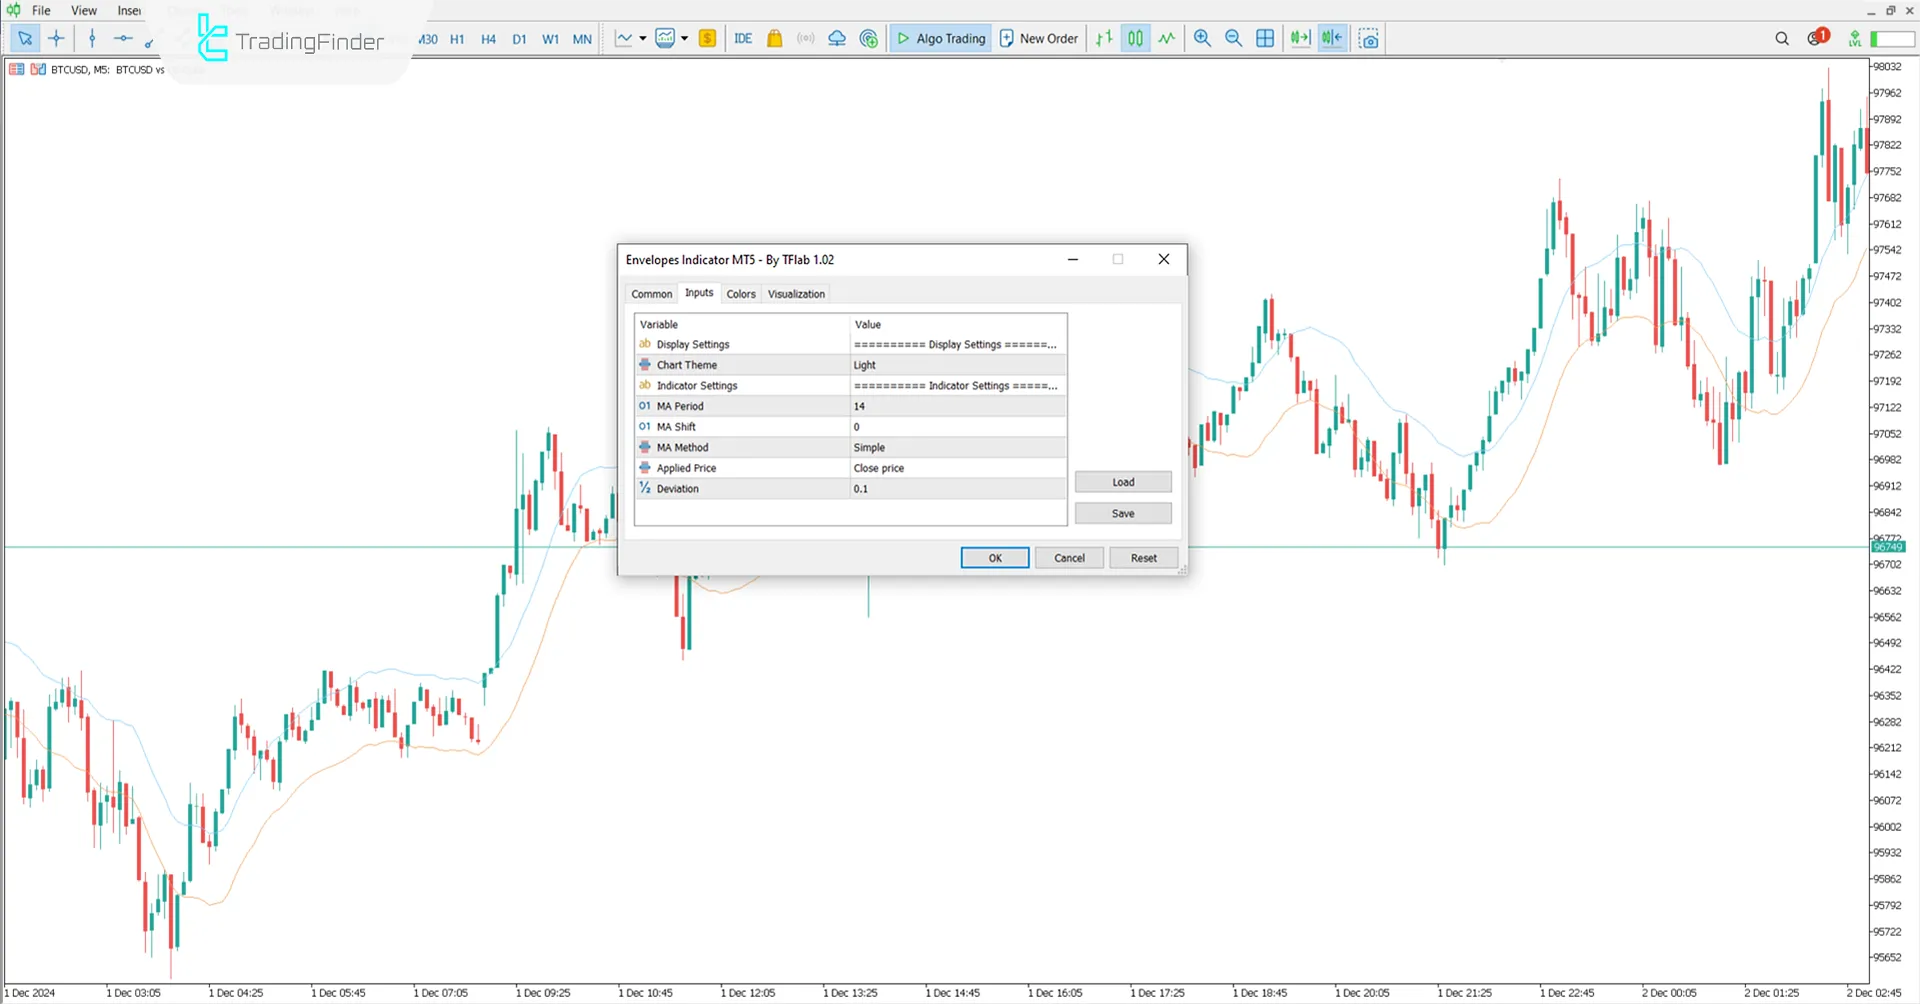
Image pertains to the settings of the Envelopes indicator:

- Chart theme: Chart theme;
- MA period: Moving Average (MA) period to 14;
- MA shift: Moving Average (MA) shift to 0;
- MA method: Moving Average (MA) method;
- Applied price: Applied price;
- Deviation: Deviation.
Conclusion
The Envelopes Indicator is a tool used to identify breakout zones, trend changes, and reversals in MetaTrader 5 indicator.
It can be used for trading at the peaks and troughs ofranging markets to find suitable Entry points.
Envelopes MT5 PDF
Envelopes MT5 PDF
Click to download Envelopes MT5 PDFWhat areas of the market does this tool apply to?
This indicator can identify support and resistance zones and show traders points of trend change and reversal.
Does this indicator identify overbought and oversold levels?
Yes, this tool uses two blue and red lines to provide traders with the ability to identify overbought and oversold levels.


