![First RSI Level Indicator for MetaTrader 5 Download - Free - [TFlab]](https://cdn.tradingfinder.com/image/287905/11-68-en-first-rsi-level-mt5-01.webp)
![First RSI Level Indicator for MetaTrader 5 Download - Free - [TFlab] 0](https://cdn.tradingfinder.com/image/287905/11-68-en-first-rsi-level-mt5-01.webp)
![First RSI Level Indicator for MetaTrader 5 Download - Free - [TFlab] 1](https://cdn.tradingfinder.com/image/287904/11-68-en-first-rsi-level-mt5-02.webp)
![First RSI Level Indicator for MetaTrader 5 Download - Free - [TFlab] 2](https://cdn.tradingfinder.com/image/287907/11-68-en-first-rsi-level-mt5-03.webp)
![First RSI Level Indicator for MetaTrader 5 Download - Free - [TFlab] 3](https://cdn.tradingfinder.com/image/287906/11-68-en-first-rsi-level-mt5-04.webp)
The First RSI Level Indicator is one of the signal and forecasting indicators for MetaTrader 5. It is an advanced and enhanced version of the RSI indicator, displaying buy signals in blue and sell signals in red.
Additionally, it draws support and resistance levels, highlighting key areas for traders.
First RSI Level Indicator Table
The table below outlines the general specifications of the First RSI Level Indicator.
Indicator Categories: | Support & Resistance MT5 Indicators Signal & Forecast MT5 Indicators Currency Strength MT5 Indicators Trading Assist MT5 Indicators RSI Indicators for MetaTrader 5 |
Platforms: | MetaTrader 5 Indicators |
Trading Skills: | Intermediate |
Indicator Types: | Lagging MT5 Indicators Reversal MT5 Indicators |
Timeframe: | Multi-Timeframe MT5 Indicators |
Trading Style: | Intraday MT5 Indicators Scalper MT5 Indicators Day Trading MT5 Indicators |
Trading Instruments: | Forex MT5 Indicators Stock MT5 Indicators Indices MT5 Indicators |
Bullish Trend Signal
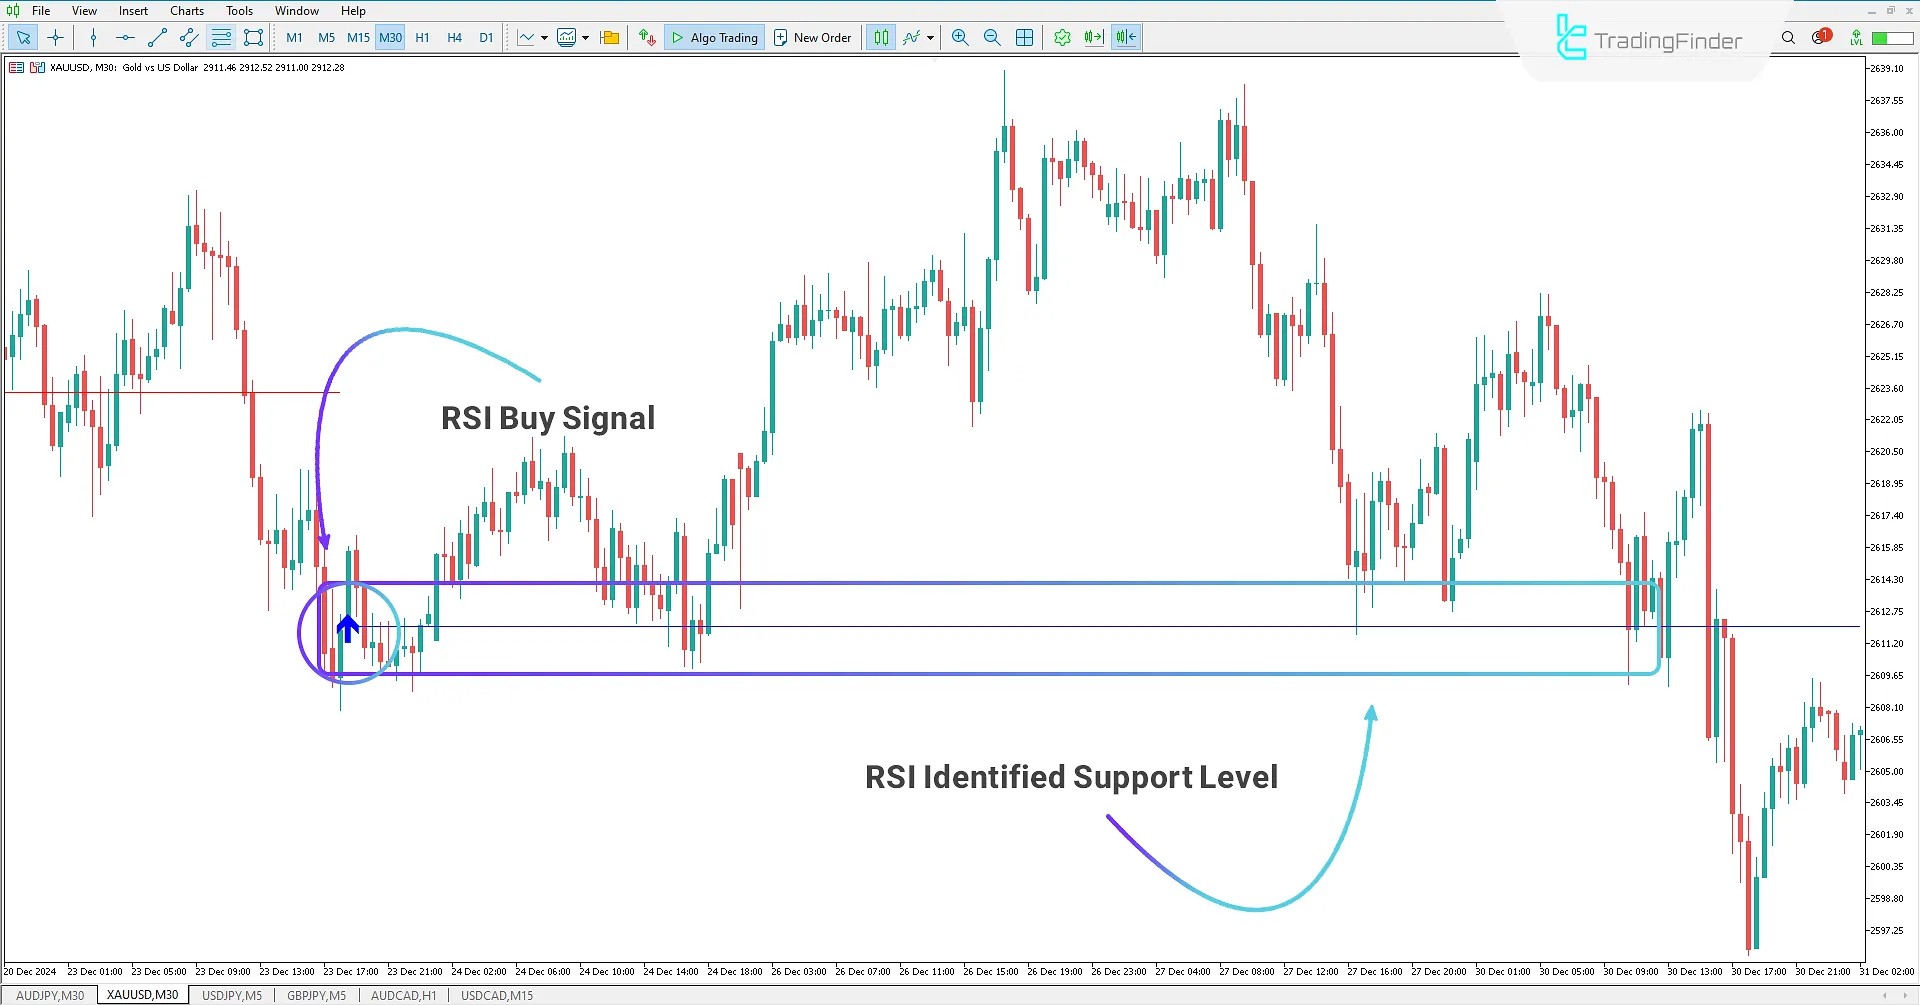
In the 30-minute Gold chart, the First RSI Level Indicator has identified a trading opportunity and displayed a buy signal on the chart.
Traders who are informed about the trading opportunity with a delay can enter a buy position during the price pullback to the drawn support level using the indicator.

Bearish Trend Signal
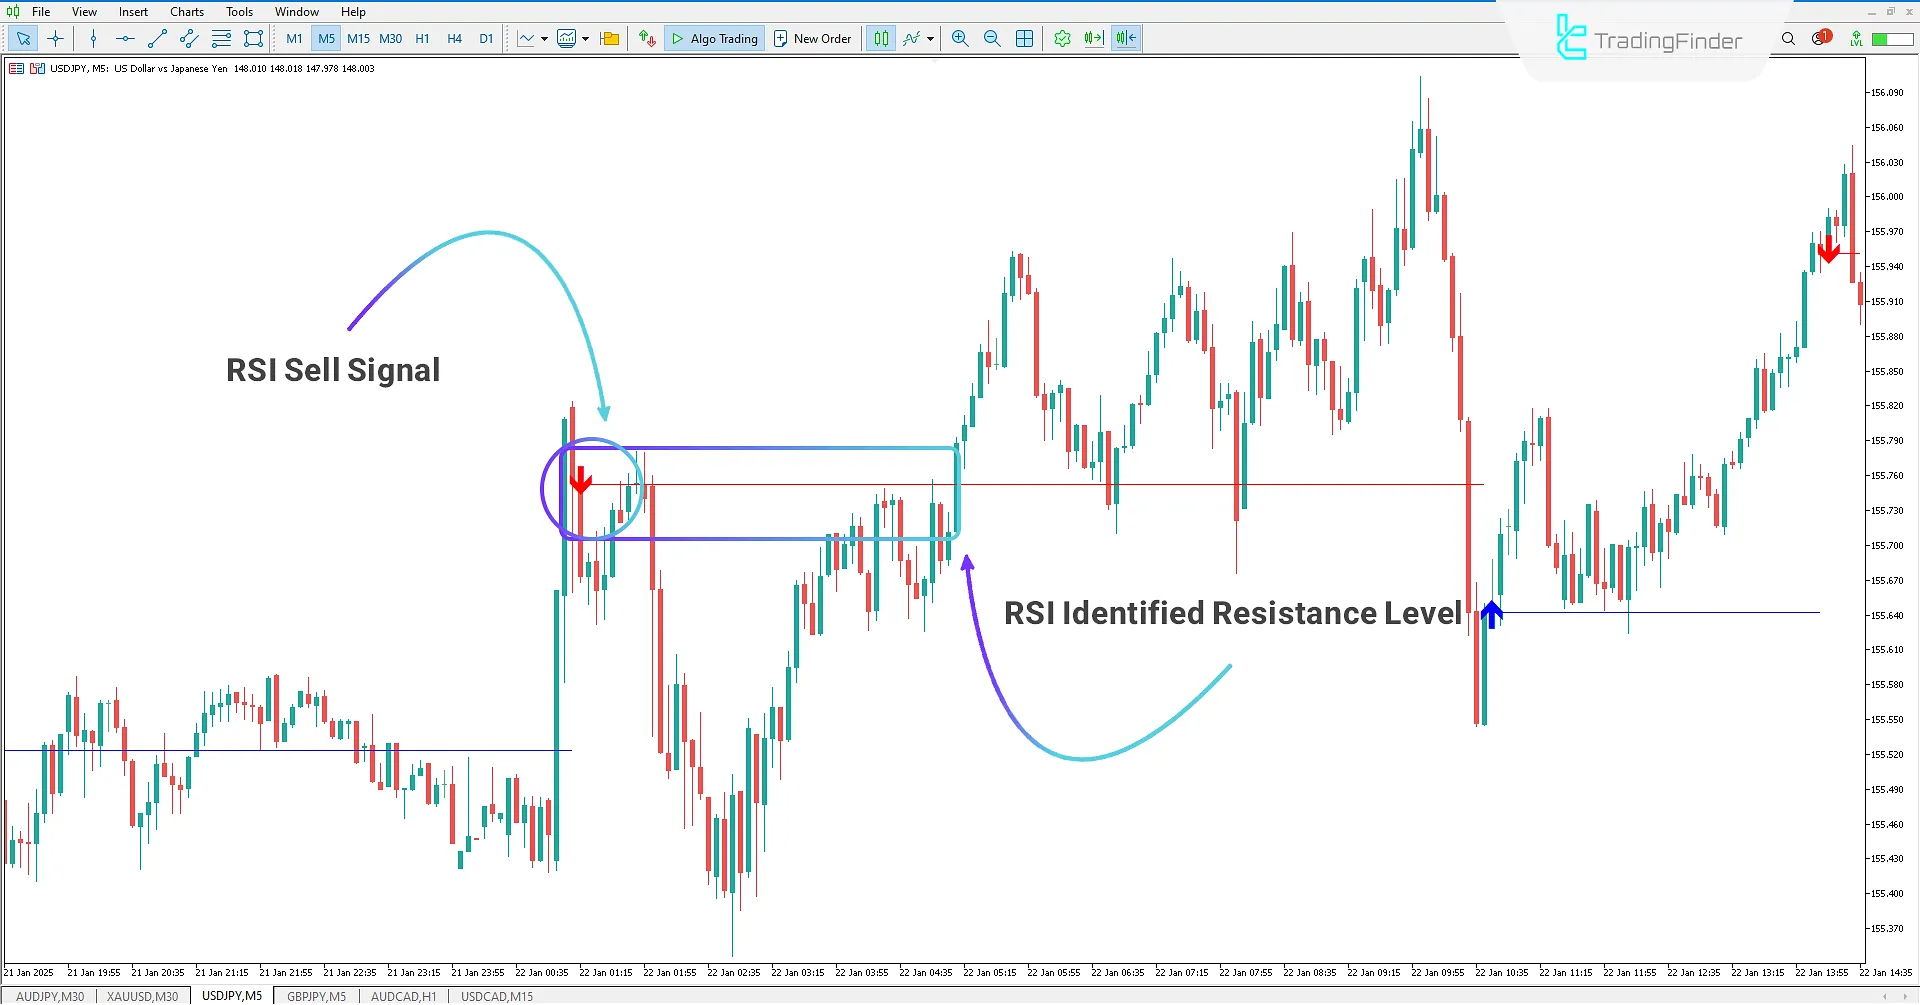
In the 5-minute USD/JPY chart, the First RSI Level Indicator has issued a bearish trend signal and displayed a sell trading opportunity. Upon generating the signal, the indicator sends an alert to the trader to inform them of the trading opportunity.
Additionally, traders can use the drawn level as a resistance level and re-enter during the price pullback to this level in Trading tools.

First RSI Level Indicator Settings
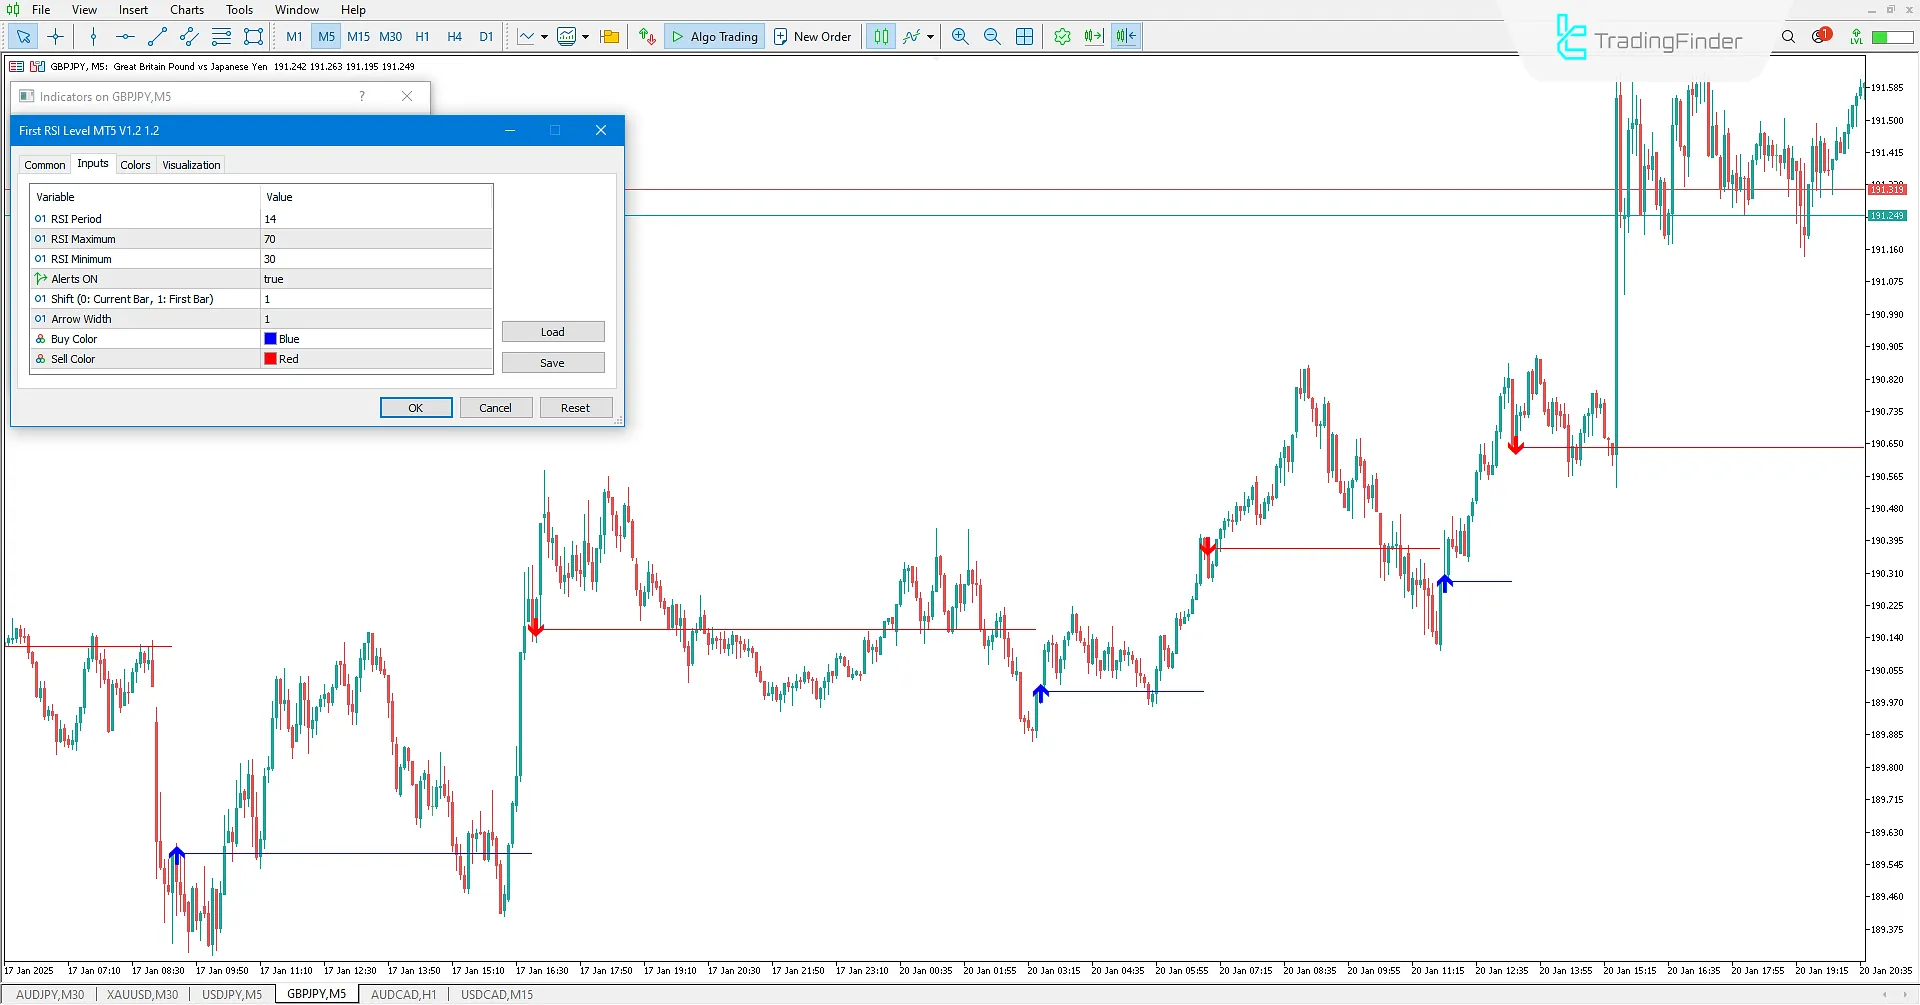
The settings for the First RSI Level Indicator are as follows:

- RSI Period: Set the period for the RSI indicator
- RSI Maximum: Set the overbought level for the RSI
- RSI Minimum: Set the oversold level for the RSI
- Alerts ON: Enable or disable alerts when signals are generated
- Shift (0: Current Bar, 1: First Bar): Set calculation based on the current candle (0) or the closing candle (1)
- Arrow Width: Set the size of the signal arrows (1-5)
- Buy Color: Set the color for buy signals
- Sell Color: Set the color for sell signals
Coclusion
The First RSI Level Indicator is one of the support and resistance indicators in MetaTrader 5. It is useful for traders looking to identify entry points based on the RSI indicator.
By drawing support levels in blue and resistance levels in red, it aids in specialized decision-making.
Traders can use this indicator to identify buy or sell positions and stay informed about trading opportunities through trading signal alerts.
First RSI Level MT5 PDF
First RSI Level MT5 PDF
Click to download First RSI Level MT5 PDFHow does this indicator display support and resistance levels?
The First RSI Level Indicator draws support levels in blue and resistance levels in red, highlighting key areas for traders.
How does this indicator help in identifying entry points?
This indicator helps traders identify entry points based on support and resistance levels as well as buy and sell signals.
Awesome! Nice Indicator.


