![FVG Positioning Average Indicator MT5 Download – Free – [TradingFinder]](https://cdn.tradingfinder.com/image/477032/13-179-en-fvg-positioning-average-mt5-01.webp)
![FVG Positioning Average Indicator MT5 Download – Free – [TradingFinder] 0](https://cdn.tradingfinder.com/image/477032/13-179-en-fvg-positioning-average-mt5-01.webp)
![FVG Positioning Average Indicator MT5 Download – Free – [TradingFinder] 1](https://cdn.tradingfinder.com/image/477030/13-179-en-fvg-positioning-average-mt5-02.webp)
![FVG Positioning Average Indicator MT5 Download – Free – [TradingFinder] 2](https://cdn.tradingfinder.com/image/477029/13-179-en-fvg-positioning-average-mt5-03.webp)
![FVG Positioning Average Indicator MT5 Download – Free – [TradingFinder] 3](https://cdn.tradingfinder.com/image/477031/13-179-en-fvg-positioning-average-mt5-04.webp)
The Fair Value Gap (FVG) Average Positioning Indicator is developed based on Smart Money Strategy concepts, focusing on averaging FVGs to dynamically highlight key reaction levels on the chart.
These variable zones act as potential supply and demand areas in bullish and bearish trends, providing a strong foundation for identifying optimal risk-reward trade opportunities.
Specification Table for FVG Average Positioning Indicator
The specifications of the Fair Value Gap Positioning Average Indicator are as follows.
Indicator Categories: | Smart Money MT5 Indicators Levels MT5 Indicators ICT MT5 Indicators |
Platforms: | MetaTrader 5 Indicators |
Trading Skills: | Intermediate |
Indicator Types: | Reversal MT5 Indicators |
Timeframe: | Multi-Timeframe MT5 Indicators |
Trading Style: | Swing Trading MT5 Indicators Scalper MT5 Indicators Day Trading MT5 Indicators |
Trading Instruments: | Forex MT5 Indicators Crypto MT5 Indicators Stock MT5 Indicators |
FVG Average Positioning Indicator at a Glance
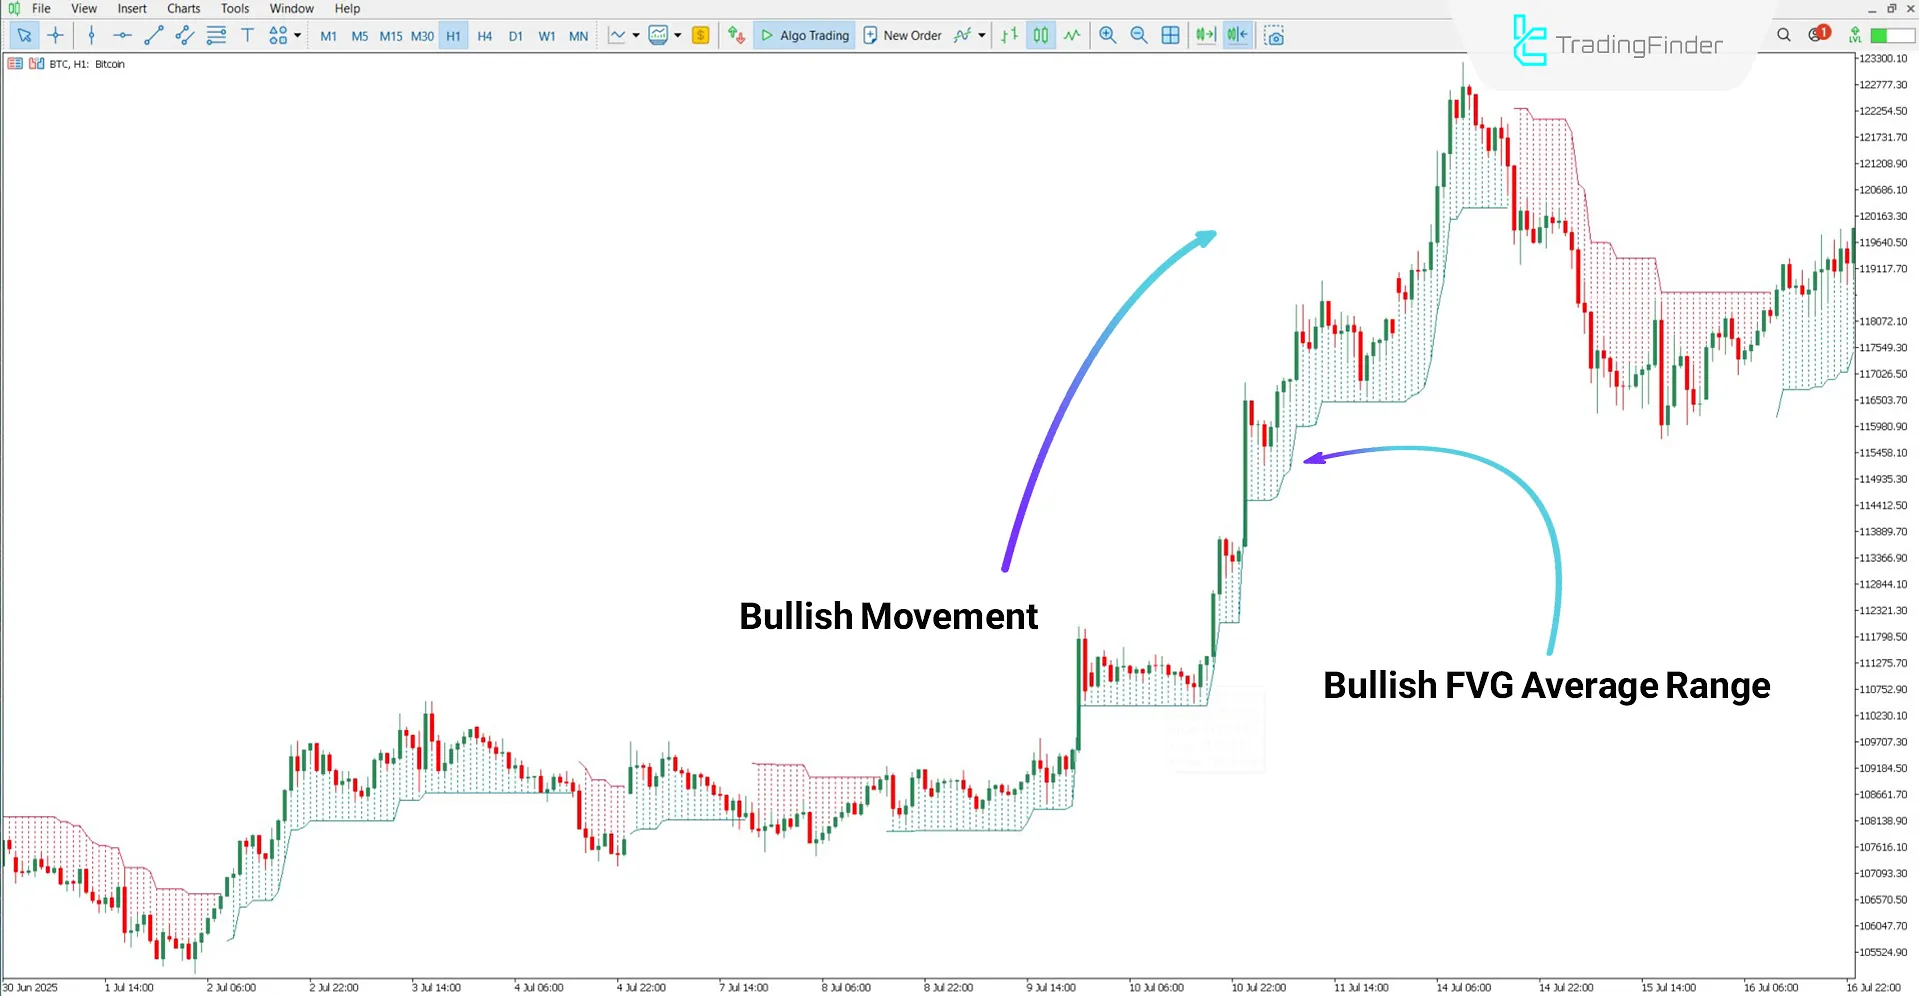
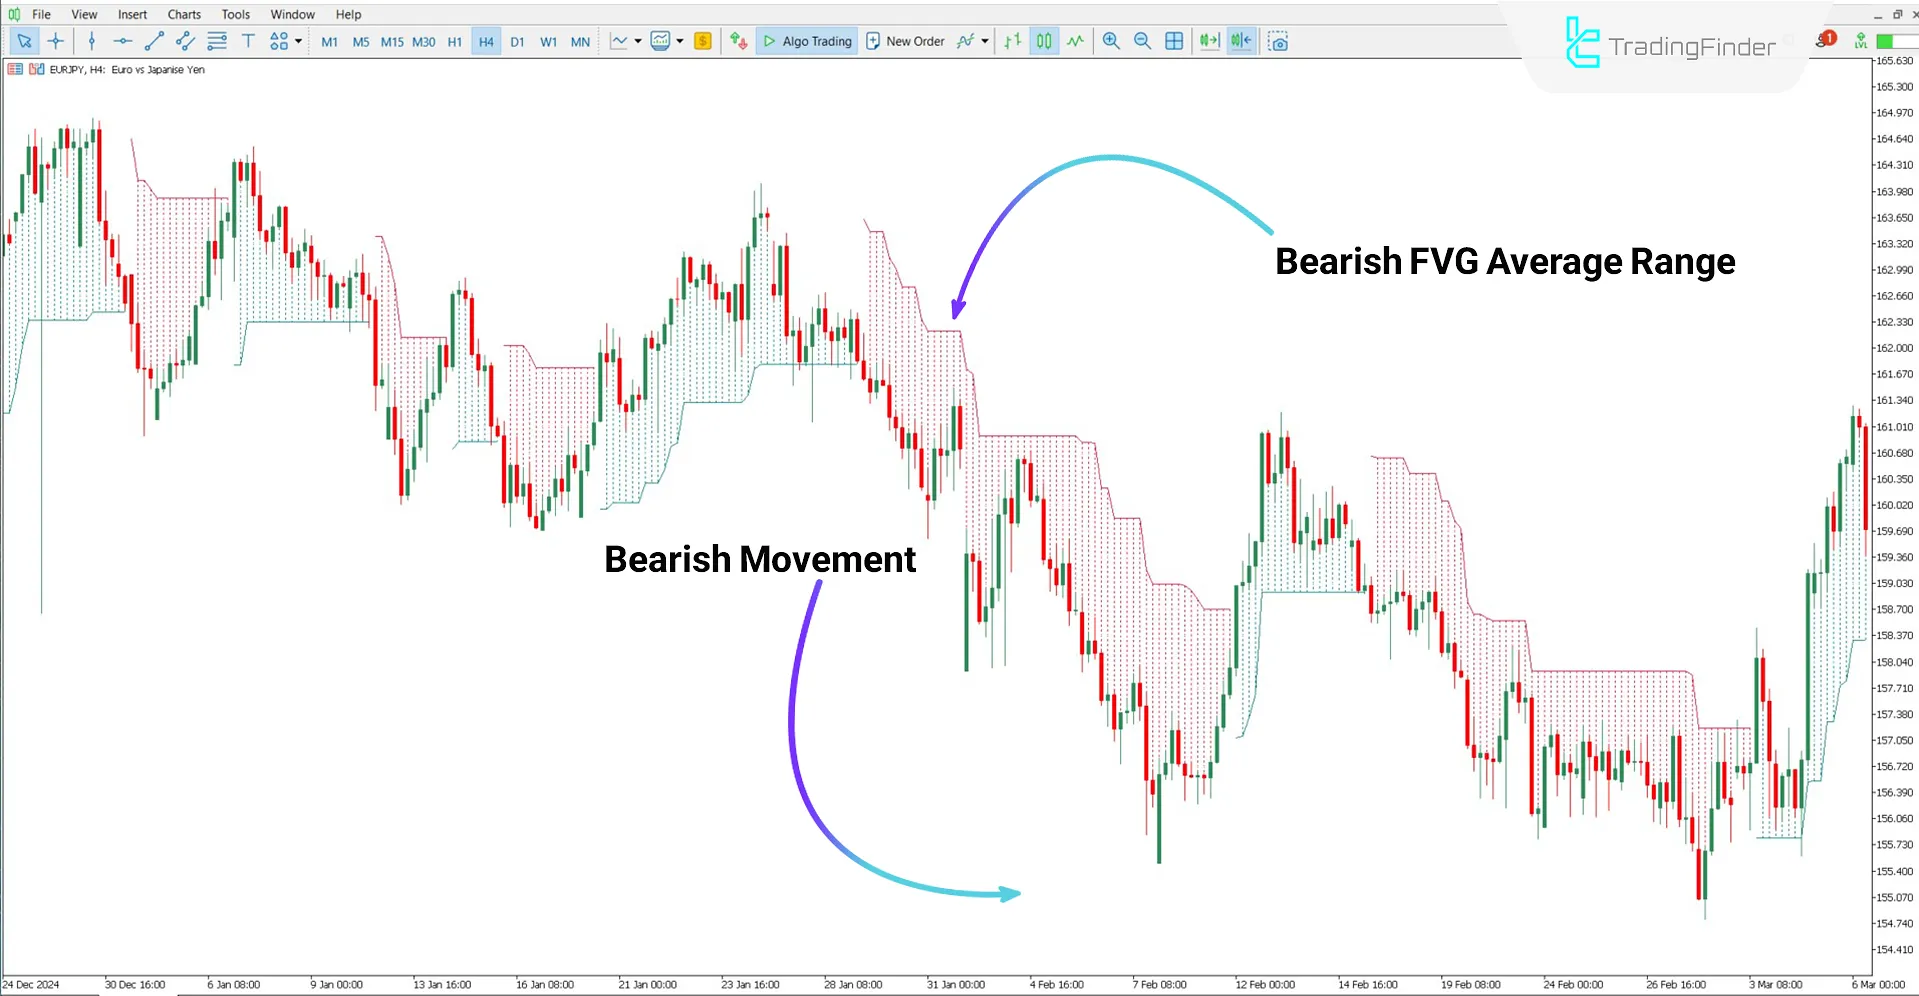
The FVG Average Positioning Indicator automatically detects and displays two types of price zones on the chart:
- Bullish FVG Average: Marked in green, generally indicating a potential support zone or bullish reversal area
- Bearish FVG Average: Marked in red, serving as a resistance zone or the beginning of a bearish move
Buy Trades
Based on the 1-hour Bitcoin (BTC) chart, the start of the green zone (Bullish FVG Average) is considered a suitable entry point for long positions.
Additionally, areas below this zone are considered suitable options for setting stop losses and managing risk.

Sell Trades
According to the 4-hour Euro to Japanese Yen (EUR/JPY) chart, the beginning of the red zone (Bearish FVG Average) is interpreted as a signal for initiating short positions.

Settings for Fair Value Gap Average Detection Indicator
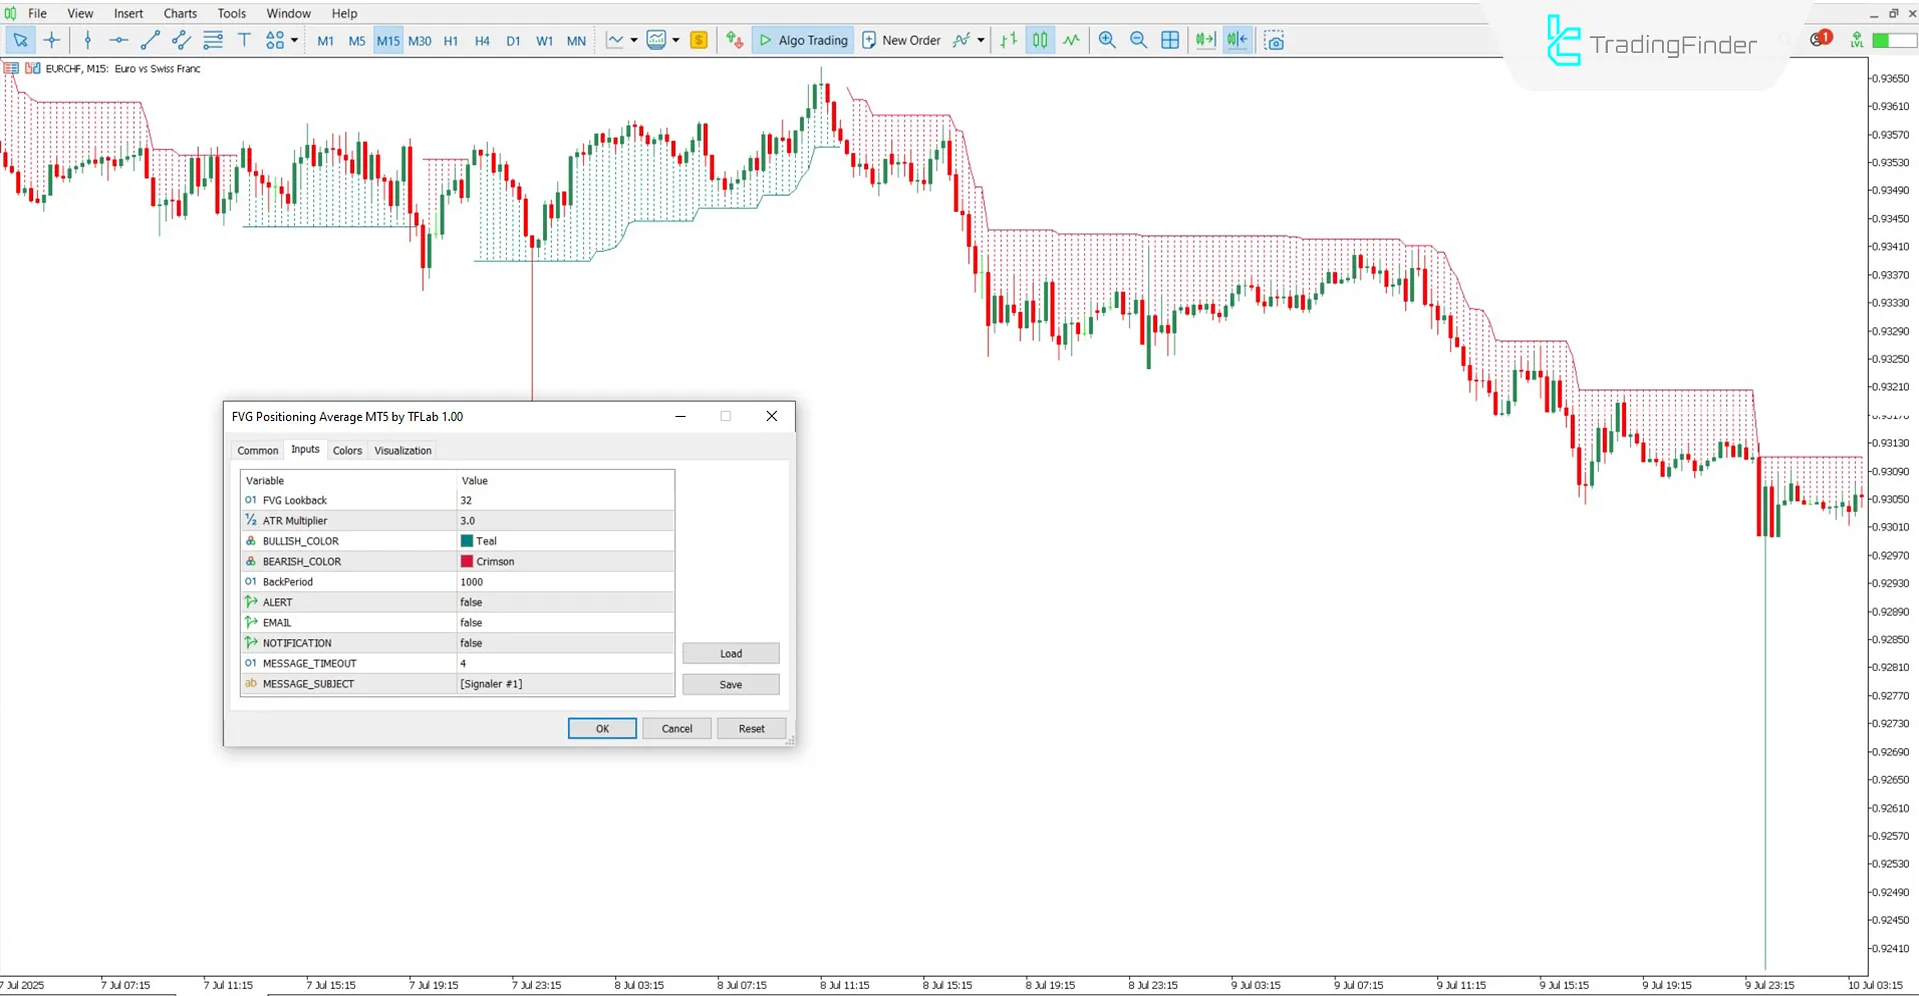
The image below shows the settings panel of the FVG Average Positioning Indicator:

- FVG Lookback: Number of candles used to calculate Fair Value Gap zones
- ATR Multiplier: Boost factor based on the ATR indicator
- BULLISH_COLOR: Display color for bullish zones
- BEARISH_COLOR: Display color for bearish zones
- BackPeriod: Number of past candles used for averaging
- ALERT: Enable alerts
- EMAIL: Send alerts via email
- NOTIFICATION: Send in-platform notification
- MESSAGE_TIMEOUT: Duration of alert message display
- MESSAGE_SUBJECT: Subject line for alert message
Conclusion
The FVG Average Positioning Indicator calculates average fair value gaps and marks specific zones on the chart where price interaction may lead to potential reactions or reversals.
Moreover, the levels above or below these zones serve as optimal areas for placing take-profit or stop-loss levels.
FVG Positioning Average Indicator MT5 PDF
FVG Positioning Average Indicator MT5 PDF
Click to download FVG Positioning Average Indicator MT5 PDFFor which market is this indicator most suitable?
The FVG Average Positioning Indicator can be used across all markets.
Can this tool be used in long-term timeframes?
Yes, the FVG Average Positioning Indicator applies not only to smaller timeframes but also to longer ones such as 4-hour, weekly, and monthly charts.


