![Fair Value Gap Sessions Indicator for MT5 Download - Free - [TFlab]](https://cdn.tradingfinder.com/image/283617/4-16-en-fvg-sessions-mt5-1.webp)
![Fair Value Gap Sessions Indicator for MT5 Download - Free - [TFlab] 0](https://cdn.tradingfinder.com/image/283617/4-16-en-fvg-sessions-mt5-1.webp)
![Fair Value Gap Sessions Indicator for MT5 Download - Free - [TFlab] 1](https://cdn.tradingfinder.com/image/283619/4-16-en-fvg-sessions-mt5-2.webp)
![Fair Value Gap Sessions Indicator for MT5 Download - Free - [TFlab] 2](https://cdn.tradingfinder.com/image/283616/4-16-en-fvg-sessions-mt5-3.webp)
![Fair Value Gap Sessions Indicator for MT5 Download - Free - [TFlab] 3](https://cdn.tradingfinder.com/image/283614/4-16-en-fvg-sessions-mt5-4.webp)
The FVG Session Intraday Indicator is designed to identify Fair Value Gaps (FVGs) in the New York, London, and Tokyo sessions. This indicator plots horizontal lines for price highs and lows during the specified sessions and marks the first FVG formed.
By detecting bullish and bearish FVG zones, traders using ICT strategies and other liquidity-based methods can analyze potential price reversals with greater accuracy.
Indicator Table
The table below outlines the features of the Fair Value Gap Session Intraday Indicator.
Indicator Categories: | Liquidity Indicators MT5 Indicators Session & KillZone MT5 Indicators ICT MT5 Indicators |
Platforms: | MetaTrader 5 Indicators |
Trading Skills: | Advanced |
Indicator Types: | Reversal MT5 Indicators |
Timeframe: | Daily-Weekly Timeframe MT5 Indicators |
Trading Style: | Intraday MT5 Indicators |
Trading Instruments: | Forex MT5 Indicators Crypto MT5 Indicators Stock MT5 Indicators Commodity MT5 Indicators Forward MT5 Indicators Share Stock MT5 Indicators |
Introduction
The FVG Session Intraday Indicator is designed to identify Fair Value Gaps (FVGs) in the New York, London, and Tokyo sessions. This indicator plots horizontal lines for price highs and lows during the specified sessions and marks the first FVG formed.
By detecting bullish and bearish FVG zones, traders using ICT strategies and other liquidity-based methods can analyze potential price reversals with greater accuracy.
Indicator in Uptrend
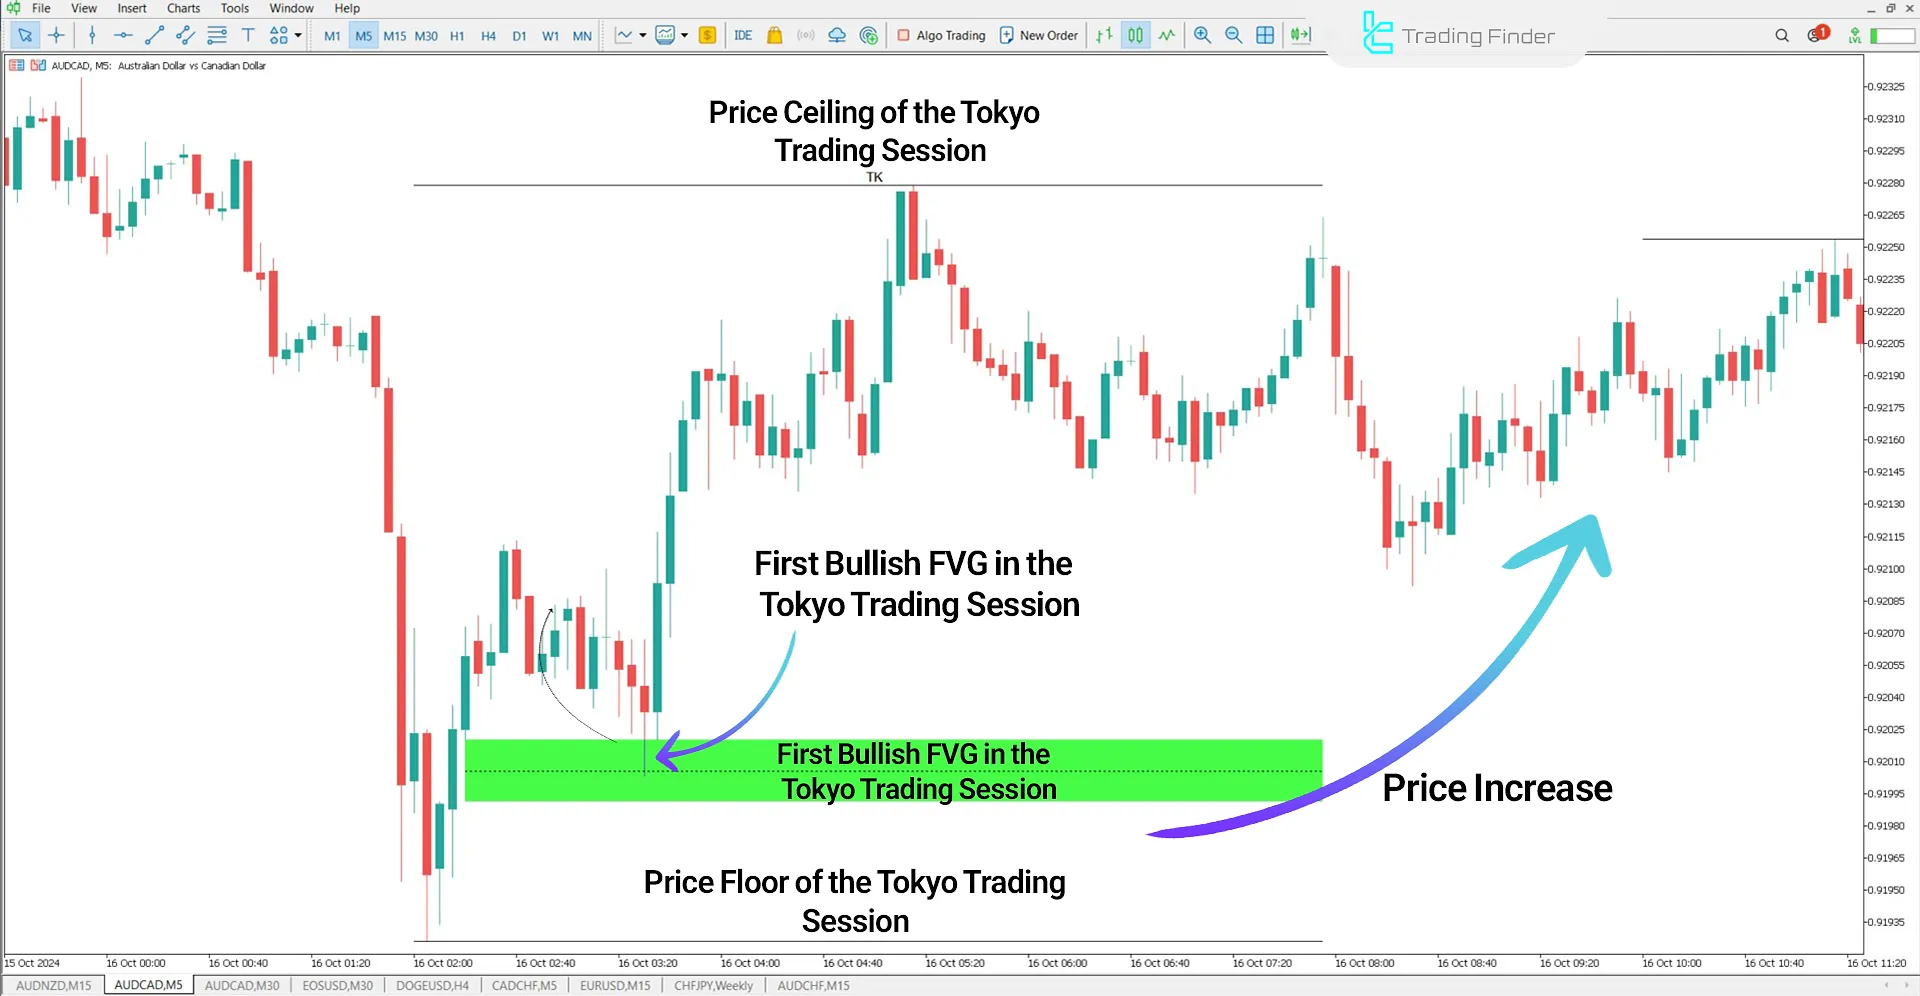
The price chart of the AUD/USD currency pair in a 15-minute uptrend is shown. During the Tokyo session, after forming a bullish FVG, the price moves upward and then retraces back to its first FVG zone to absorb liquidity.

Indicator in Downtrend
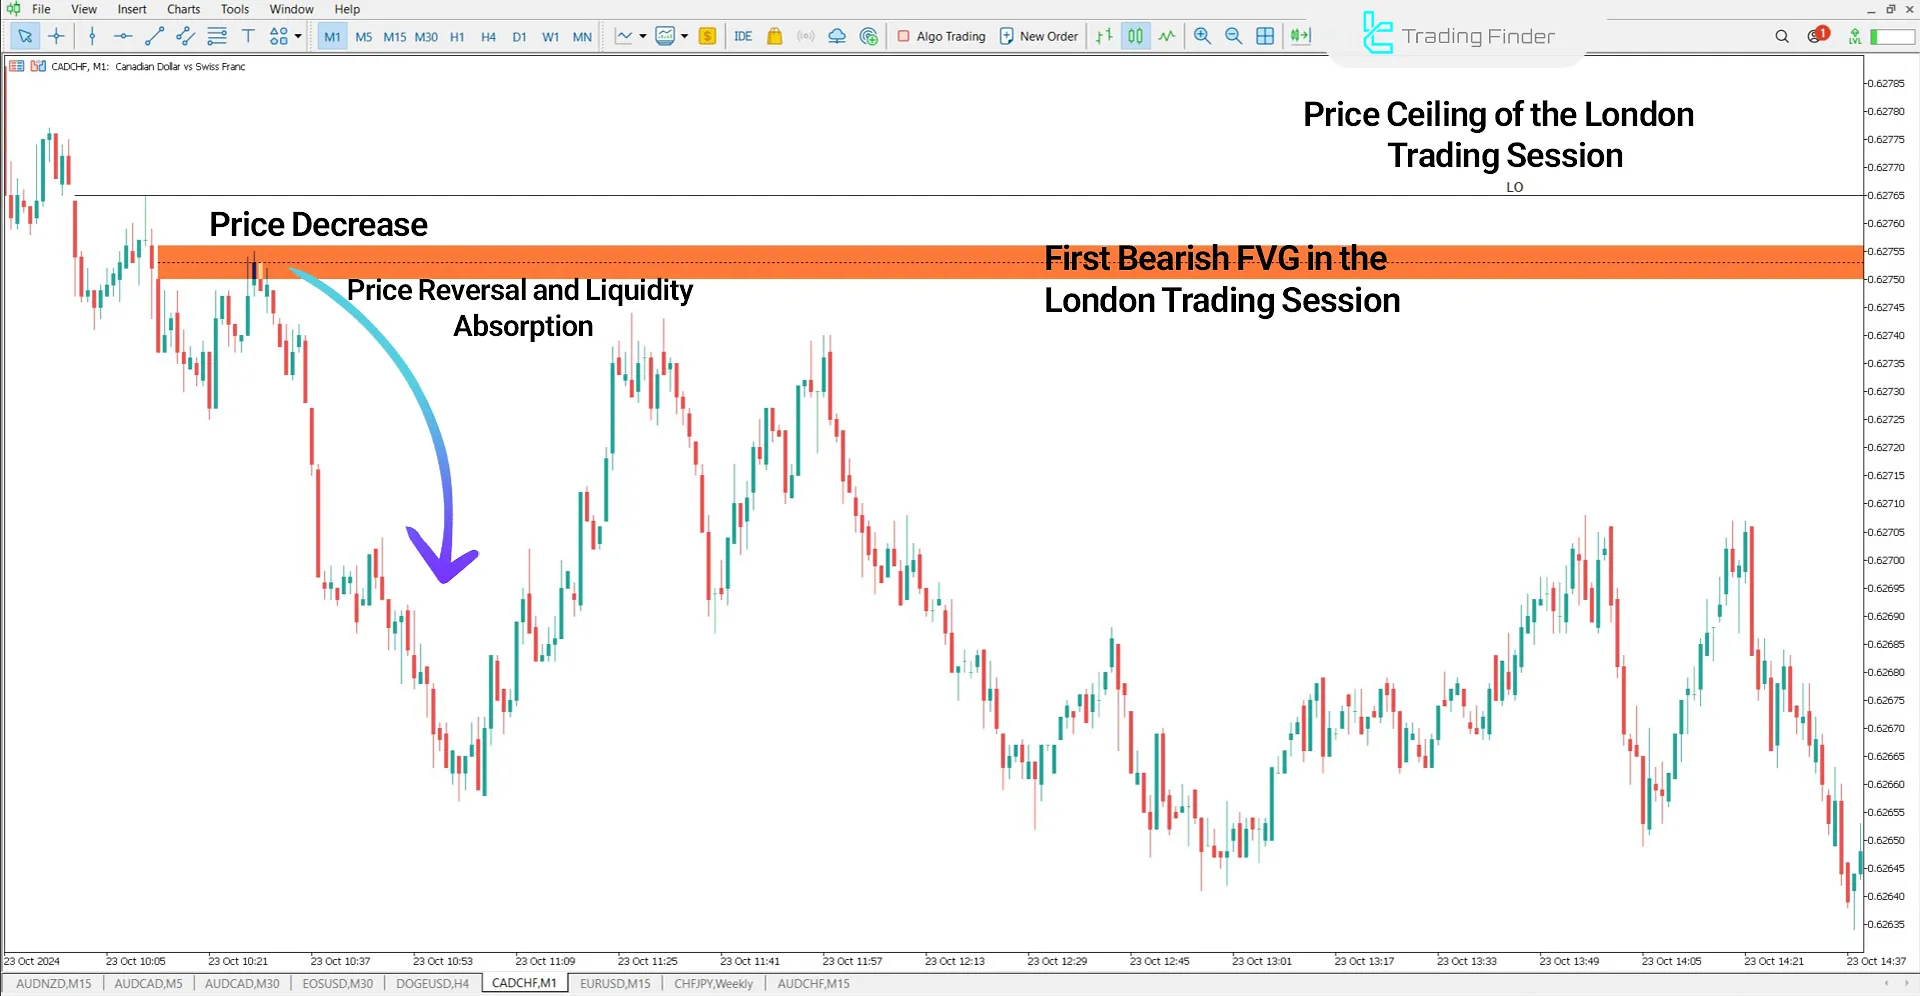
The price chart of the CAD/CHF currency pair in a 1-minute timeframe is displayed. After forming a bearish FVG, the price retraces to this level to trigger pending orders. Traders enter sell (Sell) positions, placing their stop-loss before these zones.

Indicator Settings
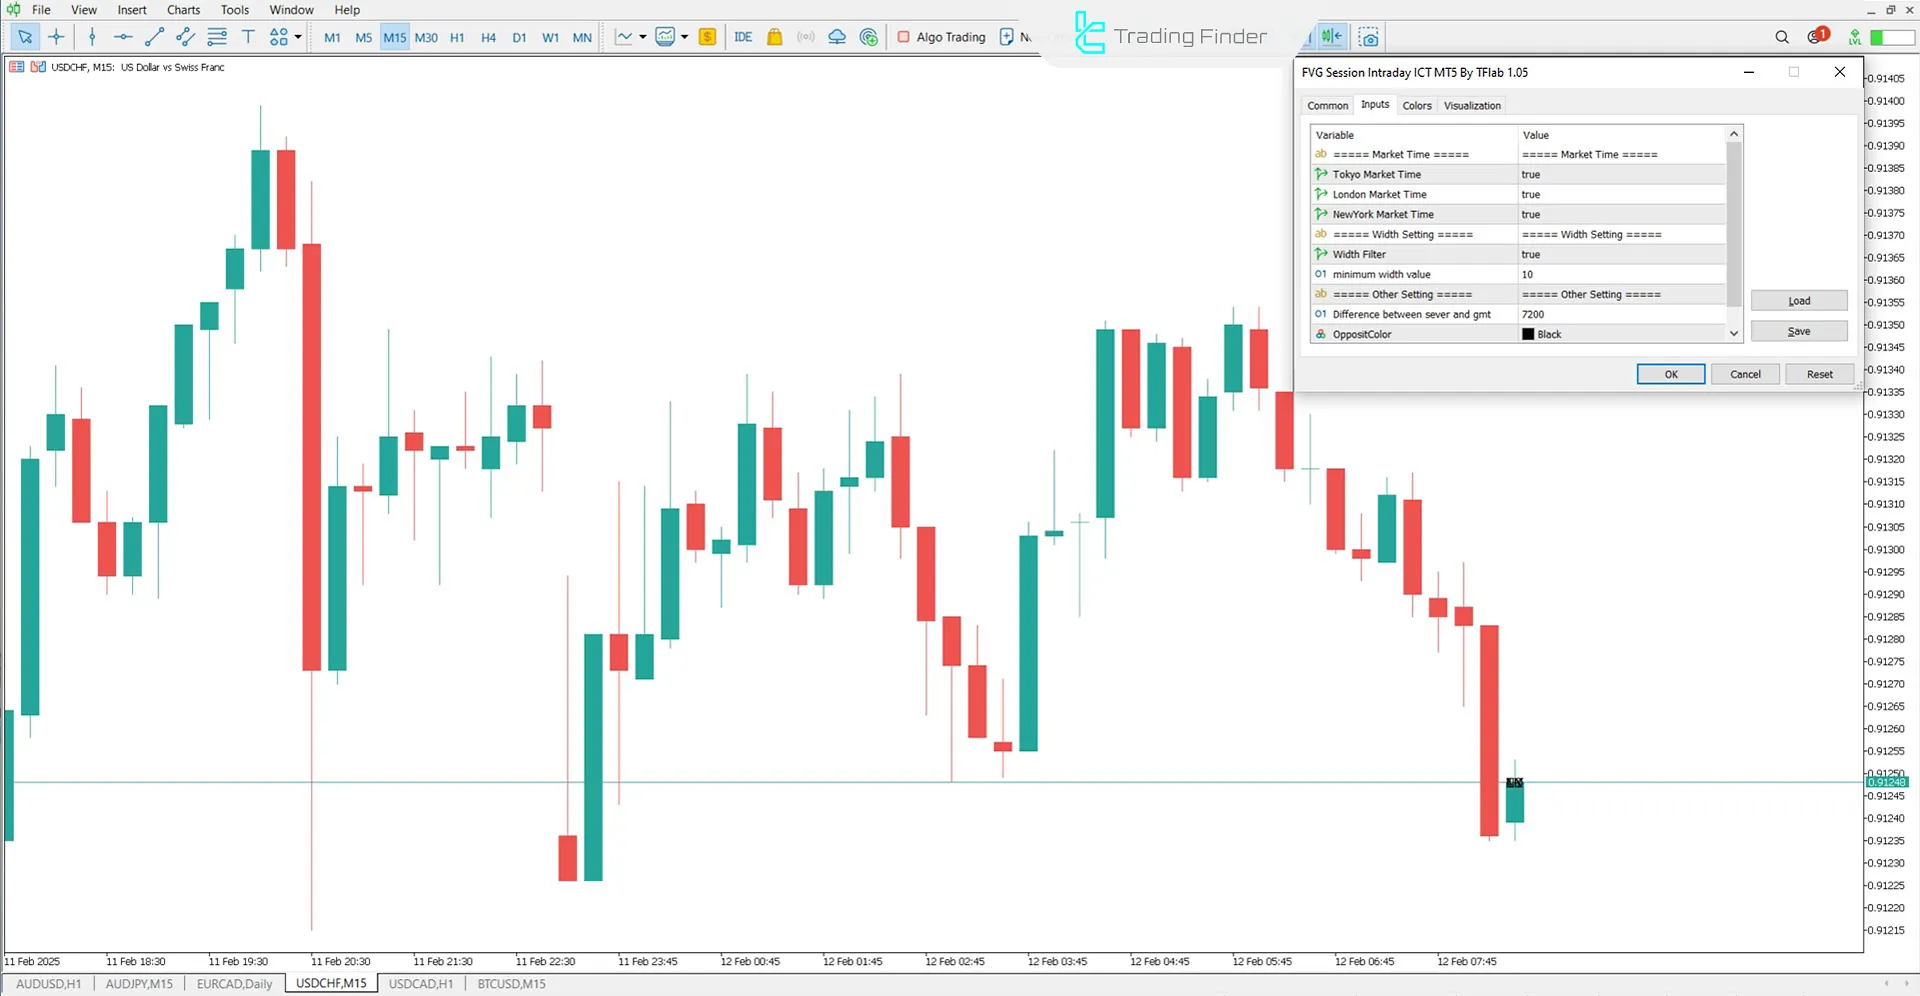
The settings section of the Fair Value Gap Session Intraday Indicator is displayed in the image below:

- Tokyo market time: Tokyo session time
- London market time: London session time
- New York market time: New York session time
- Width filter: Defines the width range
- Minimum width value: Minimum calculated width
- Difference between server and GMT: Time difference relative to GMT
Conclusion
The FVG Session Intraday Indicator is a powerful tool for MetaTrader 5, specifically designed for ICT traders and those using liquidity-based strategies.
This indicator accurately identifies and plots Fair Value Gaps (FVGs) in the New York, London, and Tokyo trading sessios, providing traders with valuable insights.
Fair Value Gap Sessions MT5 PDF
Fair Value Gap Sessions MT5 PDF
Click to download Fair Value Gap Sessions MT5 PDFHow does the FVG Session Indicator display bullish and bearish gaps?
The FVG Session Indicator shows bullish FVGs in green and bearish FVGs in red.
Is this indicator usable in all time frames?
This indicator is mainly designed for daily time frames but can also be applied in shorter ones.


