![Gann Square Indicator for MetaTrader 5 – Free Download [TradingFinder]](https://cdn.tradingfinder.com/image/507924/2-126-en-gann-square-mt5-1.webp)
![Gann Square Indicator for MetaTrader 5 – Free Download [TradingFinder] 0](https://cdn.tradingfinder.com/image/507924/2-126-en-gann-square-mt5-1.webp)
![Gann Square Indicator for MetaTrader 5 – Free Download [TradingFinder] 1](https://cdn.tradingfinder.com/image/507913/2-126-en-gann-square-mt5-2.webp)
![Gann Square Indicator for MetaTrader 5 – Free Download [TradingFinder] 2](https://cdn.tradingfinder.com/image/507925/2-126-en-gann-square-mt5-3.webp)
![Gann Square Indicator for MetaTrader 5 – Free Download [TradingFinder] 3](https://cdn.tradingfinder.com/image/507927/2-126-en-gann-square-mt5-4.webp)
The Gann Square Indicator, by leveraging numerical symmetry between price and time, enables more accurate identification of market turning points, support and resistance zones, and trend directions.
The functional structure of this indicator is based on the combination of geometric and time-based components, including:
- Gann Angles
- Gann Square
- Gann Fans
- Time Arcs
Gann Square Indicator Table
The general specifications of the Gann Square Indicator are presented in the table below.
Indicator Categories: | Signal & Forecast MT5 Indicators Trading Assist MT5 Indicators Levels MT5 Indicators Gann Indicators for MetaTrader 5 |
Platforms: | MetaTrader 5 Indicators |
Trading Skills: | Elementary |
Indicator Types: | Breakout MT5 Indicators Reversal MT5 Indicators |
Timeframe: | Multi-Timeframe MT5 Indicators |
Trading Style: | Intraday MT5 Indicators |
Trading Instruments: | Forex MT5 Indicators Crypto MT5 Indicators Stock MT5 Indicators |
Gann Square Indicator Overview
The Gann Square Indicator is a tool designed by combining price behavior and time cycles, aimed at detecting sensitive entry and exit zones in trading tool. Its operational structure is as follows:
- Alignment of Time and Price: Relative synchronization of these two factors often signals a potential trend reversal
- Angles and Diagonal Line Analysis: Price reactions to critical Gann angles (touch or breakout) serve as a measure of the strength or weakness of the prevailing trend
- Price Time Confluence: Convergence zones formed by intersections of Gann fan lines with horizontal price levels and vertical time axes are recognized as highly sensitive areas with the potential for strong market reactions
Indicator in an Uptrend
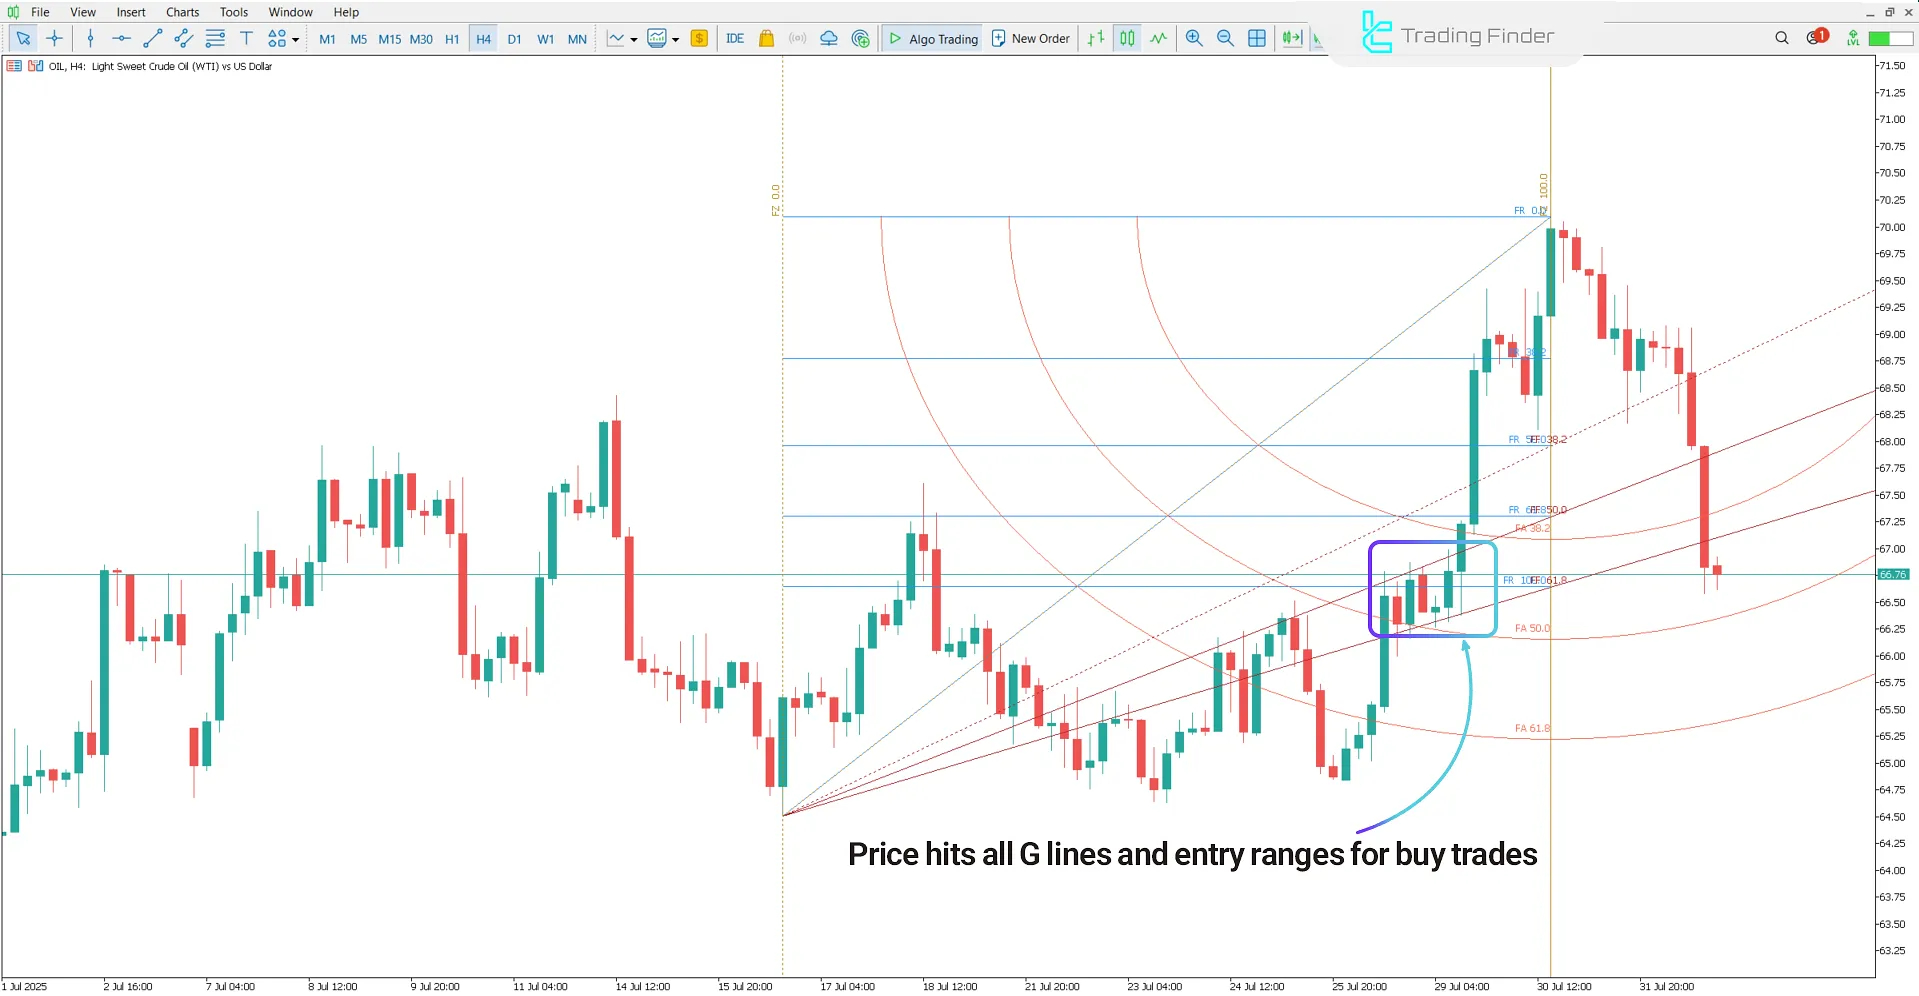
The following chart shows the OIL Index on a 4-hour timeframe. In an uptrend, when the price surpasses the 61.8% level and breaks higher angles such as 38.2, it reflects the buying pressure and dominance of demand in the market.
Additionally, the price touching ascending Gann fan lines, if coinciding with primary time cycles, can serve as a valid signal for entering long positions.

Indicator in a Downtrend
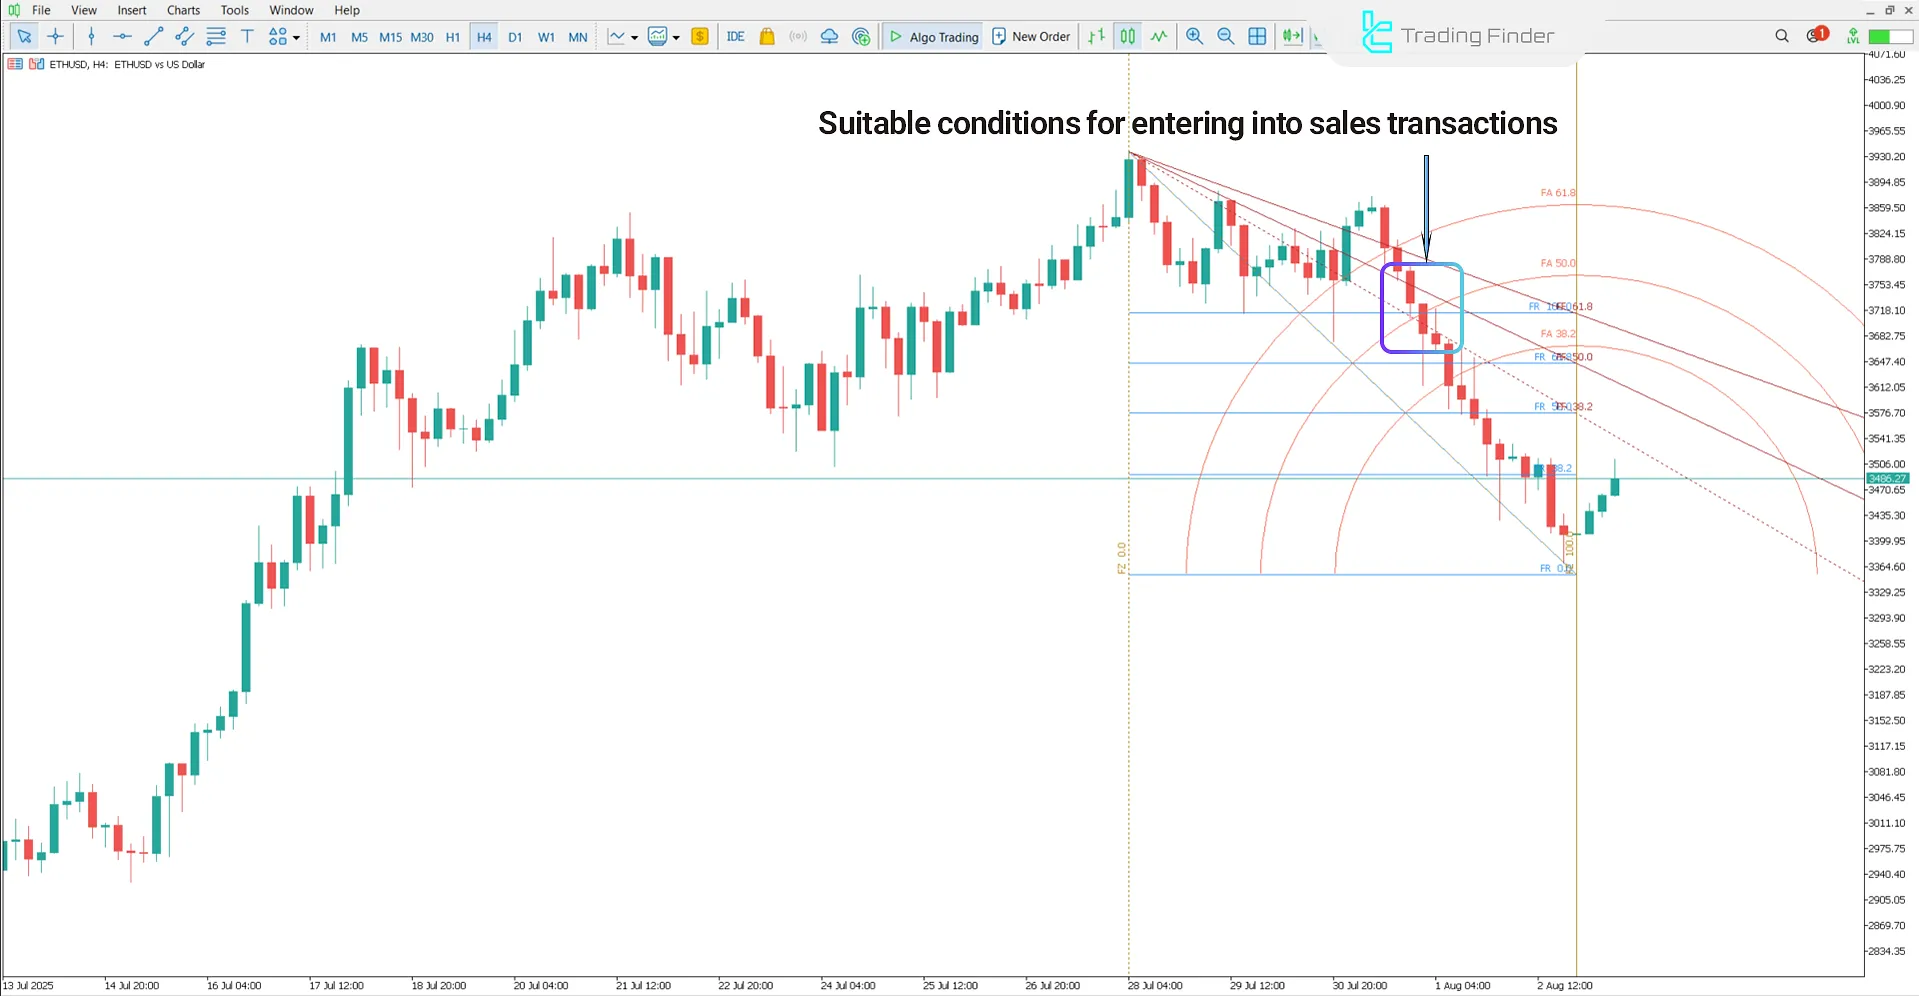
The following chart shows the Ethereum Index (ETH/USD) on a 4-hour timeframe. In a downtrend, when the price falls below the 61.8% level and breaks lower angles, it signals increasing selling pressure and weakening demand power.
Suppose this movement coincides with the formation of a price top in a sensitive time zone or an adverse reaction to descending Gann fan lines. In that case, it is a significant signal for the continuation of the bearish trend.

Gann Square Indicator Settings
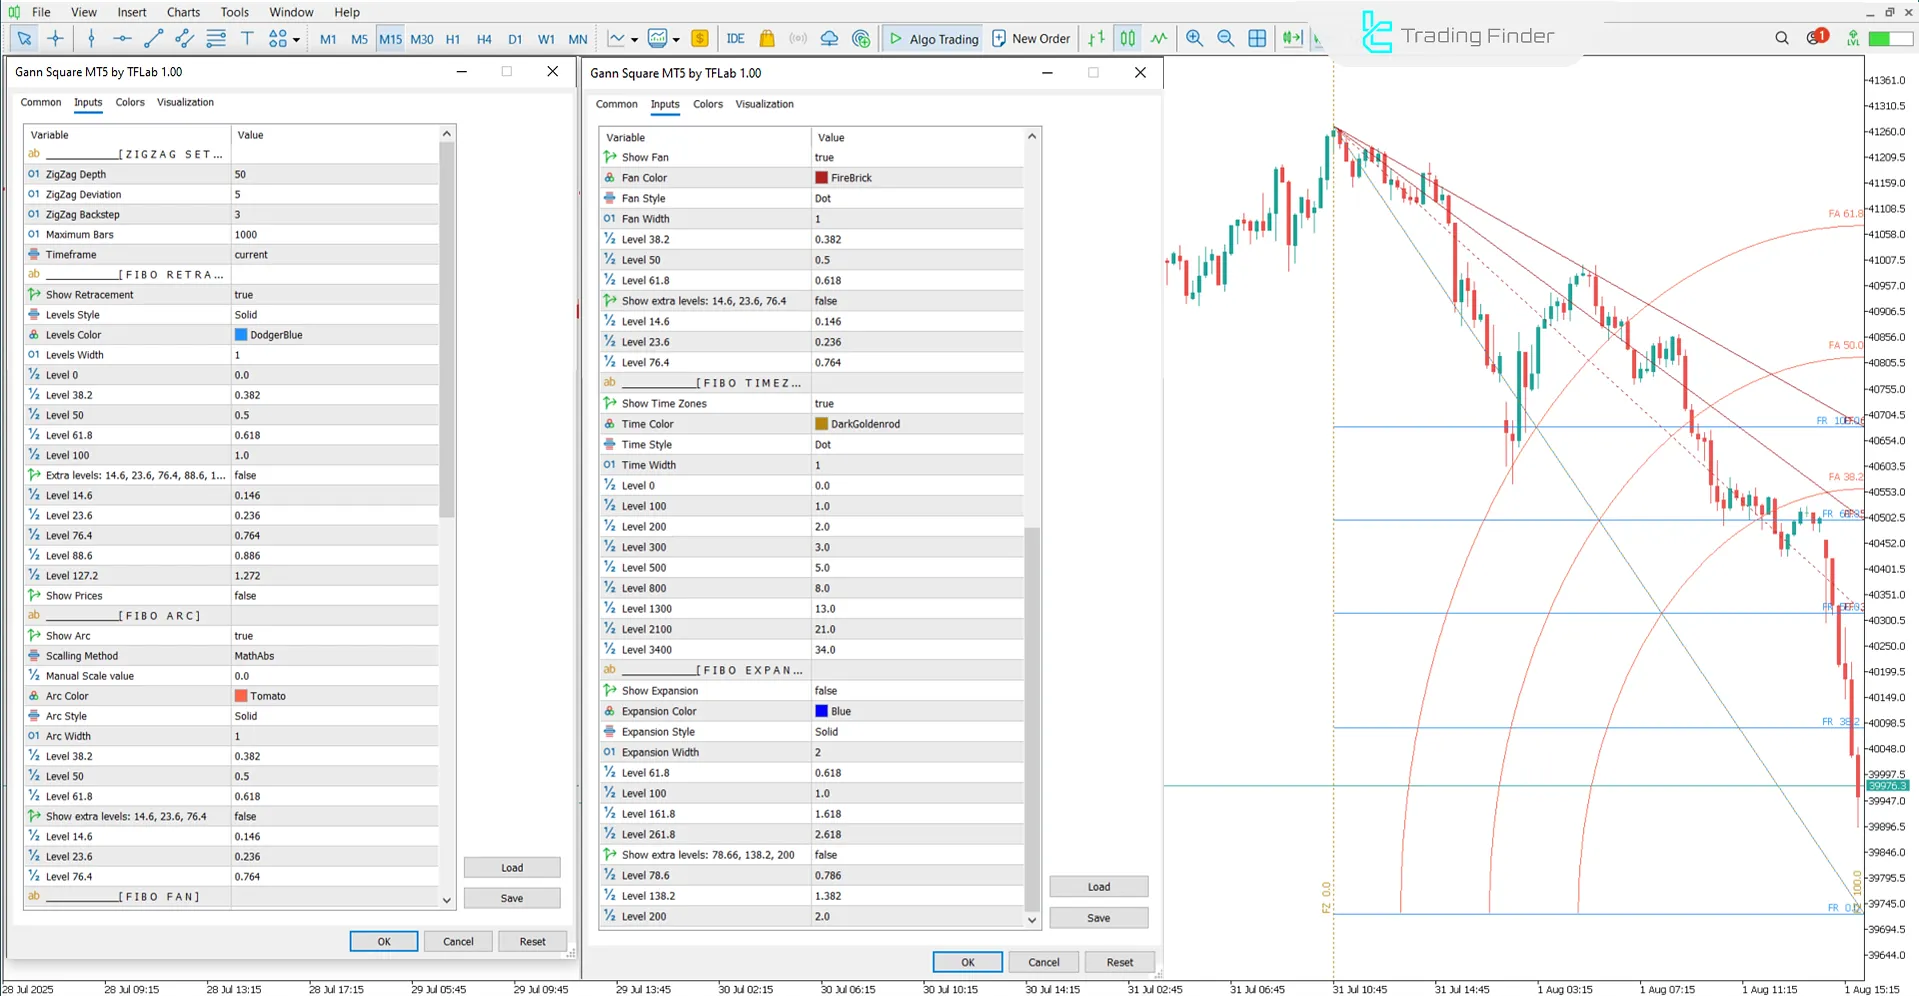
The settings panel of the Gann Square Indicator is shown in the image below:

ZIGZAG SETTING
- ZigZag Depth: Controls sensitivity to price swings
- ZigZag Deviation: Minimum price change for a new leg
- ZigZag Backstep: Filter to avoid false pivots
- Maximum Bars: Number of candles used in calculation
- Timeframe: Chart period for analysis
FIBO RETRACEMENT
- Show Retracement: Enables Fibonacci retracement display
- Level Style: Visual format of retracement lines
- Levels Color: Show format of retracement lines
- Levels Width: Display Visual format of retracement lines
- Level 0: Baseline Price Level 0%
- Level 38.2: Golden Ratio Zone 38.2%
- Level 50: Midpoint Retracement Level 50%
- Level 61.8: Key Fibonacci Ratio 61.8%
- Level 100: Full Price Range 100%
- Extra Levels: Additional Fibonacci Ratios
- Level 14.6: Minor Support Level 14.6%
- Level 23.6: Shallow Retracement Zone 23.6%
- Level 76.4: Deep Pullback Level 76.4%
- Level 88.6: Extreme Retracement Zone 88.6%
- Level 127.2: Extended Target Level 127.2%
- Show Prices: Display Price Labels
FIBO ARC
- Show Arc: Display Fibonacci Arc
- Scaling Method: Arc Scaling Mode
- Manual Scale Value: Custom Scale Input
- Arc Color: Arc Line Color
- Arc Style: Arc Line Style
- Arc Width: Arc Line Thickness
- Level 38.2: Golden Ratio Zone 38.2%
- Level 50: Midpoint Retracement Level 50%
- Level 61.8: Key Fibonacci Ratio 61.8%
- Show extra levels: Display Additional Ratios
- Level 14.6: Minor Support Ratio 14.6%
- Level 23.6: Shallow Retracement Zone 23.6%
- Level 76.4: Deep Pullback Ratio 76.4%
FIBO FAN
- Fan Color: Fan Line Color
- Fan Style: Fan Line Style
- Fan Width: Fan Line Thickness
- Level 38.2: Golden Ratio Zone 38.2%
- Level 50: Midpoint Retracement Level 50%
- Level 61.8: Key Fibonacci Ratio 61.8%
- Show extra levels: Display Additional Ratios
- Level 14.6: Minor Support Ratio 14.6%
- Level 23.6: Shallow Retracement Zone 23.6%
- Level 76.4: Deep Pullback Ratio 76.4%
FIBO TIMEZONES
- Show Time Zones: Display Time Intervals
- Time Color: Zone Line Color
- Time Style: Zone Line Style
- Time Width: Zone Line Thickness
- Level 0: Starting Time Point 0%
- Level 100: First Cycle Zone 100%
- Level 200: Second Cycle Zone 200%
- Level 300: Third Cycle Zone 300%
- Level 500: Fifth Cycle Zone 500%
- Level 800: Eighth Cycle Zone 800%
- Level 1300: Thirteenth Cycle Zone 1300%
- Level 2100: Twenty First Cycle 2100%
- Level 3400: Thirty Fourth Cycle 3400%
FIBO EXPANSION
- Show Expansion: Display Price Projection
- Expansion Color: Expansion Line Color
- Expansion Style: Expansion Line Style
- Expansion Width: Expansion Line Thickness
- Level 61.8: Golden Ratio Target 61.8%
- Level 100: ull Range Projection 100%
- Level 161.8: Extended Fibonacci Target 161.8%
- Level 261.8: Advanced Expansion Level 261.8%
- Show extra levels: Display Additional Ratios
- Level 78.6: Deep Retracement Ratio 78.6%
- Level 138.2: Extended Projection Zone 138.2%
- Level 200: Double Range Target 200%
Conclusion
The Gann Square Indicator is one of the advanced tools in technical analysis that, by combining market geometry, time, and price, identifies turning points and significant levels.
It is composed of Gann Angles, Gann Square, Gann Fans, and Time Arcs, all designed based on time–price symmetry.
Gann Square Indicator for MetaTrader 5 PDF
Gann Square Indicator for MetaTrader 5 PDF
Click to download Gann Square Indicator for MetaTrader 5 PDFWhich markets are the Gann Square Indicator suitable for?
This indicator can be used for all markets, including Forex, Crypto, Stocks, and Commodities.
How is time–price symmetry used in the Gann Square Indicator?
By drawing symmetrical angles from price pivot points, the analyst can identify key time levels with a high probability of market reactions, thereby defining optimal entry zones.


