


The Guppy Multiple Moving Average (GMMA) indicator analyzes the strength and direction of the market using multiple exponential moving averages (EMA).
This trading tool "Long" version focuses primarily on long-term moving averages and is typically used to confirm strong and established trends.
On the chart, the movingaveragelines are displayed as red lines.
Guppy Multiple Moving Average Long Indicator Specification Table
The table below outlines the features of the Guppy Multiple Moving Average Long indicator.
Indicator Categories: | Support & Resistance MT5 Indicators Currency Strength MT5 Indicators Chart & Classic MT5 Indicators |
Platforms: | MetaTrader 5 Indicators |
Trading Skills: | Elementary |
Indicator Types: | Trend MT5 Indicators Reversal MT5 Indicators |
Timeframe: | Multi-Timeframe MT5 Indicators |
Trading Style: | Swing Trading MT5 Indicators Scalper MT5 Indicators Day Trading MT5 Indicators Fast Scalper MT5 Indicators |
Trading Instruments: | Forex MT5 Indicators Crypto MT5 Indicators Stock MT5 Indicators |
Guppy Multiple Moving Average (GMMA) at a Glance
The moving average lines in the GMMA indicator help analyze market strength and direction and function as dynamic support and resistance levels.
When the price is below these lines, they act as resistance and hinder upward movement; conversely, when the price is above, they serve as support and help prevent further declines.
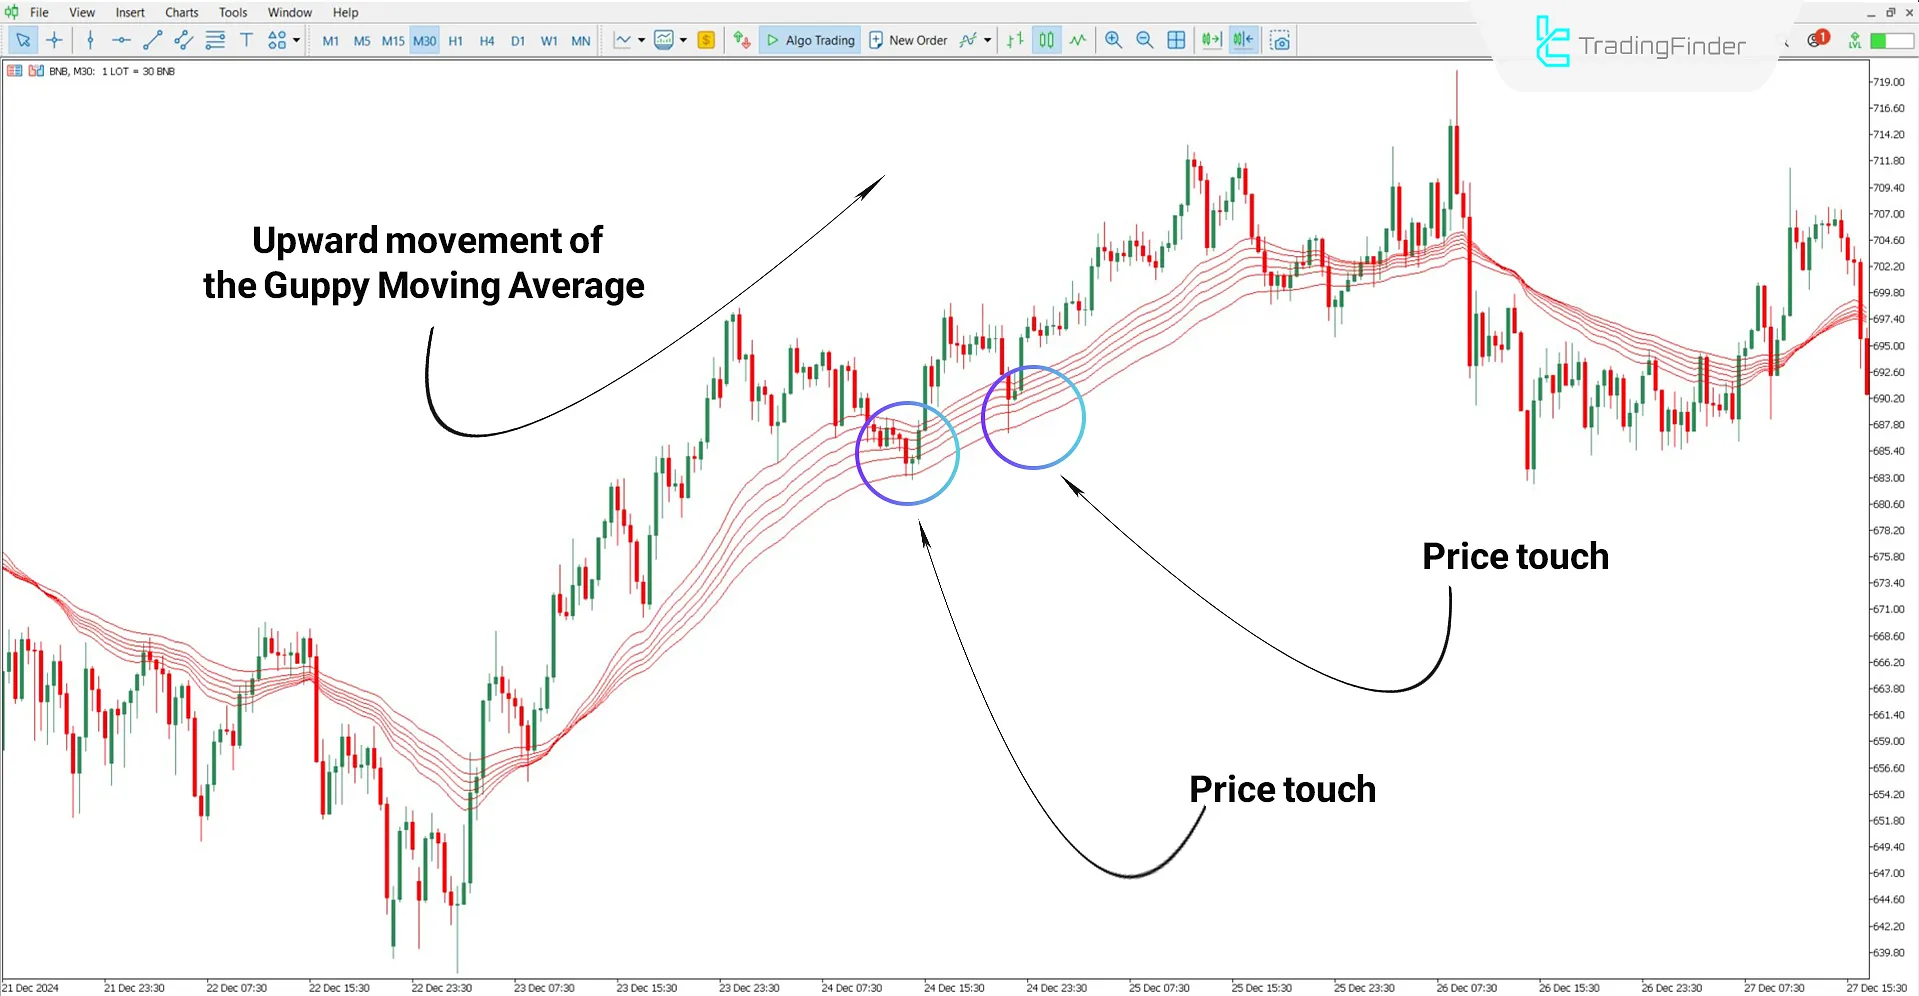
Bullish Trend Conditions
Based on the 30-minute Binance Coin (BNB) chart, the upward slope of GMMA lines indicates the market's bullish tendency.
As shown in the image, price touches the lines in two separate areas, each time reacting positively, which reinforces the indicator's supportive behavior.
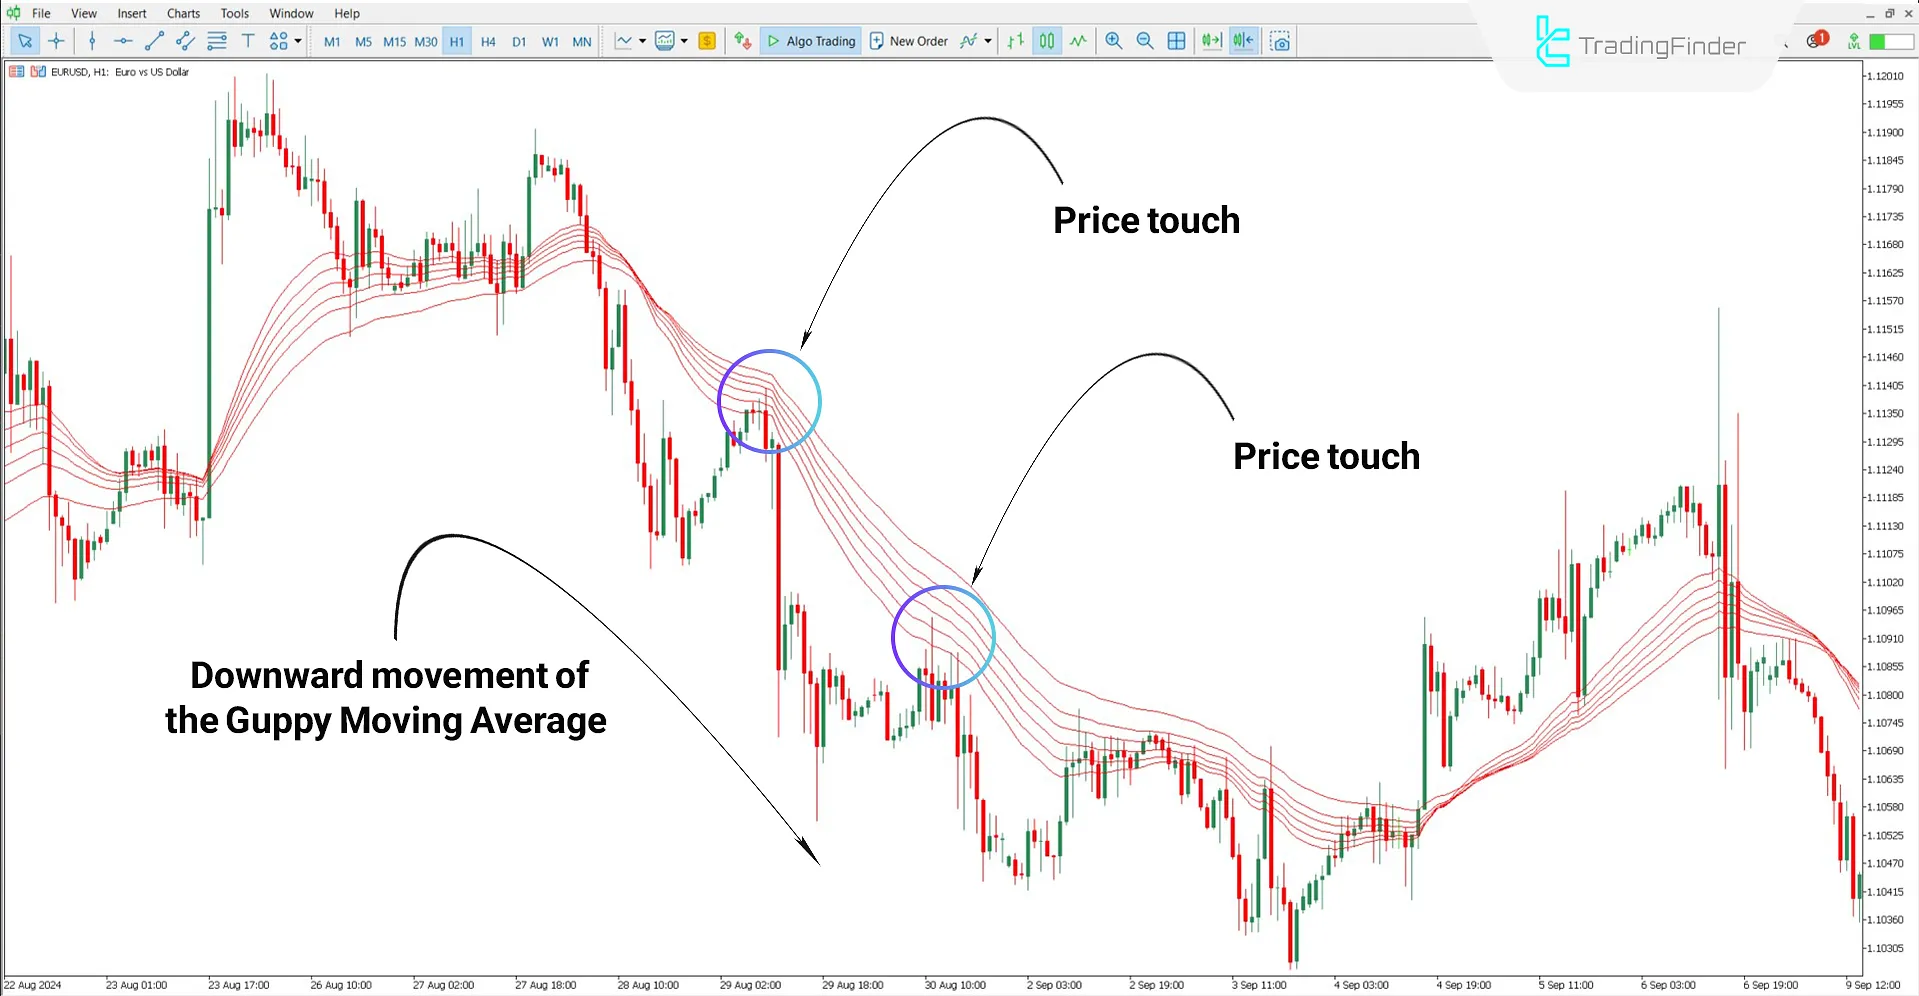
Bearish Trend Conditions
According to the EUR/USD one-hour chart, the downward slope of the GMMA indicates the market's bearish inclination.
As seen, price touches the moving average bands at two points, each time reacting with a decline. These responses demonstrate the resistance role of the GMMA lines within the market structure.
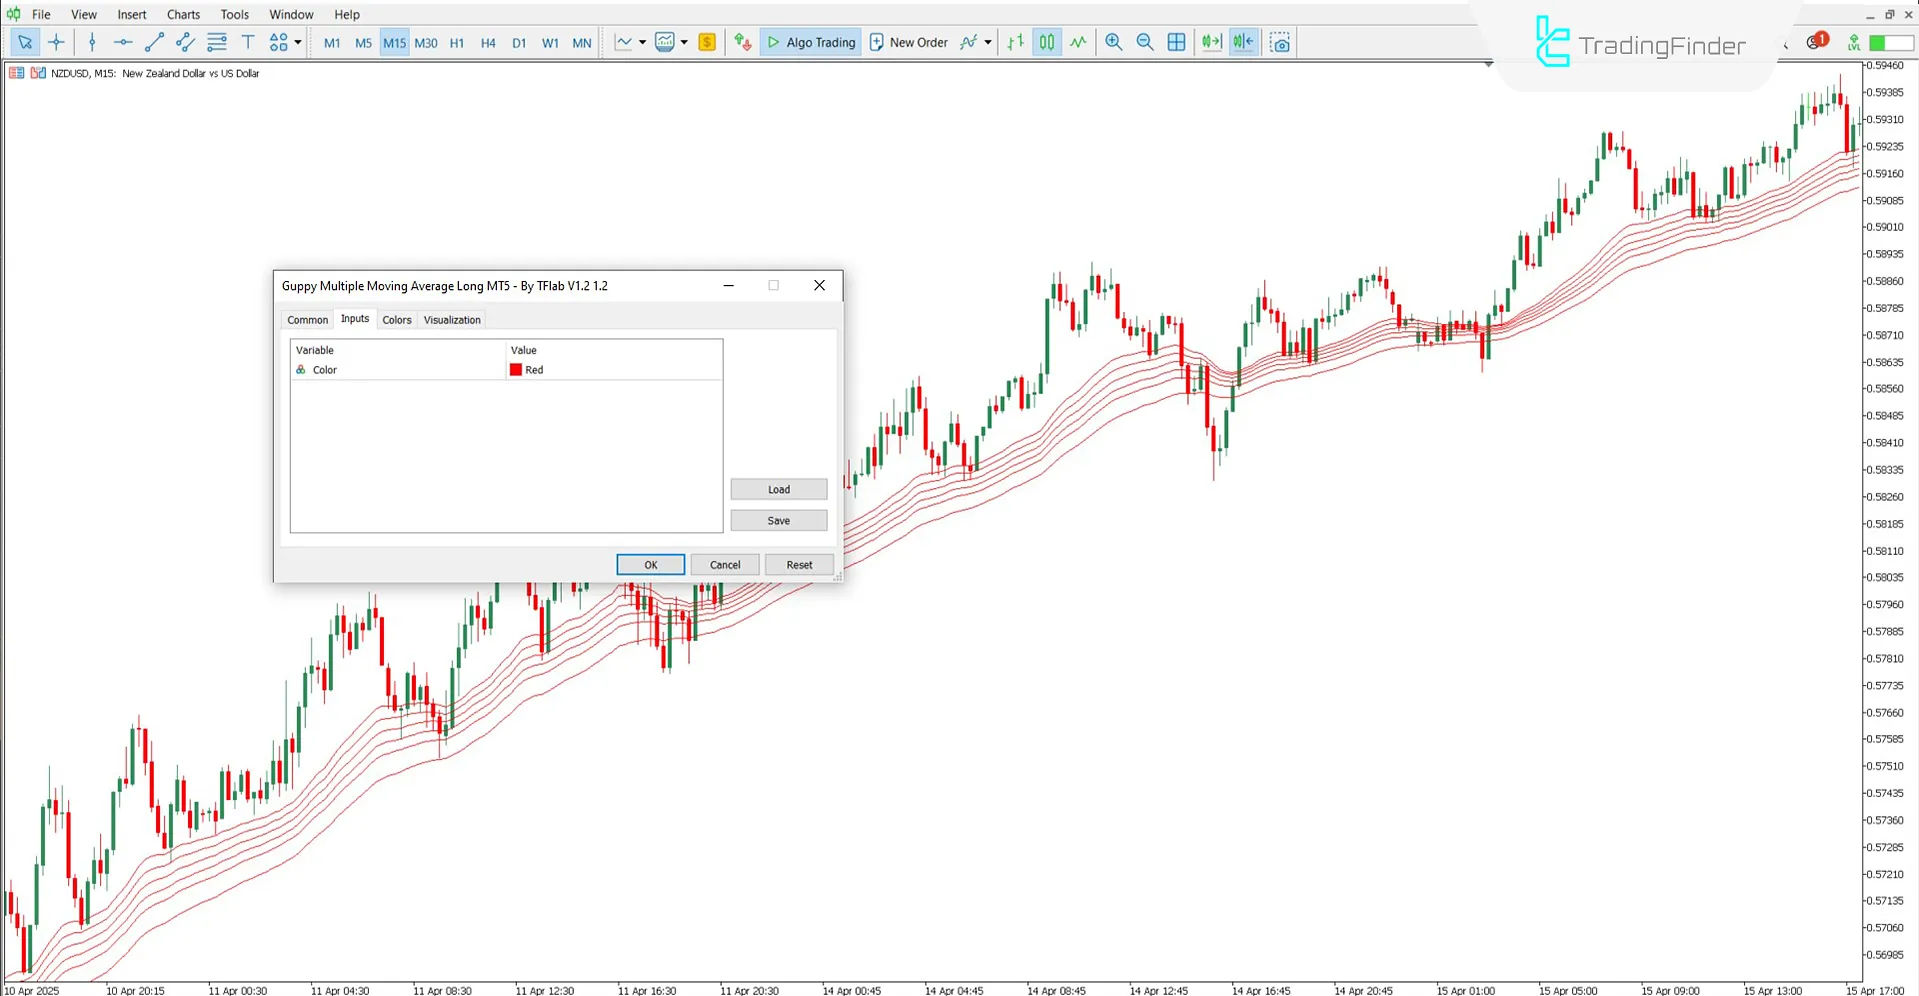
GMMA Indicator Settings
The image below shows the settings panel for the Guppy Multiple Moving Average Long indicator:
- Color: Set the color of Guppy moving average lines
Conclusion
The Guppy Multiple Moving Average Long indicator uses six exponential moving averages to plot dynamic and adaptable support and resistance zones on the chart.
The overall direction of these averages provides analysts with a general perspective on probable market movement.
This tool is recognized as one of the most powerful technical analysis indicators and is compatible with various trading strategies, both short-term and long-term.
Guppy Multiple Moving Average MT5 PDF
Guppy Multiple Moving Average MT5 PDF
Click to download Guppy Multiple Moving Average MT5 PDFDoes this indicator provide trading signals?
No, this tool is designed to offer a visual overview of market movement and highlight key price interaction zones, but it does not generate entry or exit signals.
Can this tool be used in the stock market?
Yes, this indicator is compatible with all markets, including stocks.


