![Hidden SMT Divergence Indicator for MT5 Download – Free – [TFlab]](https://cdn.tradingfinder.com/image/267161/13-85-en-hidden-smt-divergence-mt5-01.webp)
![Hidden SMT Divergence Indicator for MT5 Download – Free – [TFlab] 0](https://cdn.tradingfinder.com/image/267161/13-85-en-hidden-smt-divergence-mt5-01.webp)
![Hidden SMT Divergence Indicator for MT5 Download – Free – [TFlab] 1](https://cdn.tradingfinder.com/image/267163/13-85-en-hidden-smt-divergence-mt5-02.webp)
![Hidden SMT Divergence Indicator for MT5 Download – Free – [TFlab] 2](https://cdn.tradingfinder.com/image/267165/13-85-en-hidden-smt-divergence-mt5-03.webp)
![Hidden SMT Divergence Indicator for MT5 Download – Free – [TFlab] 3](https://cdn.tradingfinder.com/image/267162/13-85-en-hidden-smt-divergence-mt5-04.webp)
The Hidden SMT Divergence Indicator is designed to identify subtle changes and divergences between three trading instruments (stock indices).
This indicator is based on liquidity and the Smart Money trading strategy. It assesses the power differences between correlated instruments. A divergence between converging assets may signal a potential trend reversal.
Hidden Smart Money Divergence Indicator Specifications
The table below outlines the specifications of the Hidden SMT Divergence Indicator.
Indicator Categories: | Smart Money MT5 Indicators Liquidity Indicators MT5 Indicators ICT MT5 Indicators |
Platforms: | MetaTrader 5 Indicators |
Trading Skills: | Advanced |
Indicator Types: | Reversal MT5 Indicators |
Timeframe: | Multi-Timeframe MT5 Indicators |
Trading Style: | Day Trading MT5 Indicators |
Trading Instruments: | Stock MT5 Indicators |
Overview of the Hidden SMT Divergence Indicator
When an indicator plots new highs or lows in one asset, but the correlated instrument fails to confirm the movement, hidden divergence occurs. This pattern can be used in both bullish and bearish trends.
Bullish Trend
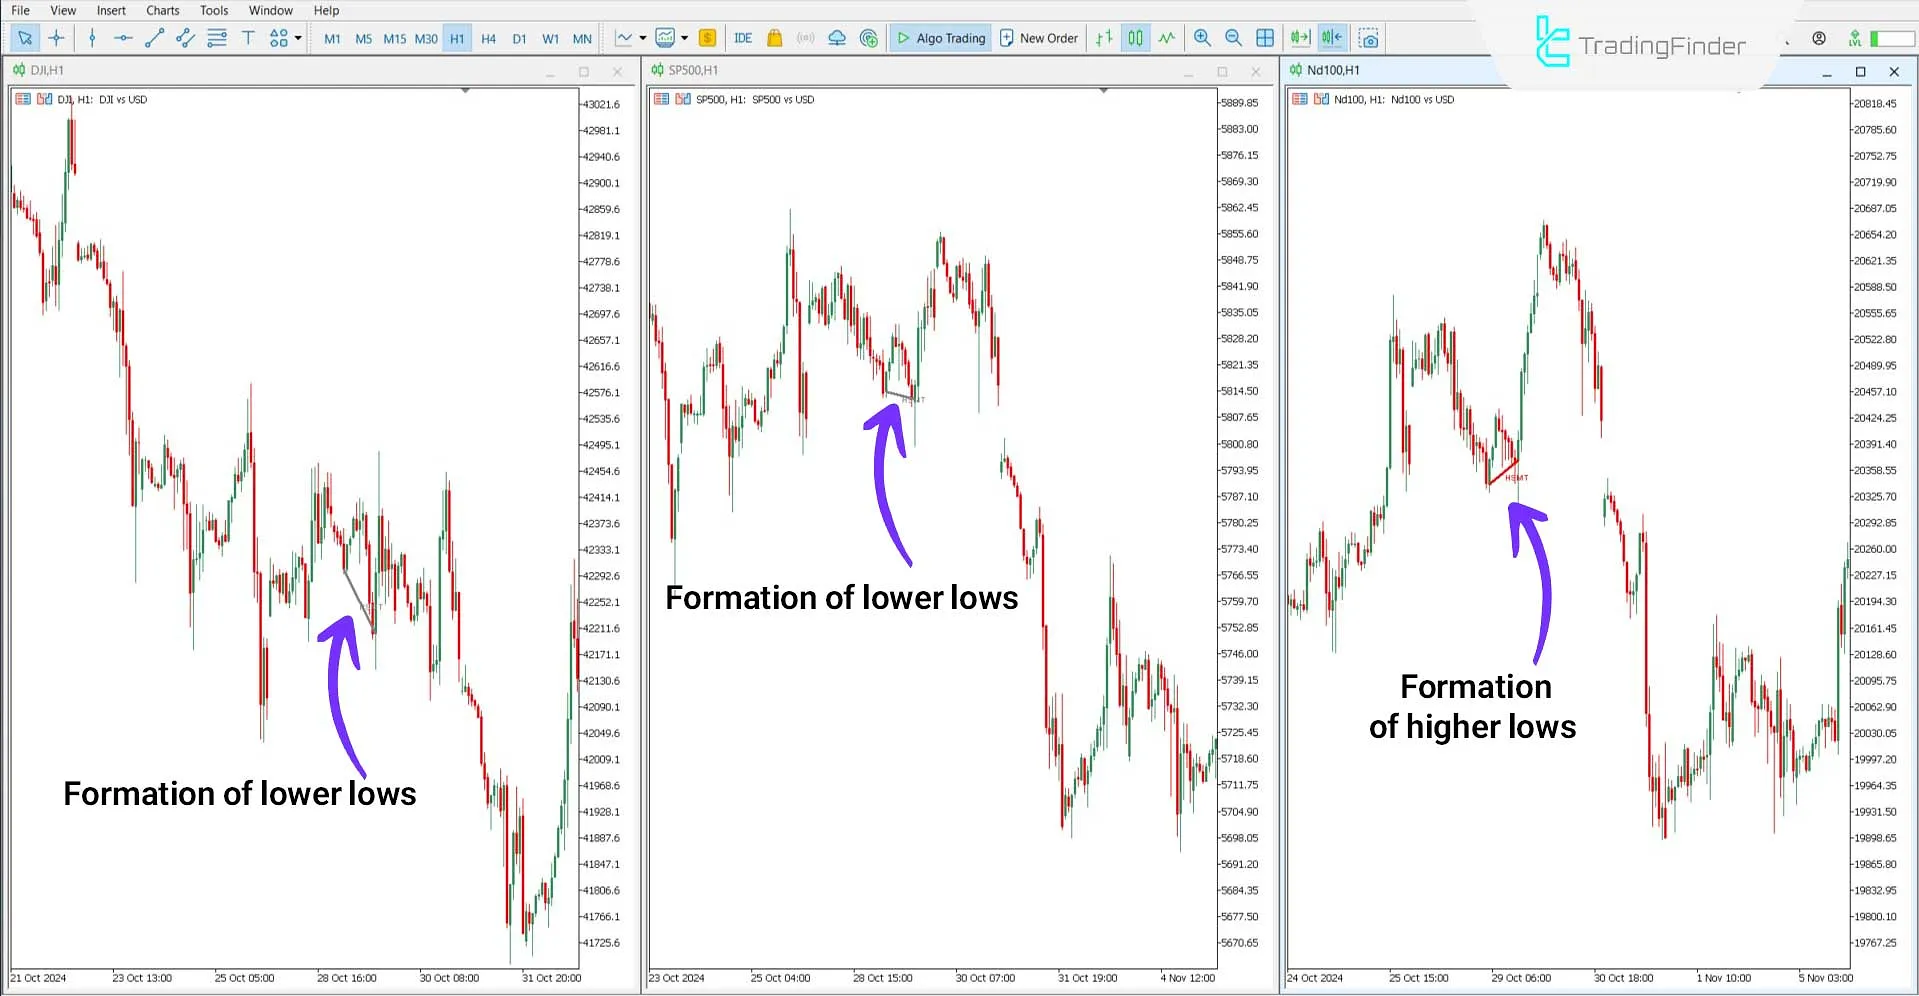
Analysis of DJI, SP500, and ND100 on a 1-hour chart shows that the Hidden SMT Divergence Indicator successfully detects and plots divergences among these three trading instruments.
According to the chart, both DJI and SP500 recorded lower lows simultaneously, while ND100 displayed higher lows at that moment, indicating a divergence.

Bearish Trend
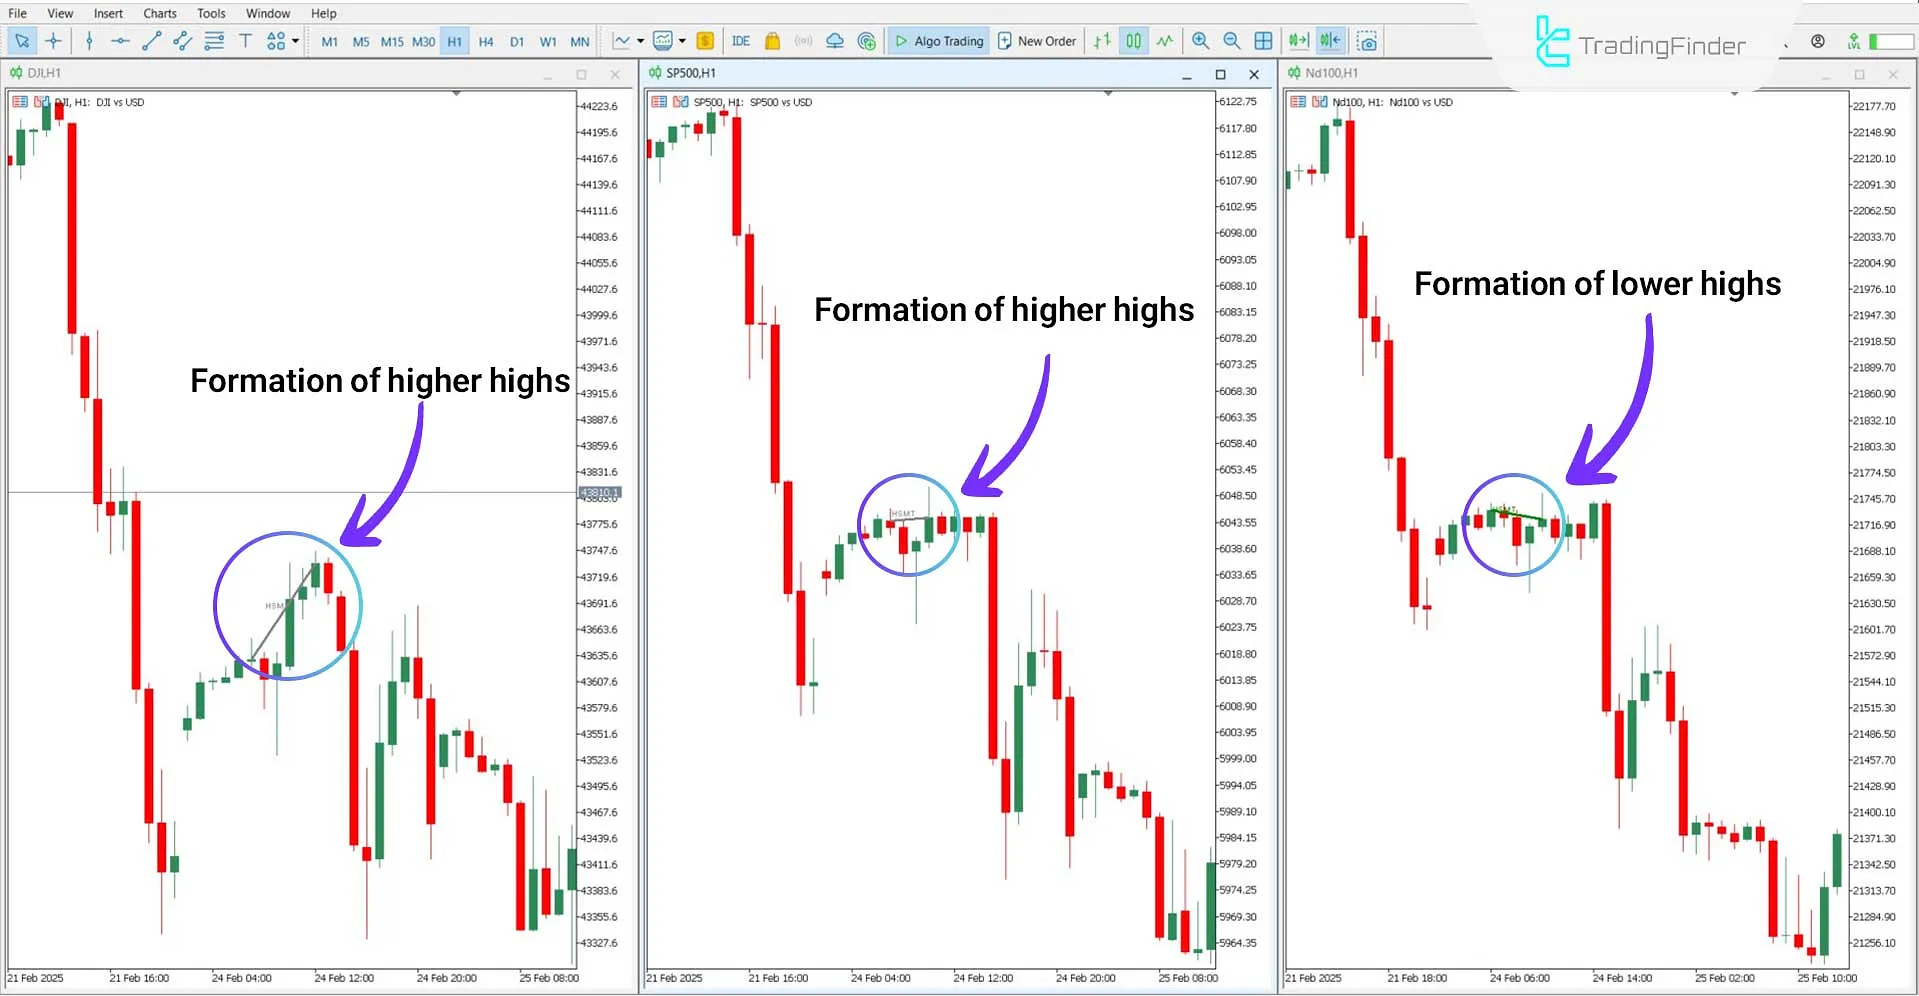
Based on one-hour chart data for the DJI, SP500, and ND100 indices, the DJI and SP500 indices formed higher highs at a certain level.
However, in contrast, ND100 plotted lower highs, indicating potential weakness in the bullish trend.

Hidden SMT Divergence Indicator Settings
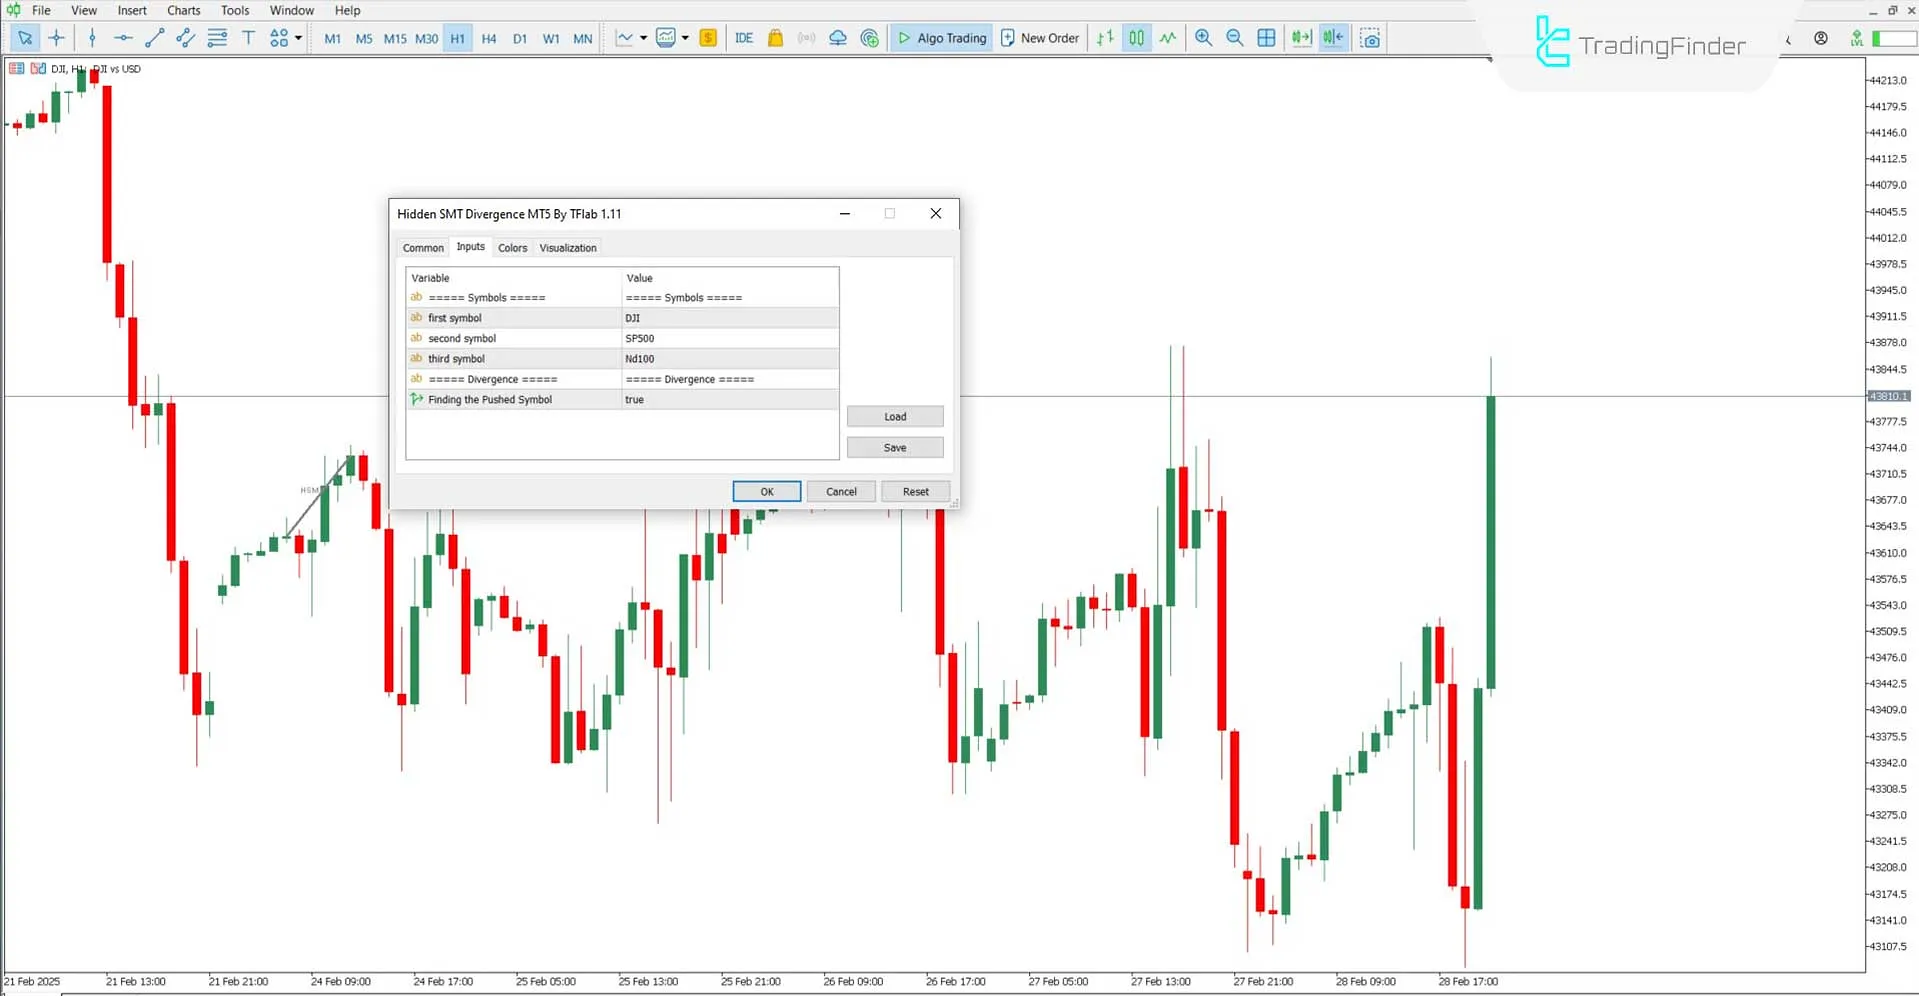
The following image represents the adjustable settings of the Hidden Smart Money Divergence Indicator:

- First Symbol: Assigns the first trading instrument
- Second Symbol: Defines the second asset
- Third Symbol: Select the third instrument
- Finding the Pushed Symbol: Activates automatic detection of the affected asset
Conclusion
Using plotted lines, the Hidden SMT Divergence Indicator detects and plots divergences between trading instruments, such as DJI, SP500, and ND100.
This trading tool analyzes highs and lows across three instruments, visualizing their movement differences. Before using the ICT indicator, it is important to apply it first to the chart of the First Symbol.
Hidden SMT Divergence MT5 PDF
Hidden SMT Divergence MT5 PDF
Click to download Hidden SMT Divergence MT5 PDFWhat is the Hidden SMT Divergence Indicator?
It is an MT5 indicator that identifies differences between trading instruments. It shows which assets confirm the trend and which are weaker in movement.
Is this indicator suitable for beginner traders?
No, this indicator is designed for advanced traders using liquidity-based strategies such as Smart Money and ICT concepts.


