![HighLow Custom Indicator for MetaTrader 5 – Free Download [TradingFinder]](https://cdn.tradingfinder.com/image/543987/2-146-en-high-low-custom-mt5-1.webp)
![HighLow Custom Indicator for MetaTrader 5 – Free Download [TradingFinder] 0](https://cdn.tradingfinder.com/image/543987/2-146-en-high-low-custom-mt5-1.webp)
![HighLow Custom Indicator for MetaTrader 5 – Free Download [TradingFinder] 1](https://cdn.tradingfinder.com/image/543974/2-146-en-high-low-custom-mt5-2.webp)
![HighLow Custom Indicator for MetaTrader 5 – Free Download [TradingFinder] 2](https://cdn.tradingfinder.com/image/543985/2-146-en-high-low-custom-mt5-3.webp)
![HighLow Custom Indicator for MetaTrader 5 – Free Download [TradingFinder] 3](https://cdn.tradingfinder.com/image/543986/2-146-en-high-low-custom-mt5-4.webp)
The HighLow Custom Indicator is one of the important tools in technical analysis, operating based on the connection of recent market highs and lows.
This trading tool creates an organized framework that enables precise examination of price behavior at key areas and is used to identify reversal zones and detect breakout levels.
In addition, this process is carried out through three analytical bands, each playing a specific role in evaluating market trends.
HighLow Custom Indicator Table
The table below presents the main features of the HighLow Custom Indicator.
Indicator Categories: | Support & Resistance MT5 Indicators Trading Assist MT5 Indicators Bands & Channels MT5 Indicators |
Platforms: | MetaTrader 5 Indicators |
Trading Skills: | Elementary |
Indicator Types: | Breakout MT5 Indicators Reversal MT5 Indicators |
Timeframe: | Multi-Timeframe MT5 Indicators |
Trading Style: | Intraday MT5 Indicators |
Trading Instruments: | Forex MT5 Indicators Crypto MT5 Indicators Stock MT5 Indicators |
HighLow Custom Indicator at a Glance
The HighLow Custom Indicator is composed of three main bands, each with a specific role in analyzing price behavior:
- Upper Band: Formed by connecting recent market highs and acting as dynamic resistance; this band displays the intensity of selling pressure in ceiling areas;
- Lower Band: Formed by connecting recent market lows and acting as dynamic support. This band reflects demand levels and the entry of buyers at lower price levels;
- Middle Band: Calculated as the average of price highs and lows, defining the market’s equilibrium level.
Indicator in an Uptrend
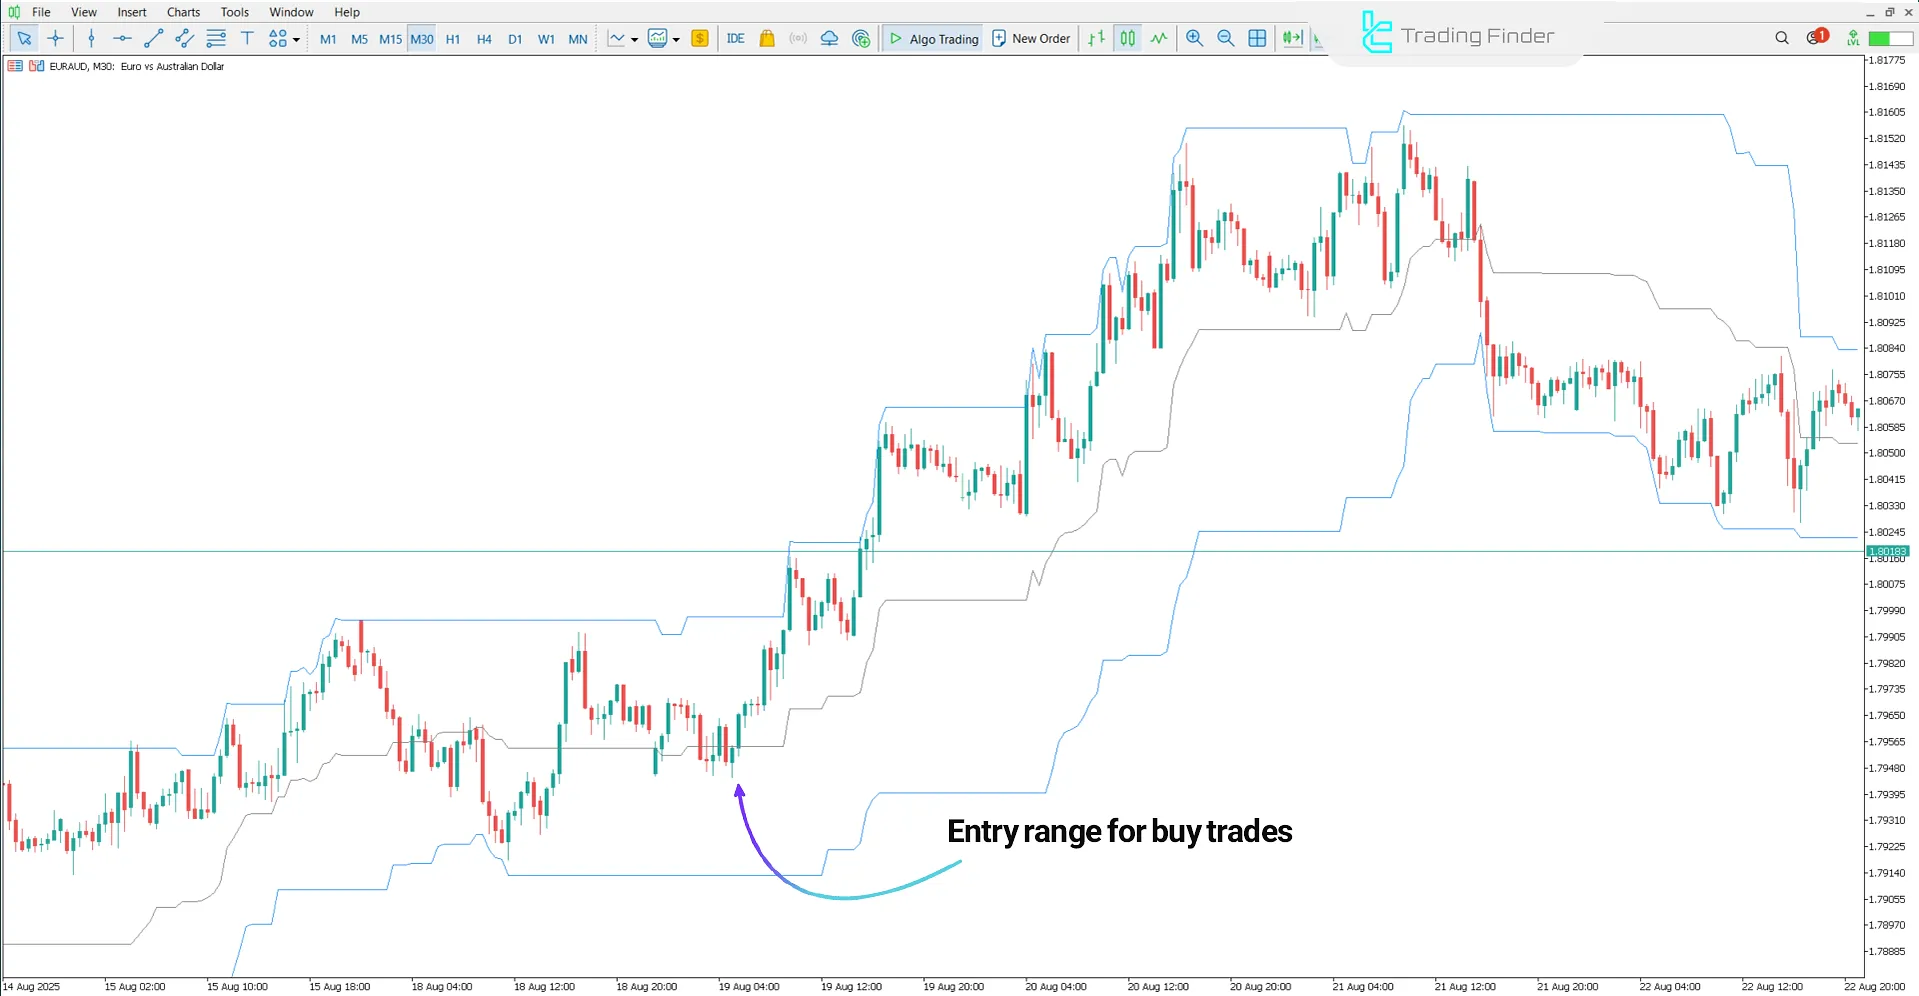
The price chart below shows the EUR/AUD currency pair in the 30-minute timeframe. The bullish reaction of price to the lower band and its stabilization above the middle band is a sign of strengthened buying flow.
This condition usually marks the beginning of a new upward movement and defines a valid zone for entering buy trades.

Indicator in a Downtrend
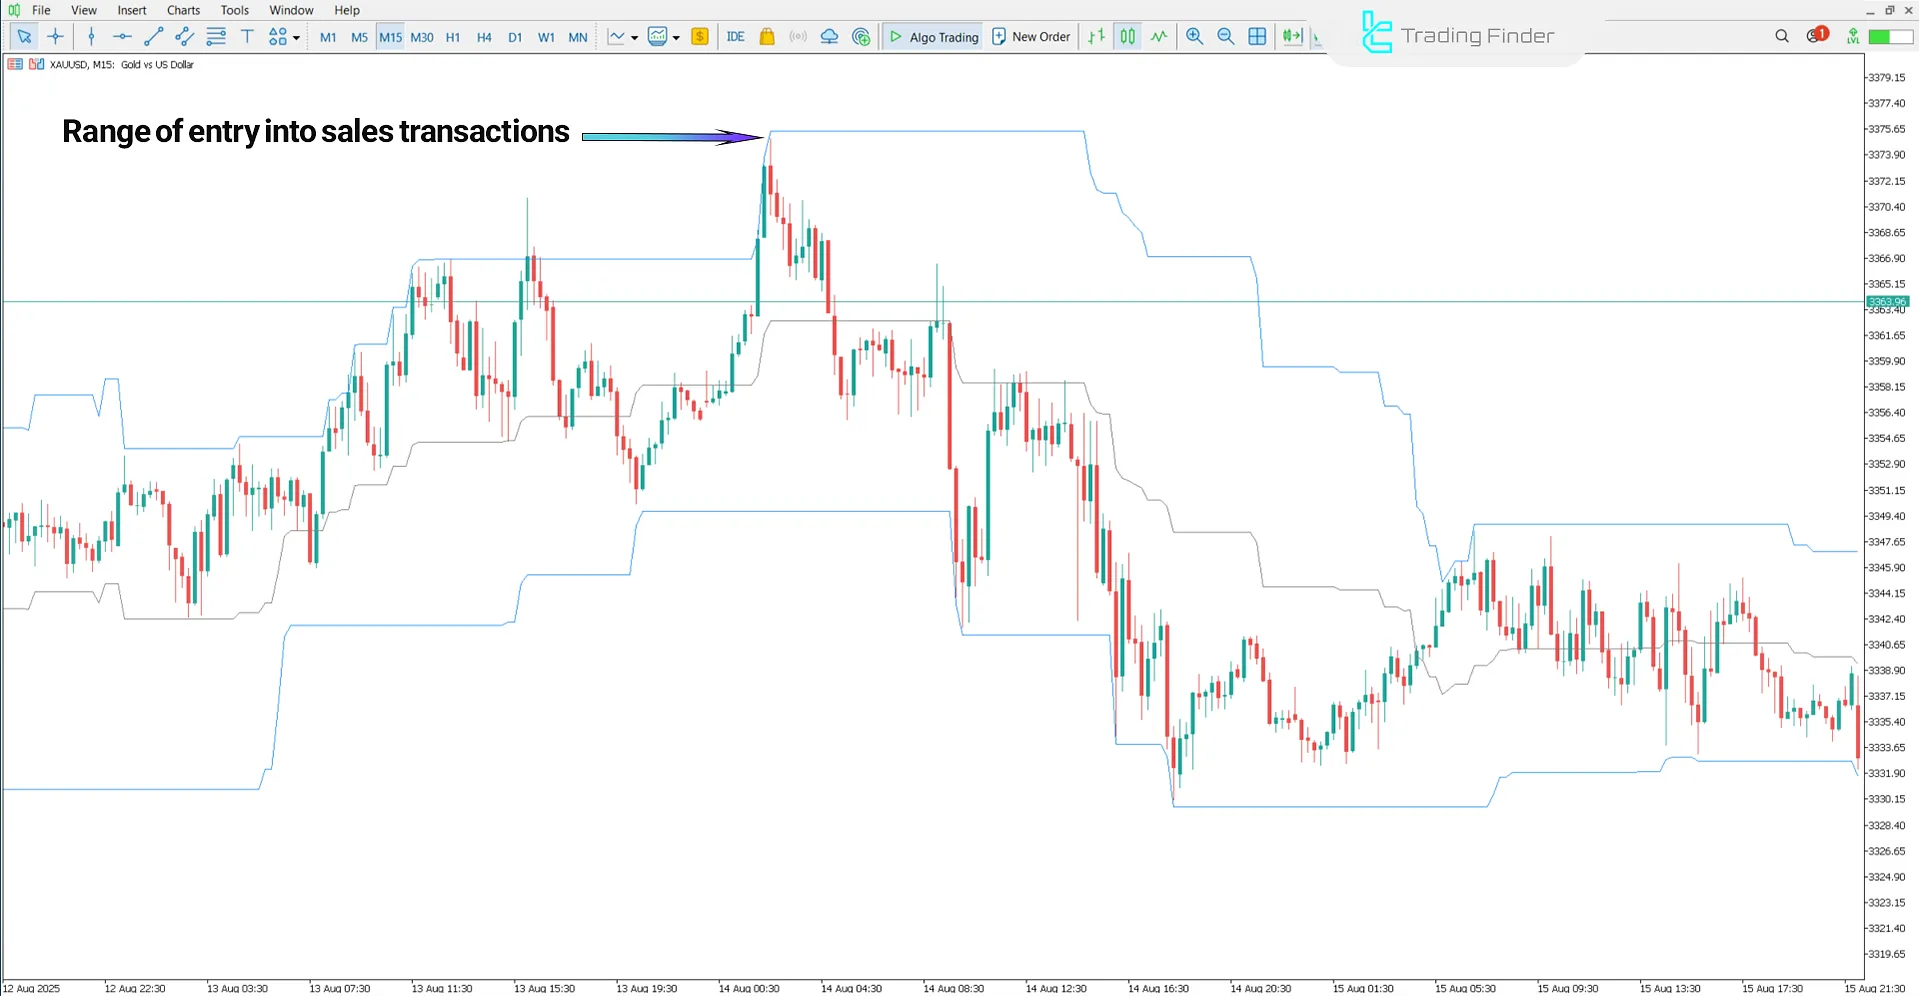
The price chart below shows the global gold index with the symbol (XAU/USD) in the 15-minute timeframe. In bearish conditions, when price touches the upper band, it acts as resistance and strengthens selling pressure.
When the price moves below the middle band and stabilizes there, it signals seller pressure and confirms the continuation of the downtrend.

HighLow Custom Indicator Settings
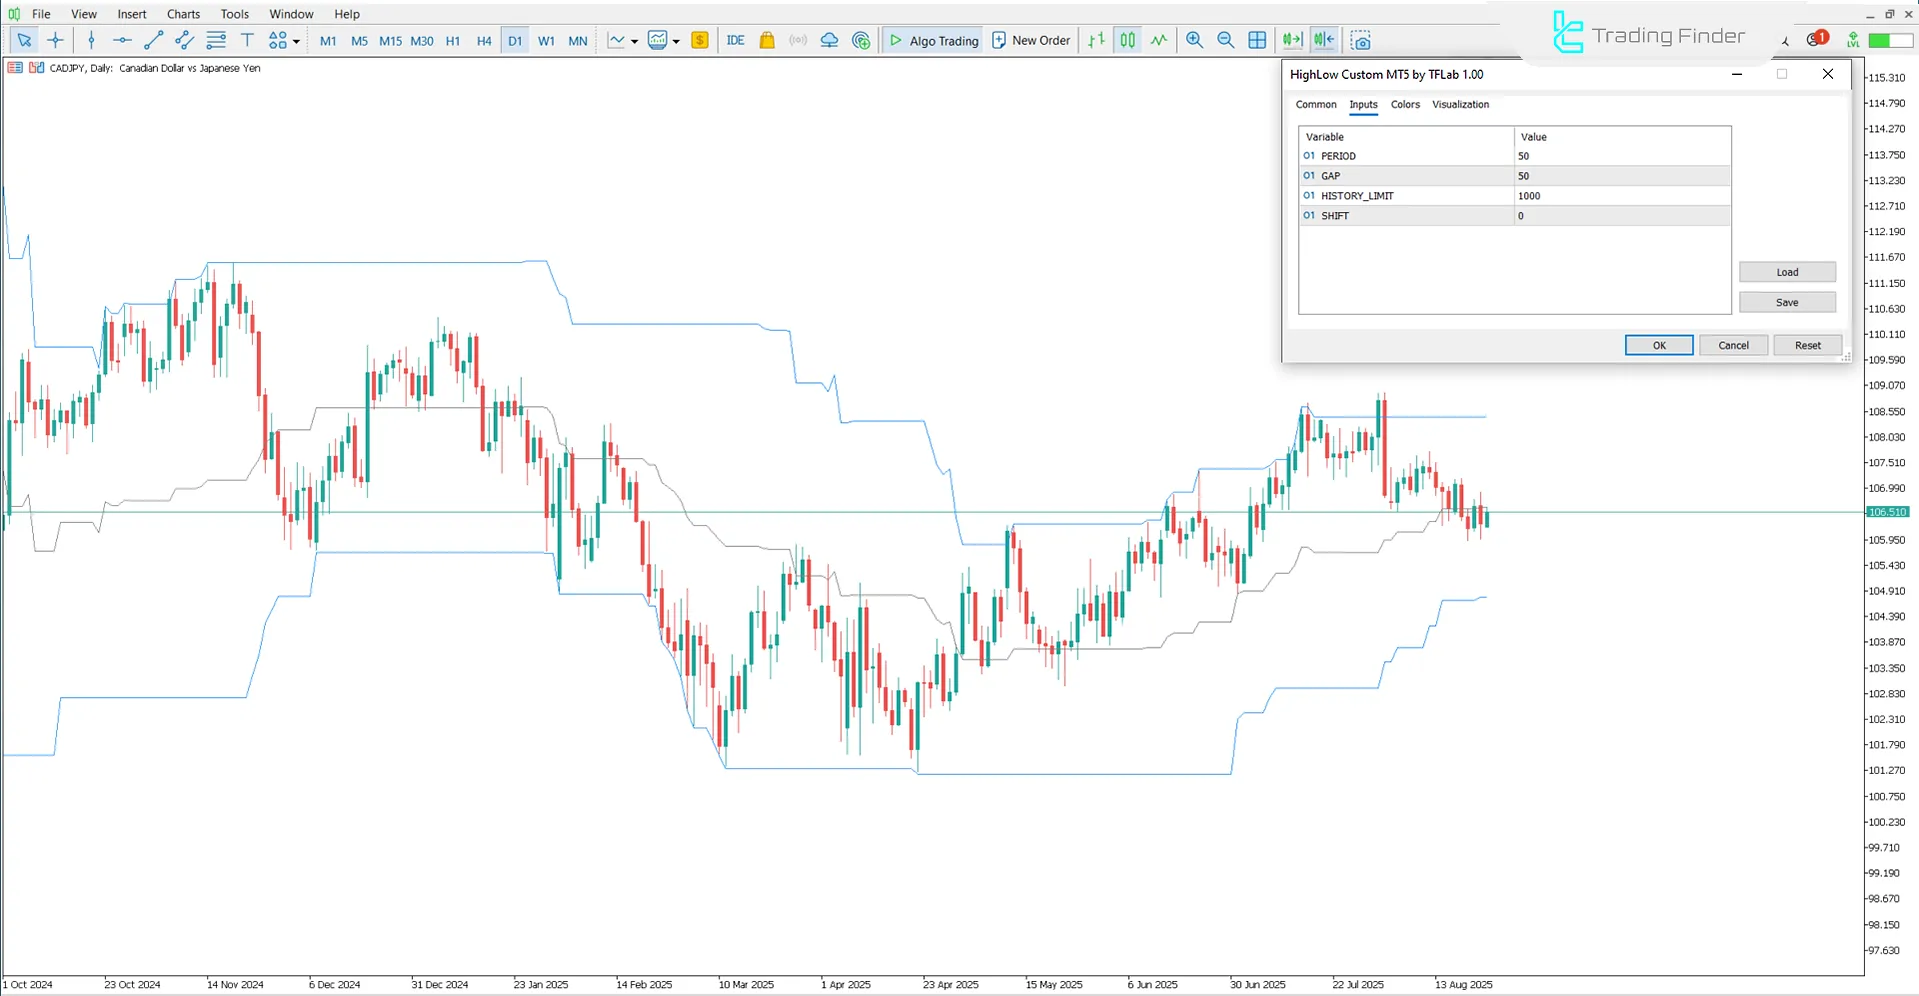
The image below shows the settings panel of the HighLow Custom Indicator in the MetaTrader 5 platform:

- PERIOD: Calculation period value
- GAP: Adjustable distance or gap between bands
- HISTORY_LIMIT: Maximum number of candles to analyze past data
- SHIFT: Amount of shift
Conclusion
The HighLow Custom Indicator belongs to the category of key technical analysis tools, aimed at evaluating market structure based on price highs and lows.
This trading tool, by drawing dynamic lines, defines the role of variable support and resistance levels and provides a precise basis for analyzing trends and price changes.
HighLow Custom Indicator MetaTrader 5 PDF
HighLow Custom Indicator MetaTrader 5 PDF
Click to download HighLow Custom Indicator MetaTrader 5 PDFIn which markets can the HighLow Custom Indicator be applied?
This trading tool can be used in all markets, including Forex, stocks, commodities, and even cryptocurrencies.
What is the best timeframe for using the HighLow Custom Indicator?
This indicator has a multi-timeframe nature and can be applied across short-term to long-term intervals.


