![Horn Pattern Indicator for MetaTrader 5 Download - Free - [Trading Finder]](https://cdn.tradingfinder.com/image/108645/11-35-en-horn-pattern-mt5.webp)
![Horn Pattern Indicator for MetaTrader 5 Download - Free - [Trading Finder] 0](https://cdn.tradingfinder.com/image/108645/11-35-en-horn-pattern-mt5.webp)
![Horn Pattern Indicator for MetaTrader 5 Download - Free - [Trading Finder] 1](https://cdn.tradingfinder.com/image/42572/11-35-en-horn-pattern-mt5-02.avif)
![Horn Pattern Indicator for MetaTrader 5 Download - Free - [Trading Finder] 2](https://cdn.tradingfinder.com/image/42585/11-35-en-horn-pattern-mt5-03.avif)
![Horn Pattern Indicator for MetaTrader 5 Download - Free - [Trading Finder] 3](https://cdn.tradingfinder.com/image/42588/11-35-en-horn-pattern-mt5-04.avif)
The Horn Pattern Indicator is one of the MetaTrader 5 indicators that automatically identifies the Horn Pattern (Expanding Triangle), one of the frequently repeated patterns in technical analysis, on the price chart without requiring manual review.
This pattern consists of two blue lines that diverge from each other. If the price breaks one of these lines, the future trend direction becomes predictable. Traders often use this pattern as a reversal pattern.
Horn Pattern Indicator Table
Indicator Categories: | Trading Assist MT5 Indicators Chart & Classic MT5 Indicators Bands & Channels MT5 Indicators |
Platforms: | MetaTrader 5 Indicators |
Trading Skills: | Elementary |
Indicator Types: | Breakout MT5 Indicators Reversal MT5 Indicators |
Timeframe: | Multi-Timeframe MT5 Indicators |
Trading Style: | Swing Trading MT5 Indicators Scalper MT5 Indicators Day Trading MT5 Indicators Fast Scalper MT5 Indicators |
Trading Instruments: | Forex MT5 Indicators Crypto MT5 Indicators Stock MT5 Indicators Commodity MT5 Indicators Indices MT5 Indicators Forward MT5 Indicators Share Stock MT5 Indicators |
Horn Pattern Indicator at a Glance
The Horn Pattern Indicator (Expanding Triangle) is highly useful for detecting the Horn Pattern in price charts. This trading tool connects the last three highs and lows at the end of trends using two lines that diverge, indicating the entry of large volumes of buyers or sellers. After forming the Horn Pattern, there is a chance of a trend reversal.
Sell Conditions of the Horn Pattern Indicator
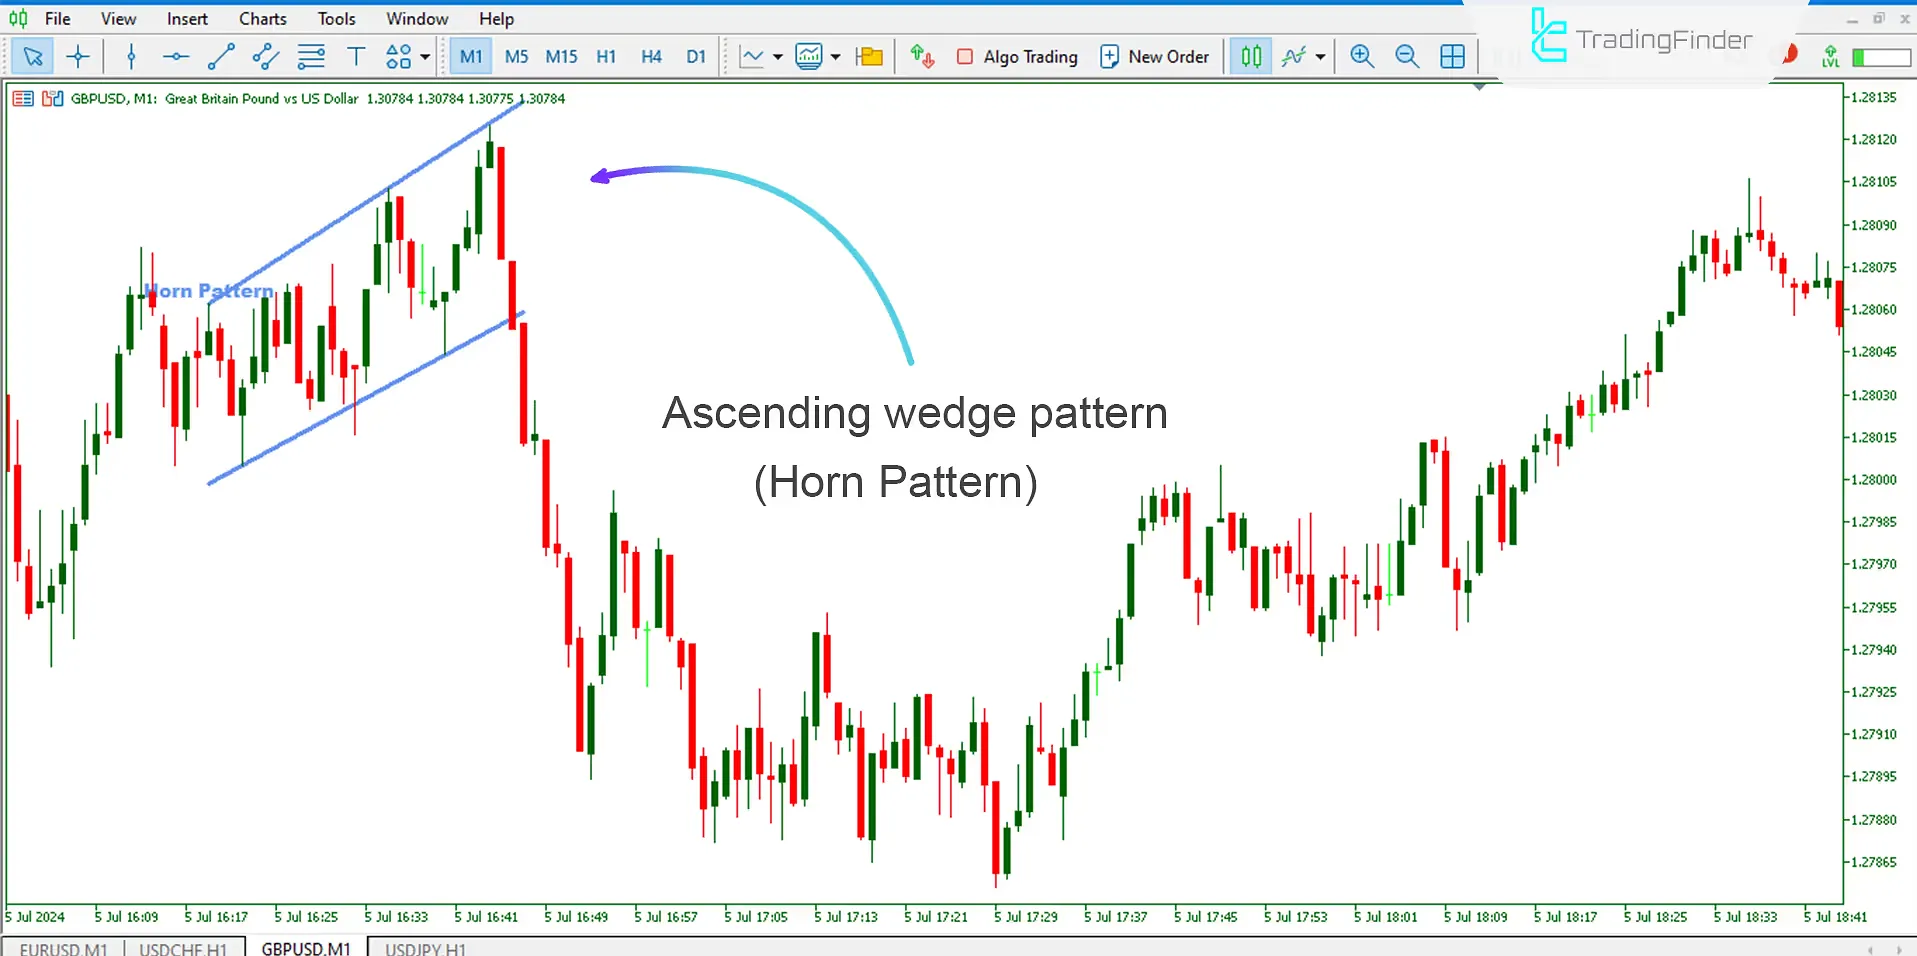
In the image below, the Horn Top Pattern has formed at the end of an uptrend in the 1-minute GBP/USD chart. After the lower line of the pattern is broken, traders can enter sell orders. The stop loss can be placed at the highest point of the pattern, and the take profit can be set at a distance equal to the depth of the pattern (the distance between the lowest and highest price).

Buy Conditions of the Horn Pattern Indicator
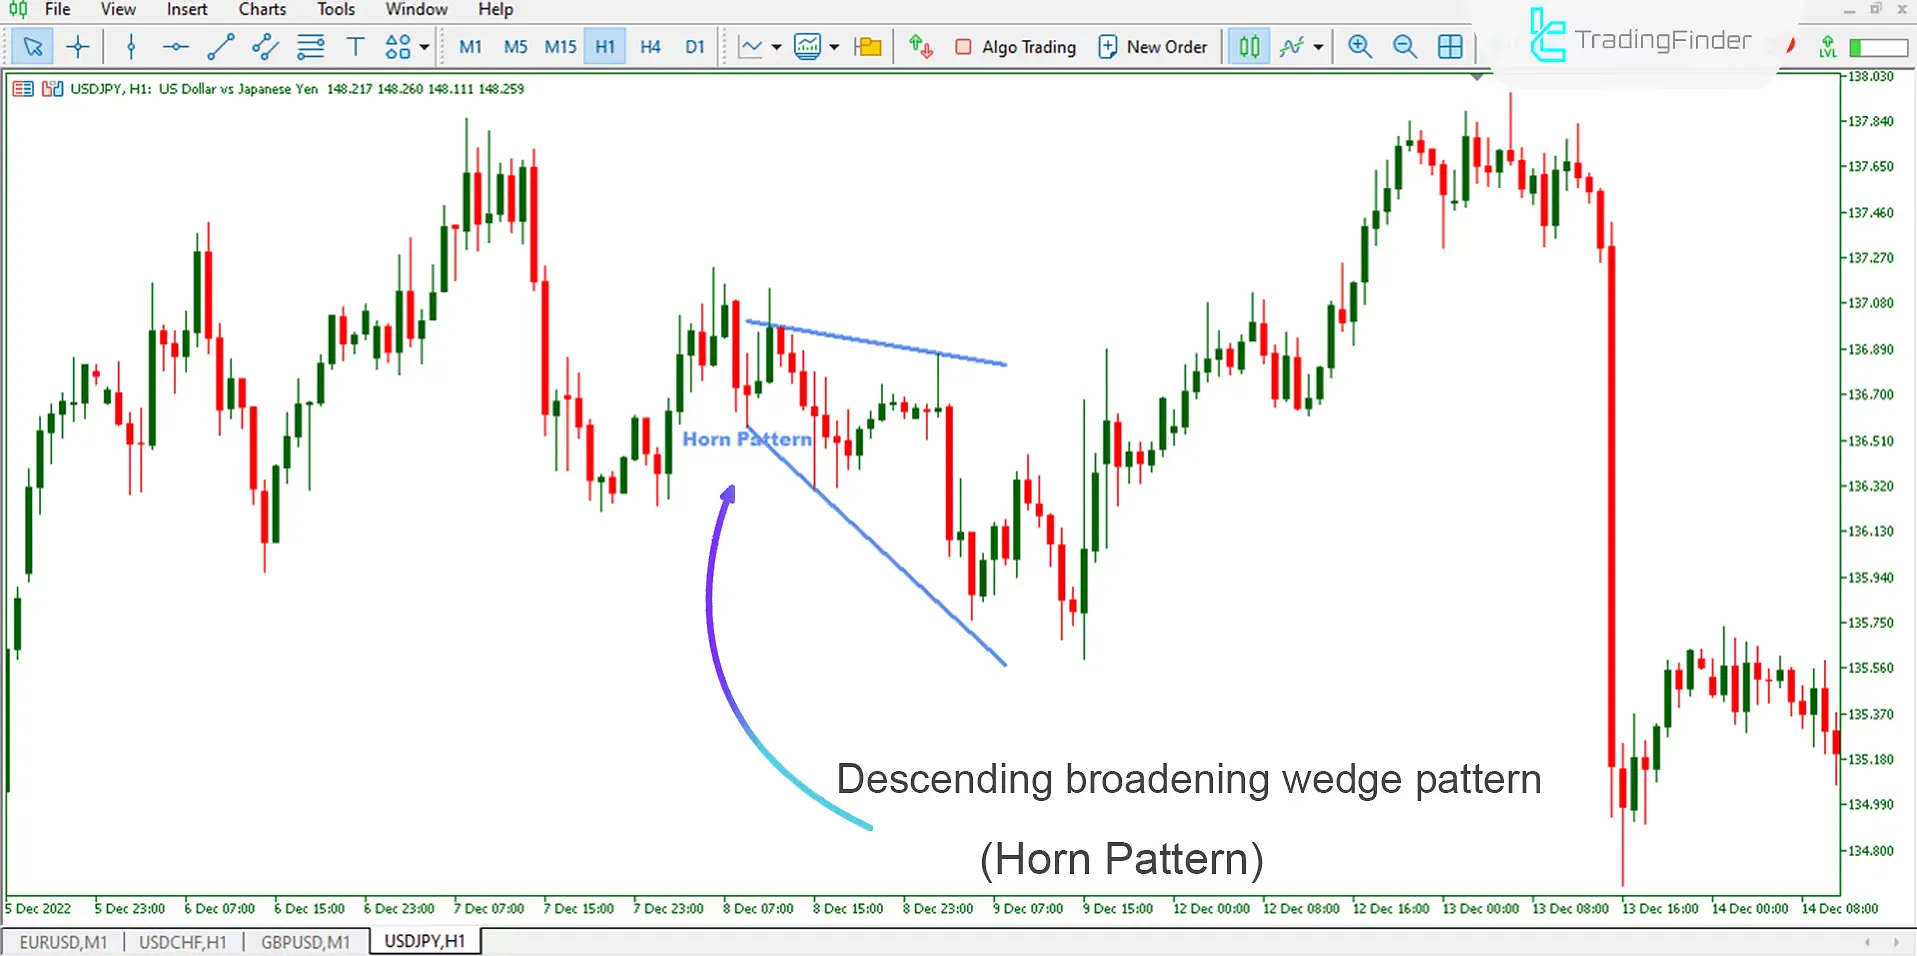
In the image below, the Horn Bottom Pattern has formed at the end of a downtrend in the 1-hour USD/JPY chart. After the upper line of the pattern is broken, traders can enter buy orders.

Horn Pattern Indicator Settings

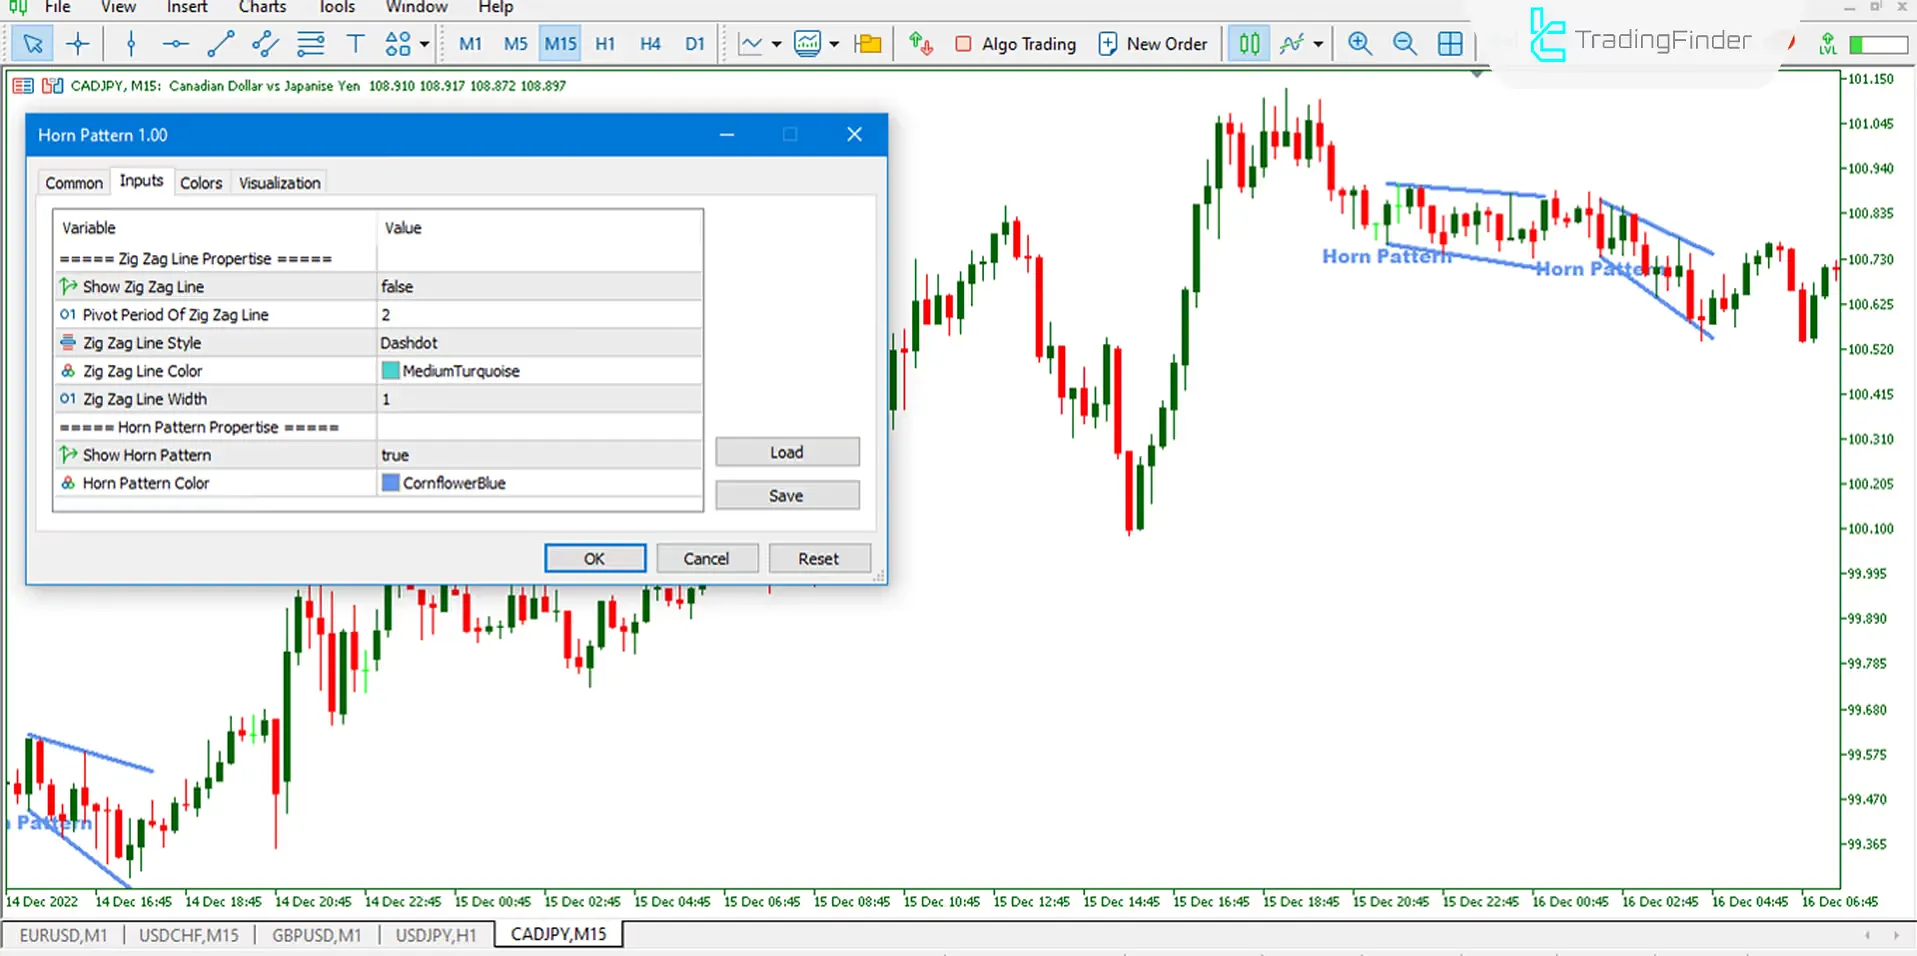
- Properties: Properties of the Zig Zag Line
- Show Zig Zag Line: Set to true to display the Zig Zag Line
- Pivot Period of Zig Zag Line: The period for the Zig Zag Line is set to 2
- Zig Zag Line Style: Display the Zig Zag Line as a dash-dot
- Zig Zag Line Color: The color of the Zig Zag Line is blue (customizable)
- Zig Zag Line Width: The width of the Zig Zag Line is 1
- Horn Pattern Properties: Properties of the Horn Pattern
- Show Horn Pattern: Set to true to display the pattern
- Horn Pattern Color: The color of the Horn Pattern is dark blue
Conclusion
The Horn Pattern Indicator is one of the commonly used patterns in technical analysis. This Chart and Classic pattern indicator automatically detects and displays reliable patterns on the price chart for traders.
To select reliable patterns, traders can use other analytical tools like regular divergences (RD) and support and resistance levels.
Horn Pattern MT5 PDF
Horn Pattern MT5 PDF
Click to download Horn Pattern MT5 PDFCan the Horn Pattern Indicator be used in all timeframes?
Yes, but it is recommended that the indicator be used on higher timeframes to avoid mistakes on lower timeframes.
How can I use the Horn Pattern Indicator in trading?
You can enter trades based on the Horn Pattern by waiting for the price to break the upper or lower line of the pattern.


