![Ichimoku Support Resistance AD Indicator MT5 Download – Free – [TradingFinder]](https://cdn.tradingfinder.com/image/439839/13-154-en-ichimoku-support-resistance-ad-mt5-01.webp)
![Ichimoku Support Resistance AD Indicator MT5 Download – Free – [TradingFinder] 0](https://cdn.tradingfinder.com/image/439839/13-154-en-ichimoku-support-resistance-ad-mt5-01.webp)
![Ichimoku Support Resistance AD Indicator MT5 Download – Free – [TradingFinder] 1](https://cdn.tradingfinder.com/image/439850/13-154-en-ichimoku-support-resistance-ad-mt5-02.webp)
![Ichimoku Support Resistance AD Indicator MT5 Download – Free – [TradingFinder] 2](https://cdn.tradingfinder.com/image/439861/13-154-en-ichimoku-support-resistance-ad-mt5-03.webp)
![Ichimoku Support Resistance AD Indicator MT5 Download – Free – [TradingFinder] 3](https://cdn.tradingfinder.com/image/439872/13-154-en-ichimoku-support-resistance-ad-mt5-04.webp)
TheIchimoku Support and Resistance AD Indicator accurately identifies key market levels using technical analysis concepts, including the Ichimoku system and fractal points.
This tool automatically displays support lines in blue and resistance lines in red on the chart. One of its practical features is the visual display of fractal points to better analyze price movements.
Specifications Table Ichimoku Support and Resistance AD Indicator
The features of the Ichimoku Support Resistance AD Indicator are summarized in the table below:
Indicator Categories: | Support & Resistance MT5 Indicators Trading Assist MT5 Indicators Levels MT5 Indicators |
Platforms: | MetaTrader 5 Indicators |
Trading Skills: | Elementary |
Indicator Types: | Reversal MT5 Indicators |
Timeframe: | Multi-Timeframe MT5 Indicators |
Trading Style: | Swing Trading MT5 Indicators Scalper MT5 Indicators Day Trading MT5 Indicators |
Trading Instruments: | Forex MT5 Indicators Crypto MT5 Indicators Stock MT5 Indicators Commodity MT5 Indicators Indices MT5 Indicators Share Stock MT5 Indicators |
Overview of the Ichimoku Support and Resistance AD Indicator
TheIchimoku AD Support and Resistance Levels Indicator, by combining Ichimoku for trend direction and fractals for identifying reversal points, offers a precise and comprehensive market condition analysis.
When support or resistance levels are broken in the trend direction, the tool provides a suitable opportunity to enter trades.
Uptrend Conditions
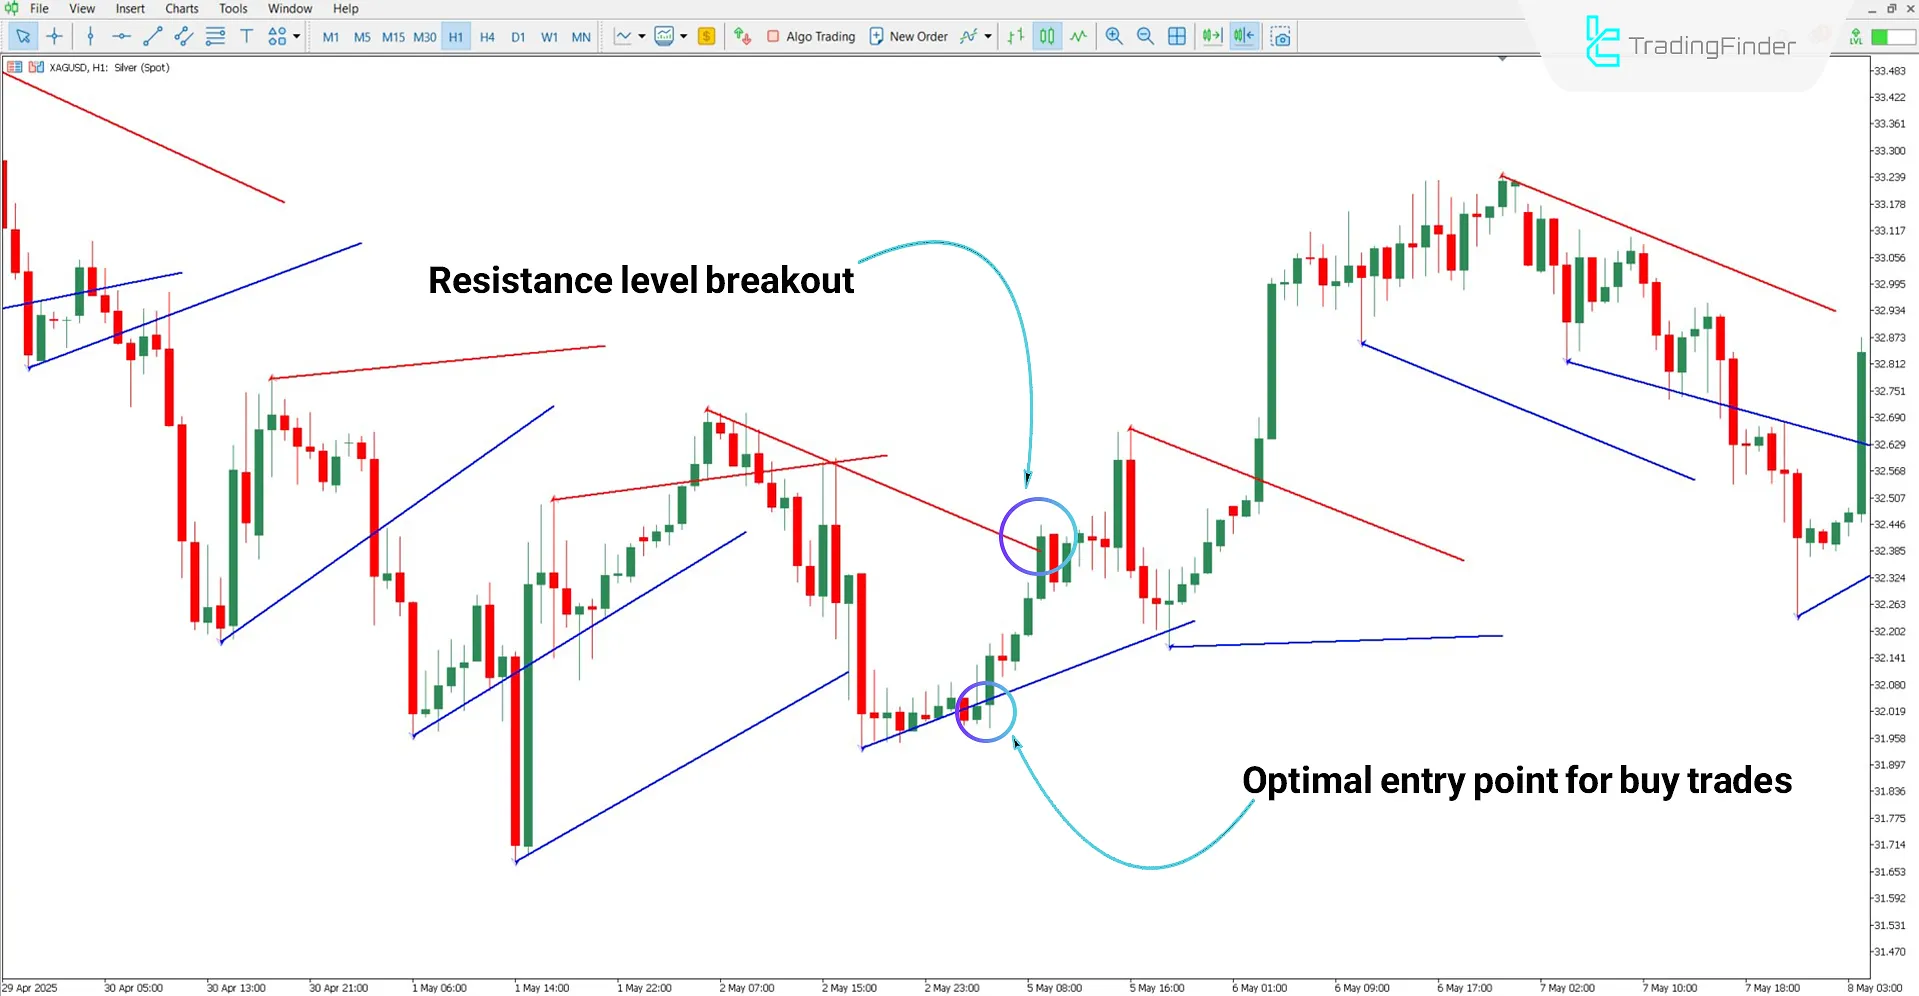
According to the analysis of thesilver vs. US dollar (XAG/USD) chart on the 1-hour timeframe, the price turns bullish after retesting the supportlevel and also breaks the resistancelevel.
Under such conditions, based on initial interactions with the market bias or after the trend forms, buy positions can be entered during future interactions with support levels.

Downtrend Conditions
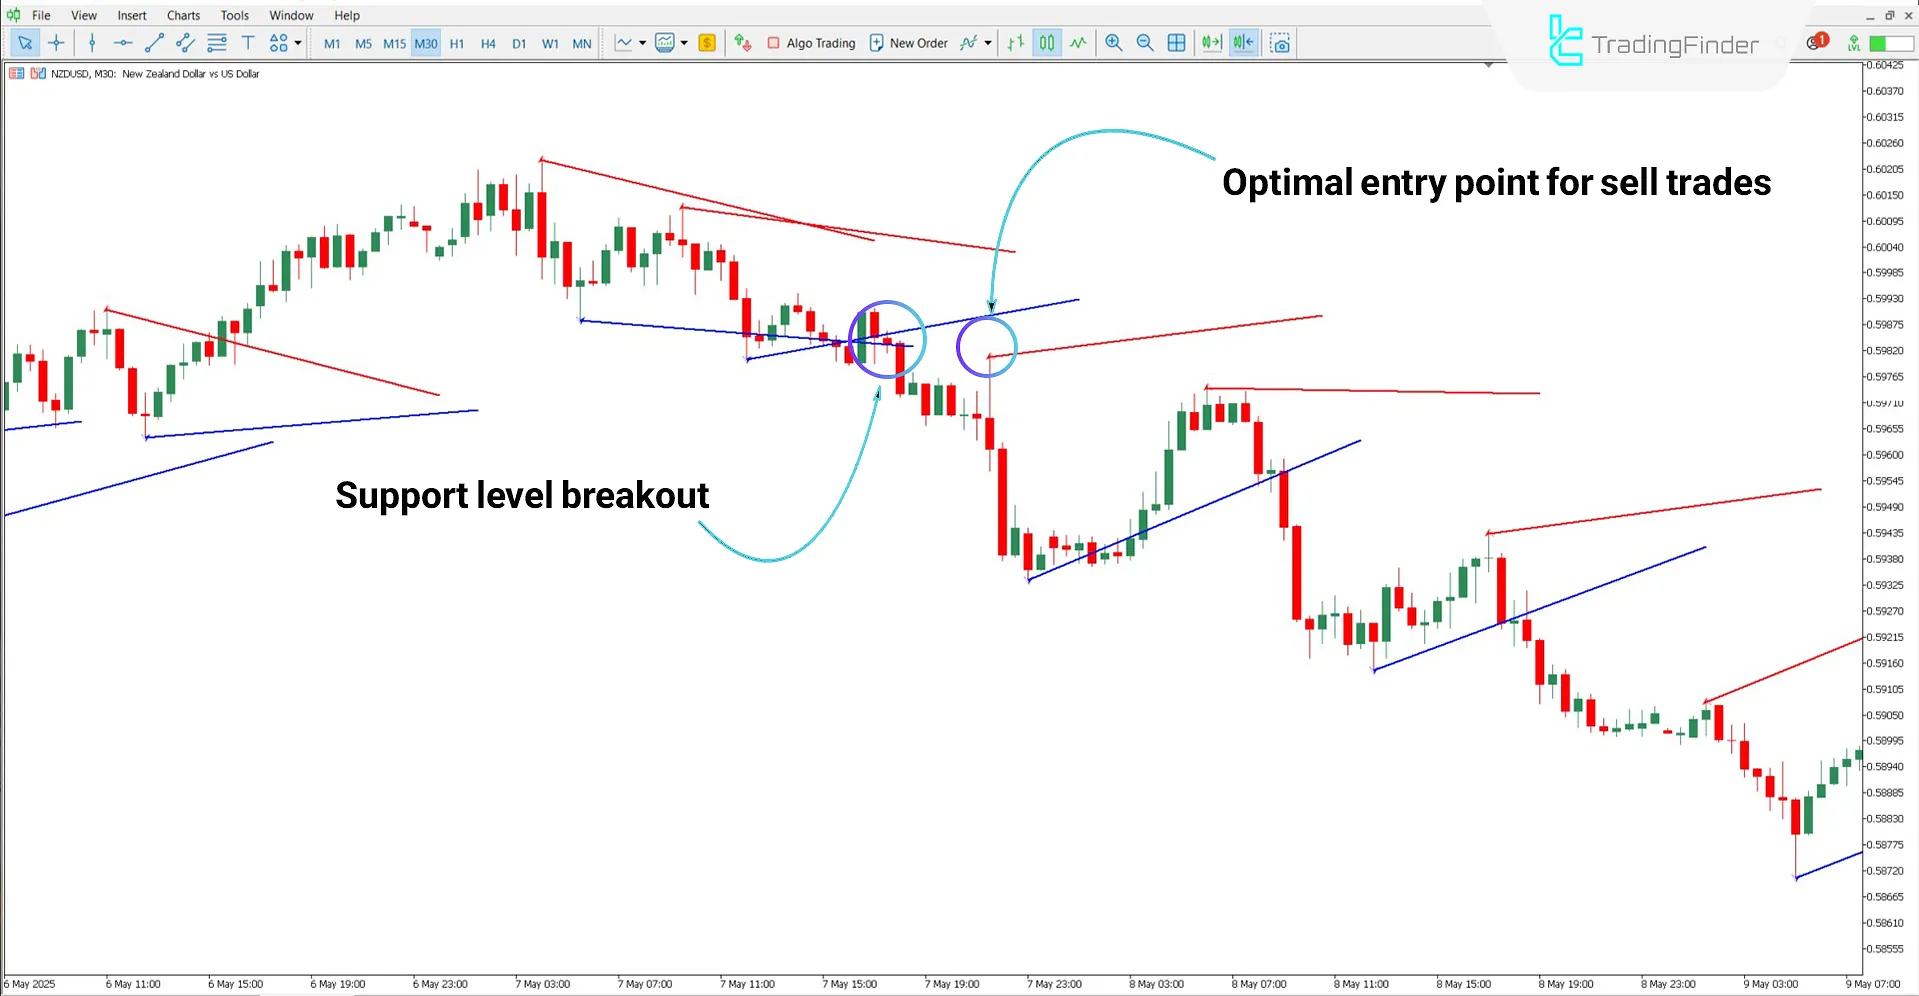
Based on the30-minute chart analysis of the NZD/USD currency pair, the price, after multiple contacts with the supportlevel, eventually breaks it.
In such situations, a price pullback to the broken point typically provides a good opportunity to enter sell trades.

Settings Ichimoku Support and Resistance AD Indicator
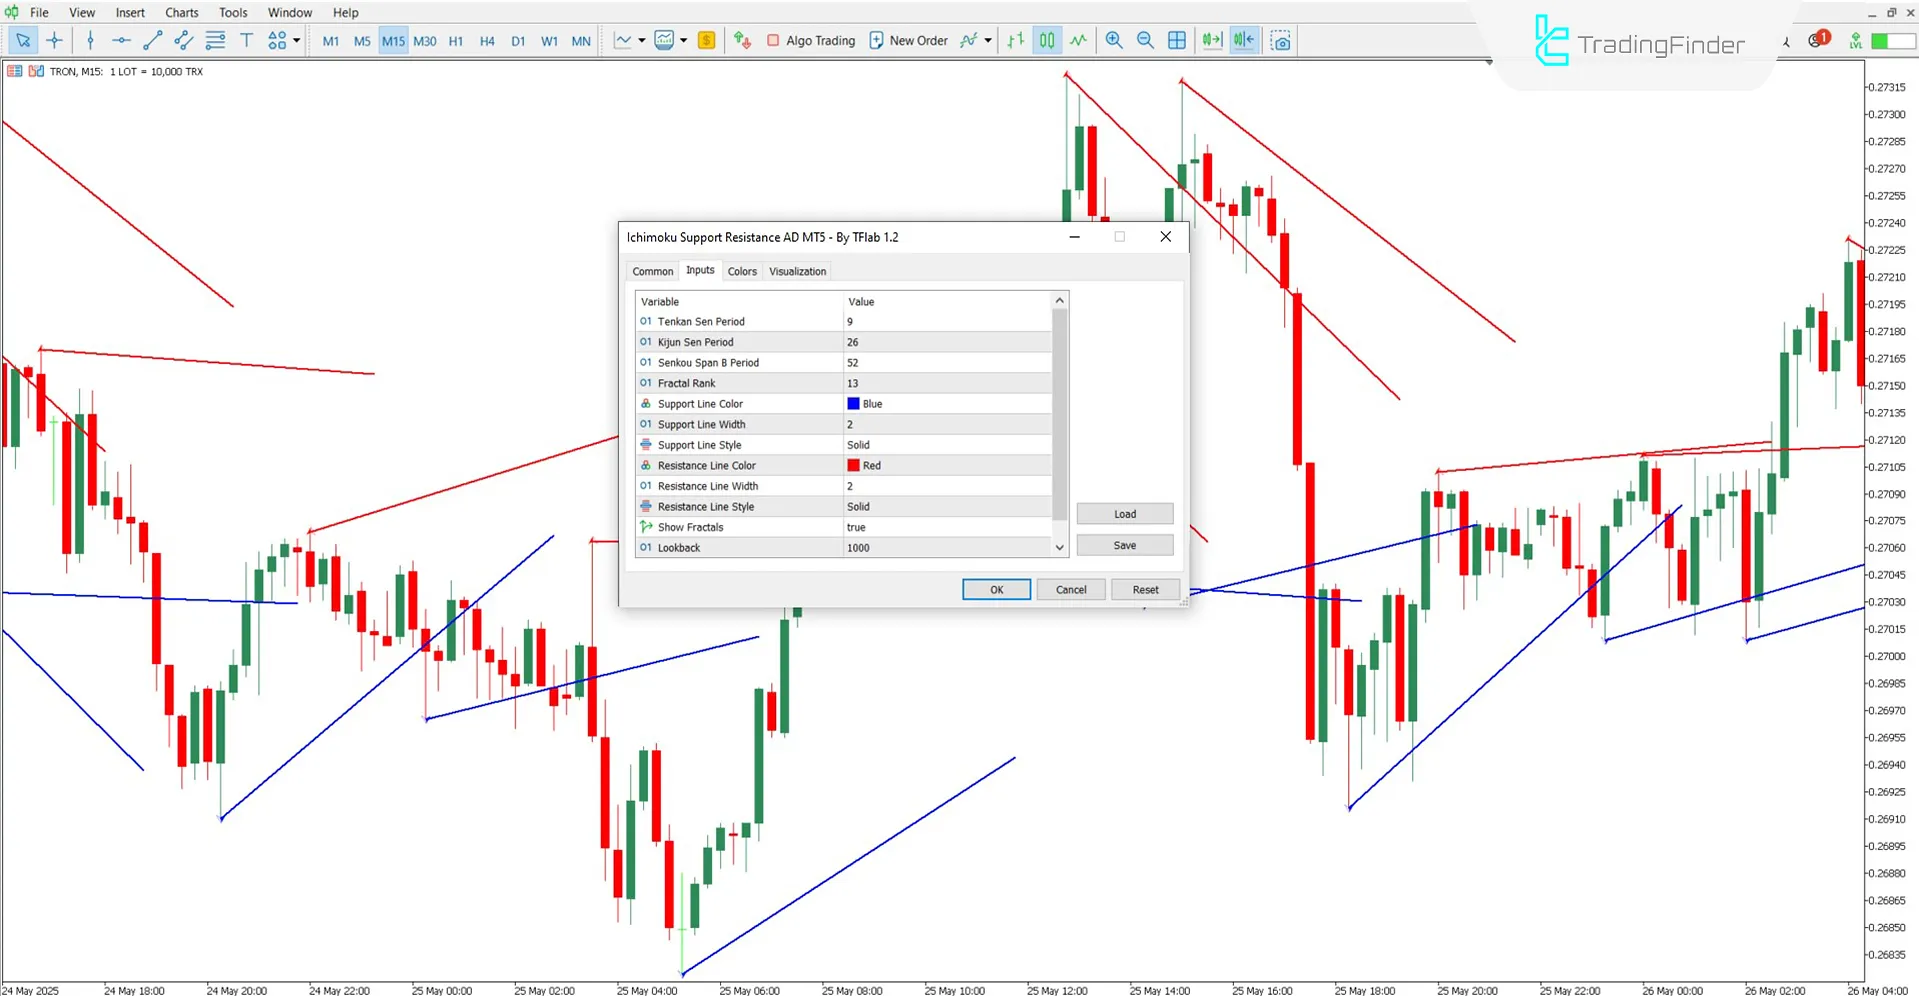
The following image shows the settings panel for the Ichimoku Support Resistance AD indicator:

- Tenkan-sen period: Calculation period for the Tenkan-sen line
- Kijun-sen period: Calculation period for the Kijun-sen line
- Senkou Span B period: Calculation period for the Senkou Span B line
- Fractal rank: Sensitivity level for fractal detection
- Color of support lines: Support line color on the chart
- Style of support lines: Support line style
- Thickness of support lines: Support line thickness
- Color of resistance lines: Resistance line color on the chart
- Style of resistance lines: Resistance line style
- Thickness of resistance lines: Resistance line thickness
- Show Fractals: Enable or disable fractal display
- Lookback: Number of candles to look back for indicator calculations
Conclusion
The Ichimoku AD Support and Resistance Levels Indicator, by integrating the Ichimokusystem and fractal based reversal structures, facilitates the identification of important price zones.
This trading tool automatically draws support and resistancelevels and provides a better understanding of price behavior during uptrends and downtrends.
Ichimoku Support Resistance AD MT5 PDF
Ichimoku Support Resistance AD MT5 PDF
Click to download Ichimoku Support Resistance AD MT5 PDFWhat do the line colors mean in this trading tool?
Blue lines represent support levels, while red lines indicate resistance levels.
What is the purpose of fractal points in this indicator?
These points help identify reversal zones and enhance the accuracy of the drawn levels.


