![ICT 2022 Mentorship Trading Model Indicator MT5 Download – Free – [TFlab]](https://cdn.tradingfinder.com/image/461868/13-167-en-ict-2022-mentorship-trading-model-mt5-01.webp)
![ICT 2022 Mentorship Trading Model Indicator MT5 Download – Free – [TFlab] 0](https://cdn.tradingfinder.com/image/461868/13-167-en-ict-2022-mentorship-trading-model-mt5-01.webp)
![ICT 2022 Mentorship Trading Model Indicator MT5 Download – Free – [TFlab] 1](https://cdn.tradingfinder.com/image/461876/13-167-en-ict-2022-mentorship-trading-model-mt5-02.webp)
![ICT 2022 Mentorship Trading Model Indicator MT5 Download – Free – [TFlab] 2](https://cdn.tradingfinder.com/image/461874/13-167-en-ict-2022-mentorship-trading-model-mt5-03.webp)
![ICT 2022 Mentorship Trading Model Indicator MT5 Download – Free – [TFlab] 3](https://cdn.tradingfinder.com/image/461875/13-167-en-ict-2022-mentorship-trading-model-mt5-04.webp)
The ICT 2022 Mentorship Trading Model Indicator is developed based on the ICT style analysis method. This indicator identifies market structural patterns, liquidity zones, and trade setups within the framework of displacement and fair value gaps (FVGs).
Moreover, when a price level is broken by a powerful candle and the price returns to the fair value gap, the tool issues a trade entry signal using directional arrows.
ICT 2022 Mentorship Trading Model Indicator Specifications Table
The following table outlines the specifications of the ICT 2022 Mentorship Trading Model Indicator.
Indicator Categories: | Signal & Forecast MT5 Indicators Liquidity Indicators MT5 Indicators ICT MT5 Indicators |
Platforms: | MetaTrader 5 Indicators |
Trading Skills: | Advanced |
Indicator Types: | Breakout MT5 Indicators Reversal MT5 Indicators |
Timeframe: | Multi-Timeframe MT5 Indicators |
Trading Style: | Swing Trading MT5 Indicators Scalper MT5 Indicators Day Trading MT5 Indicators |
Trading Instruments: | Forex MT5 Indicators Crypto MT5 Indicators Stock MT5 Indicators |
ICT 2022 Mentorship Trading Model Indicator at a Glance
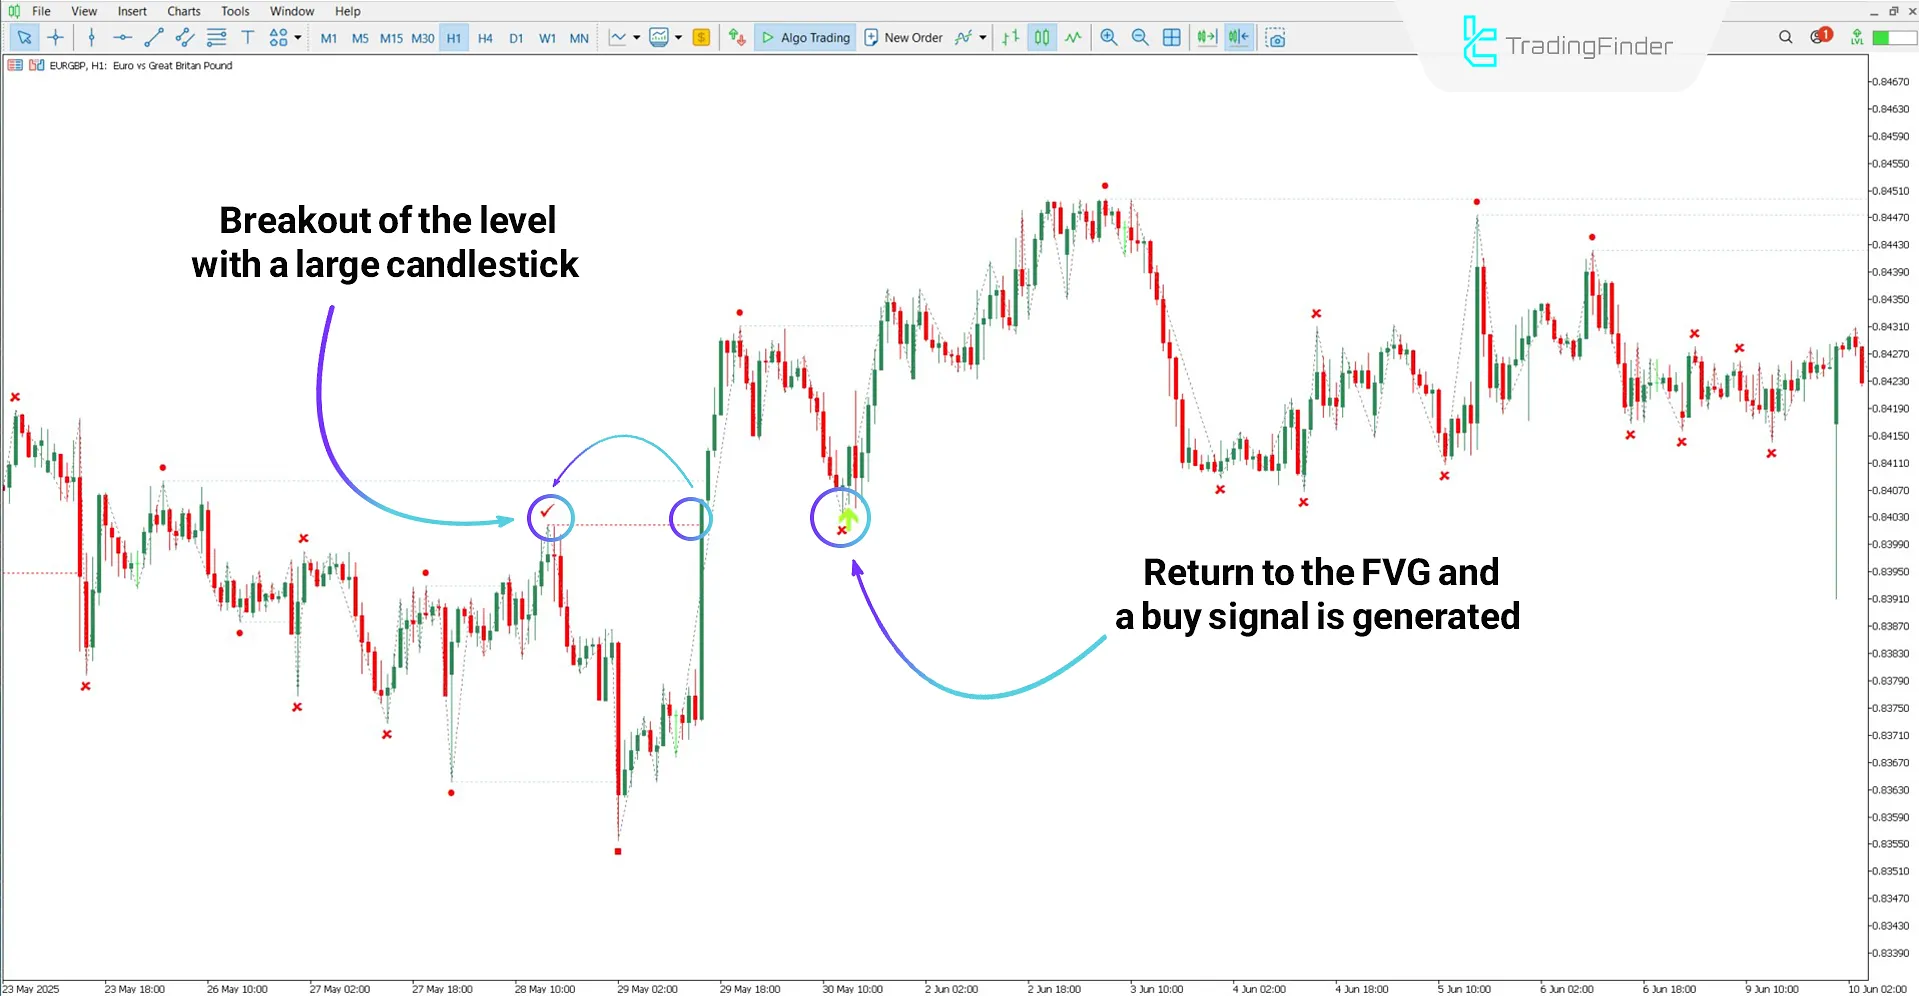
In the ICT 2022 Mentorship Indicator, in addition to signal arrows (green and orange), three other markers appear on the chart each representing a specific type of high/low breakout:
- X mark: When a previous level is touched only by the candle's shadow
- Circle mark: When the breakout of a high or low occurs via the candle's body
- Tick mark: When the breakout happens with a strong Displacement Candle
Buy Signal
According to the EUR/USD chart, a strong candle with displacement breaks the resistance level, triggering a tick mark on the chart.
As shown, the price later returns to the FVG zone, and the indicator issues a buy entry signal, marked by a green arrow.

Sell Signal
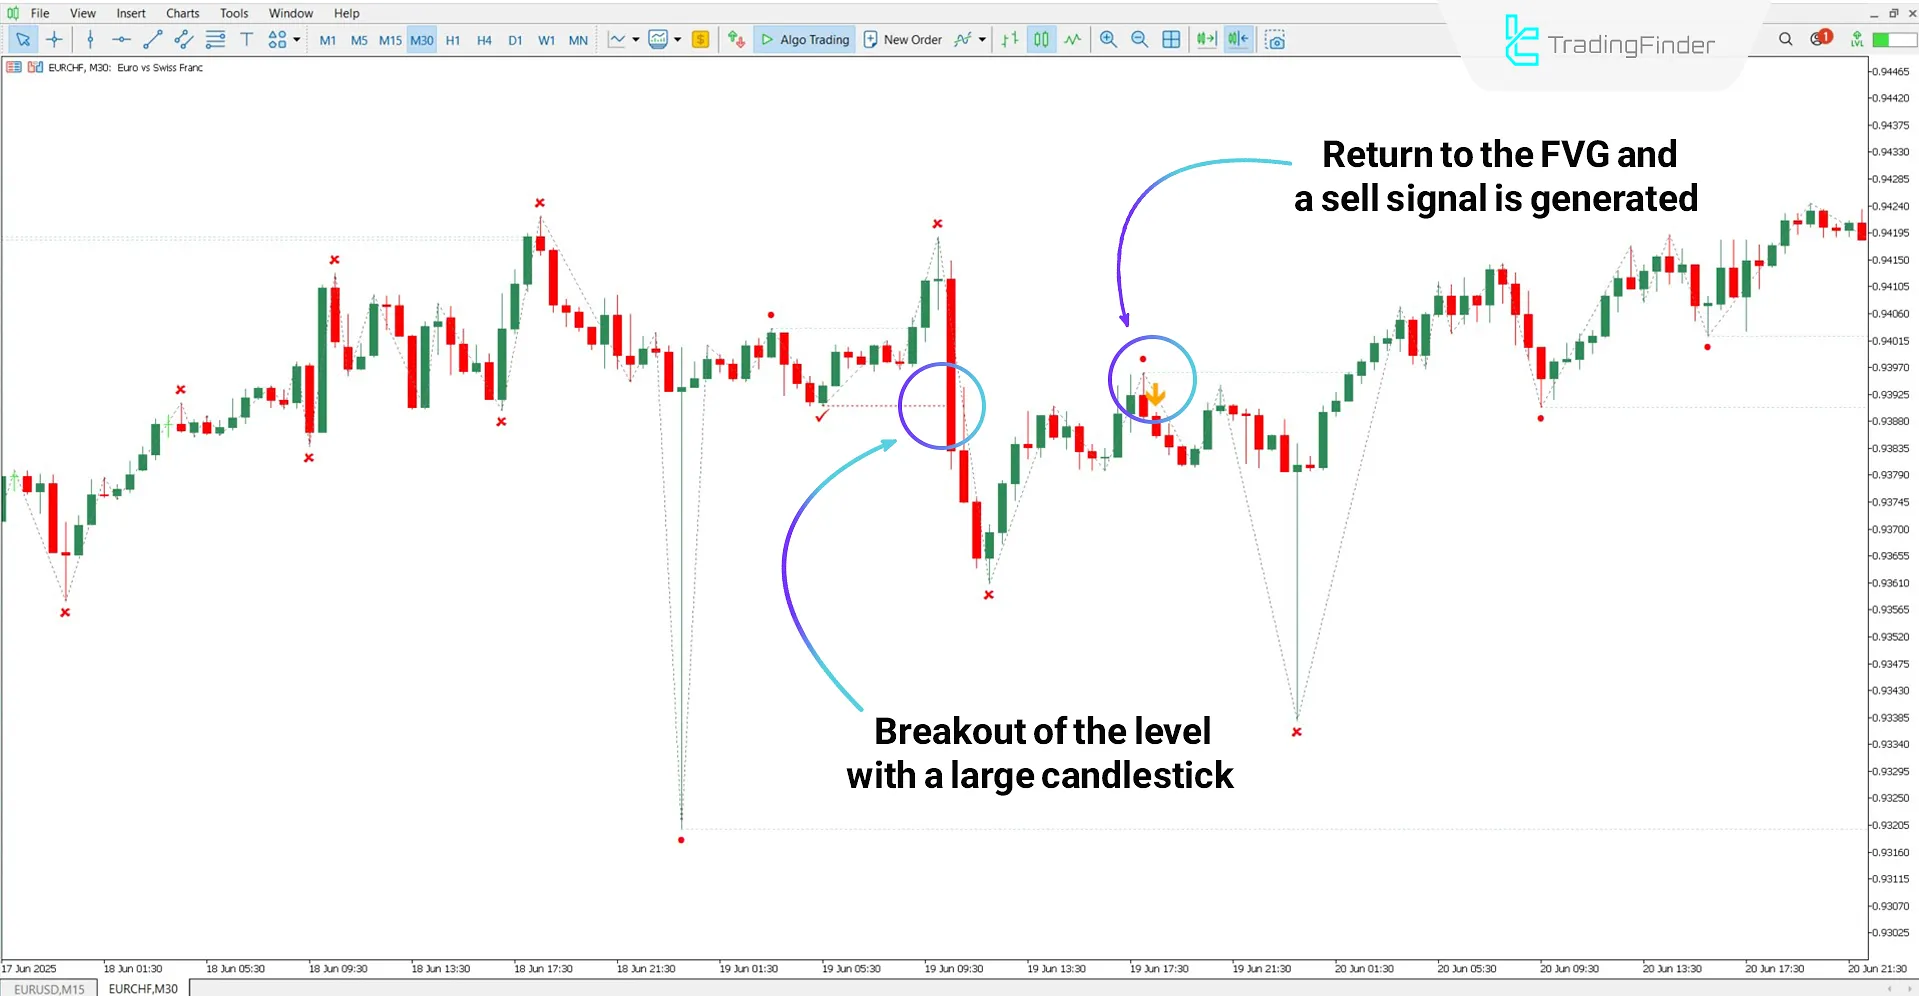
Based on the 30-minute chart of EUR/CHF, the target area has been broken by the price. After this breakout, the price returns to the FVG created at that zone, and the indicator issues a sell signal using an orange arrow.

ICT 2022 Mentorship Trading Model Indicator Settings
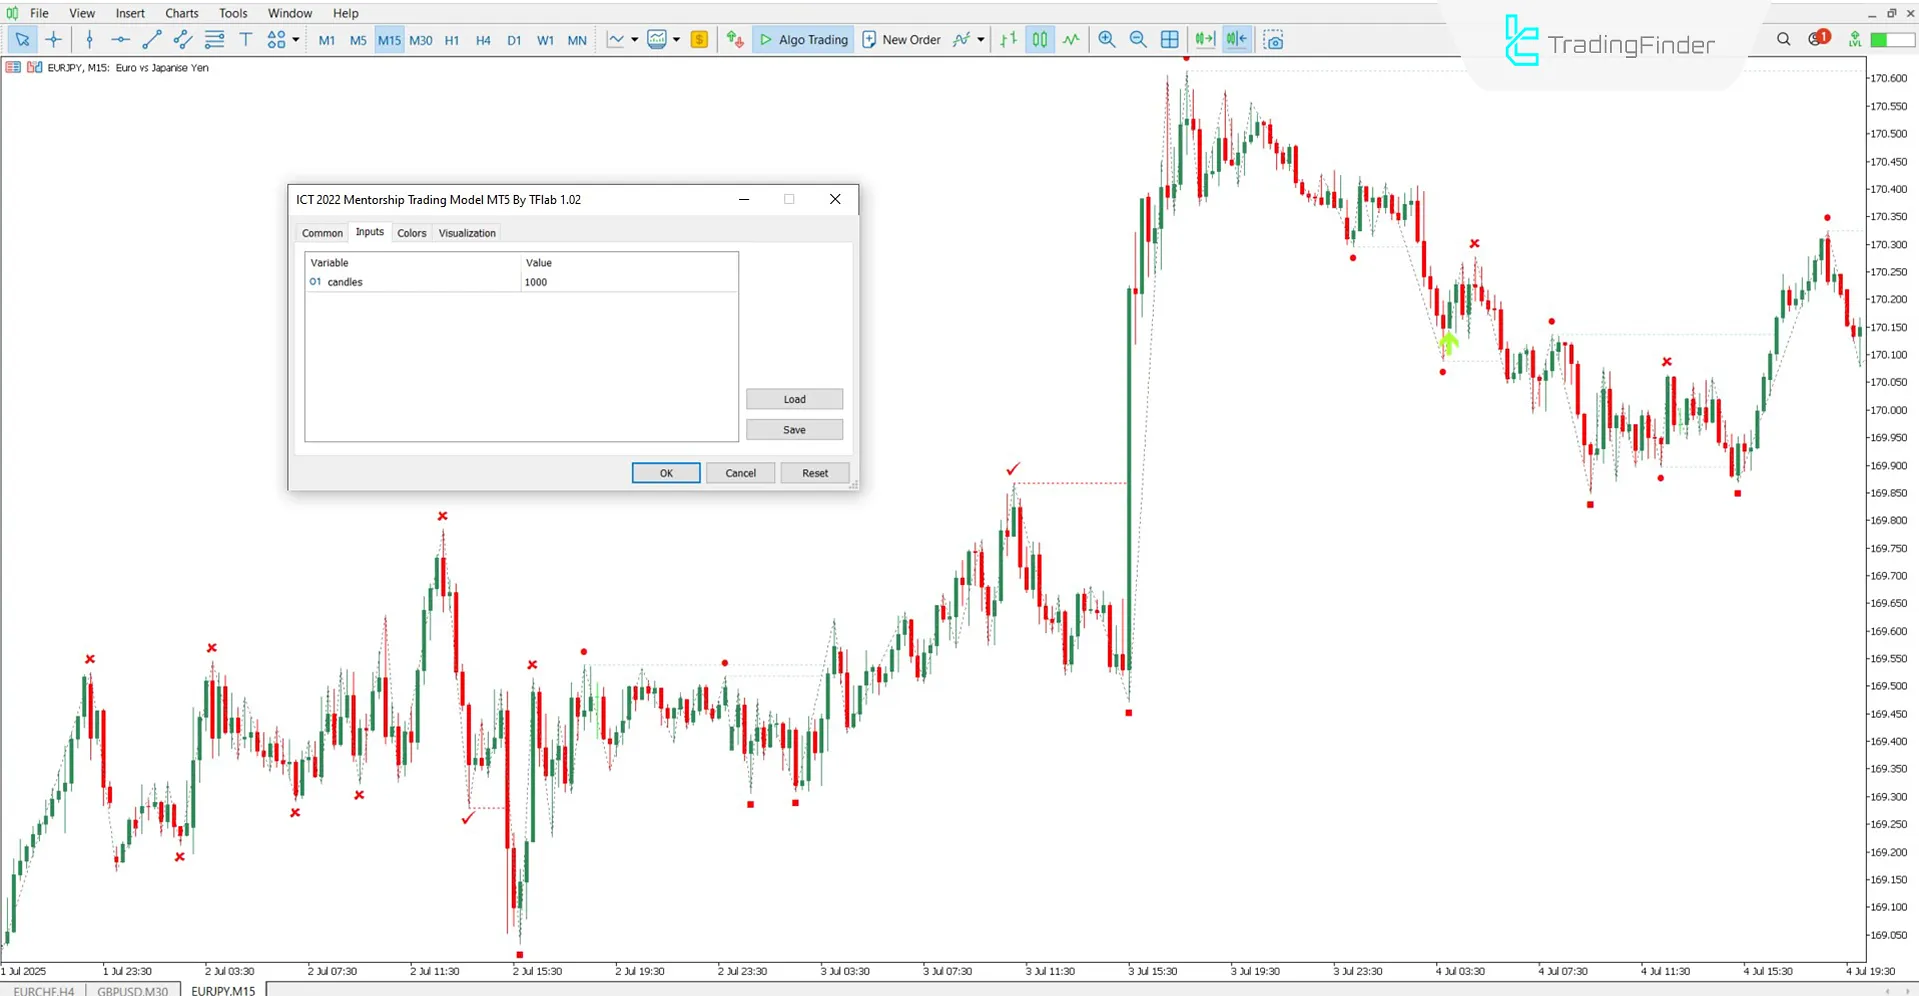
The settings of the ICT 2022 Mentorship Trading Model Indicator are shown in the image below:

- Candles: Defines the number of candles used in the indicator's calculation.
Conclusion
The ICT 2022 Mentorship Trading Model Indicator is a powerful tool for identifying key liquidity zones, valid structural breakouts, and precise price returns to FVG zones.
With its buy and sell signal generation, this indicator provides a clearer picture of price movement after a breakout, enabling traders to respond more accurately to strategic pullbacks into fair value zones.
ICT 2022 Mentorship Trading Model MT5 PDF
ICT 2022 Mentorship Trading Model MT5 PDF
Click to download ICT 2022 Mentorship Trading Model MT5 PDFWhat is the difference between the green and orange arrows?
Green arrows indicate buy entry opportunities, while orange arrows represent sell signals.
Is the ICT 2022 Mentorship Trading Model Indicator limited to the Forex market?
No, this indicator can be used across all markets.


