


On August 16, 2025, in the latest version, the Unicorn and Inducement modules were added to enable more precise liquidity flow analysis; To obtain a free license for this indicator, click on Online Support and reach out to us via Telegram or WhatsApp through the section “Connect with an Expert.
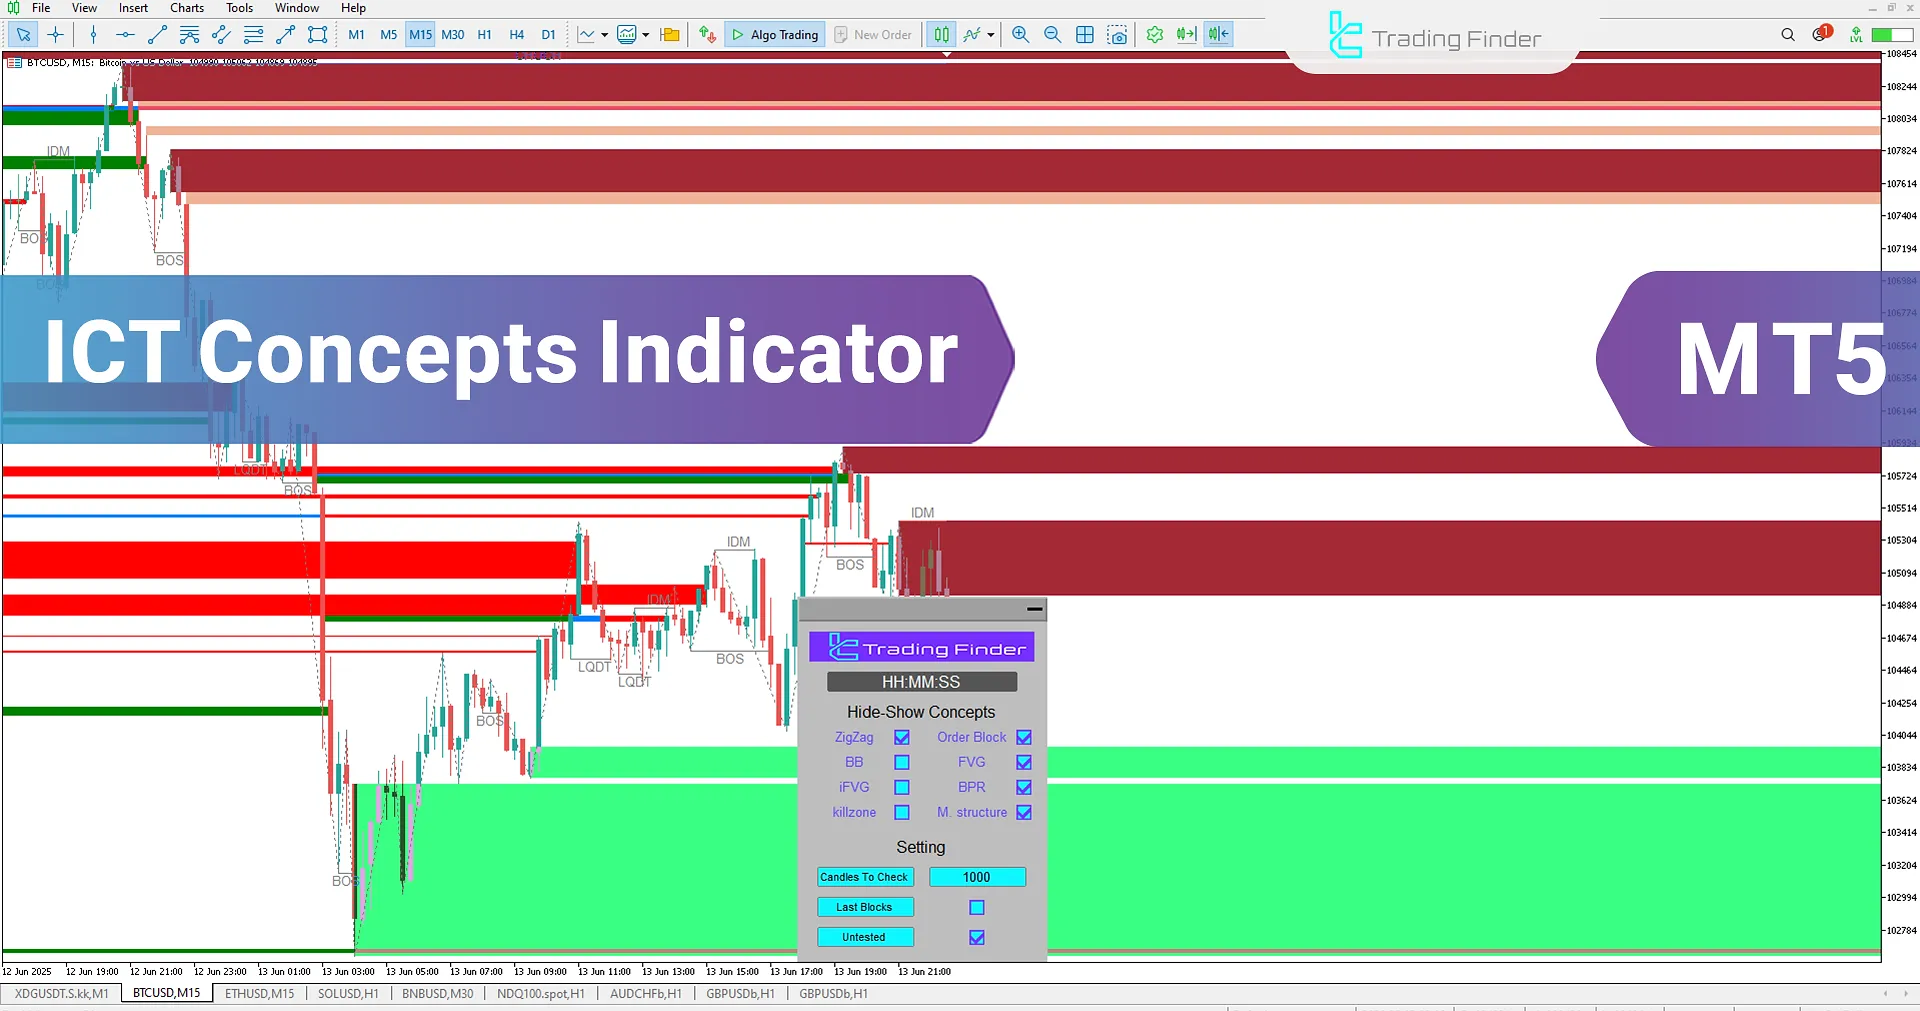
The ICT Concepts indicator, as a specialized and advanced tool, is exclusively designed in the form of an expert and can be executed through settings and expert installation method. This tool provides traders with a comprehensive set of key ICT and Smart Money concepts through a professional and customizable panel.
This indicator enables forex traders to develop a deep understanding of market structure and deliver more advanced technical analysis.
Within this tool, essential concepts such as Order Blocks, Fair Value Gaps (FVGs), Breaker Blocks, Market Structure, and Kill Zones are readily accessible.
These elements provide insights into price behavior, liquidity flow, and critical market levels, allowing traders to pinpoint potential entry and exit zones.
ICT Concepts Indicator Table
Below is a general specification of the ICT Concepts Indicator:
Indicator Categories: | Smart Money MT5 Indicators Session & KillZone MT5 Indicators ICT MT5 Indicators |
Platforms: | MetaTrader 5 Indicators |
Trading Skills: | Advanced |
Indicator Types: | Leading MT5 Indicators Non-Repaint MT5 Indicators Reversal MT5 Indicators |
Timeframe: | Multi-Timeframe MT5 Indicators |
Trading Style: | Intraday MT5 Indicators Scalper MT5 Indicators Day Trading MT5 Indicators |
Trading Instruments: | Forex MT5 Indicators Stock MT5 Indicators Indices MT5 Indicators Share Stock MT5 Indicators |
ICT Concepts Indicator at a Glance
The ICT Concepts Indicator is a powerful and comprehensive tool designed for traders who follow the ICT and Smart Money methodologies. It empowers them to develop customized trading strategies and conduct sophisticated chart analysis.
The indicator offers eight core concepts from the ICT methodology, such as Order Blocks, Market Structure, and Fair Value Gaps, making it an essential asset for professional market analysis.
Users can toggle each concept’s visibility with just a few clicks enabling precise focus on relevant market components across different timeframes.
Expert Installation Method
All steps for installing and setting up the Expert in MetaTrader 5 have been fully and precisely described in a dedicated instructional guide.
To access the details of this process and become familiar with the necessary considerations, refer to the tutorial specifically designed for installing the Expert on the MT5 platform.
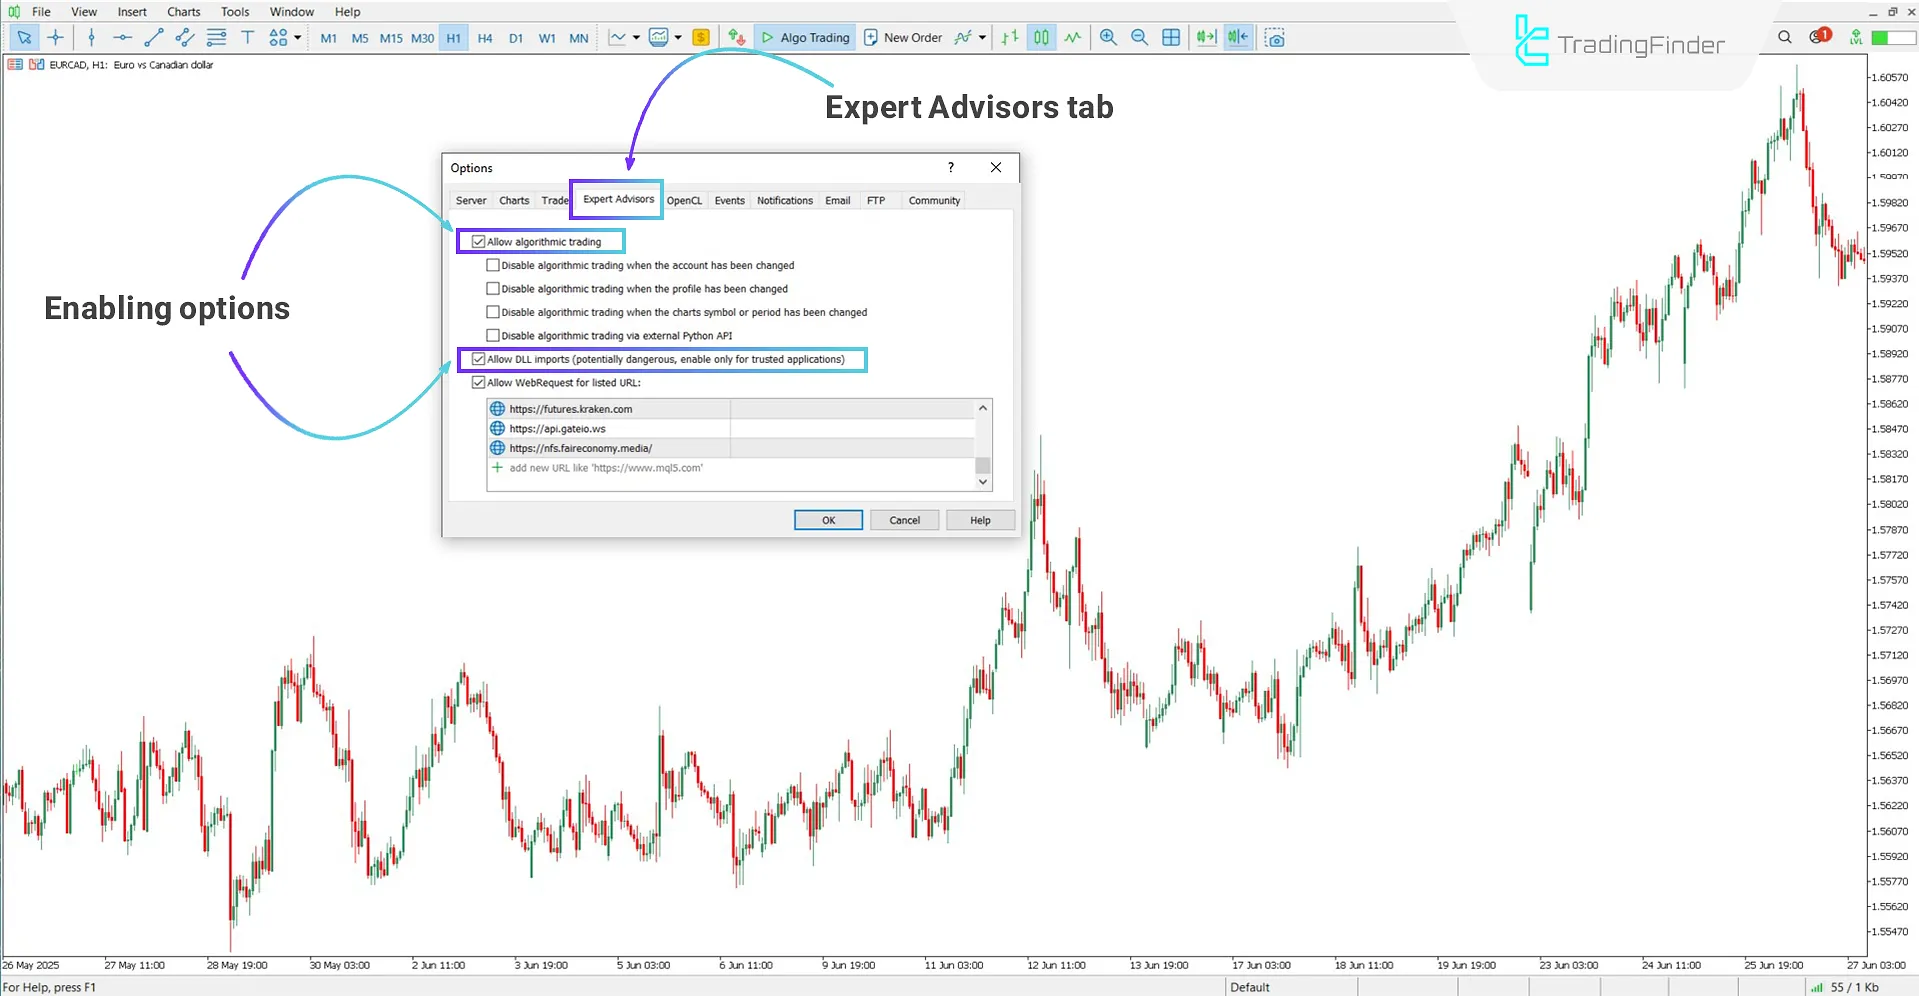
Enabling the "Allow automated trading" and "DLL" Options
To run the Expert correctly in MetaTrader 5, two essential settings must be enabled within the platform.
The steps to apply these settings are as follows:
- First, open the "Tools" menu and go to the "Options" section.
- In the window that opens, navigate to the "Expert Advisors" tab.
- Finally, enable the following options
Options:
- Allow automated trading
- Allow DLL imports
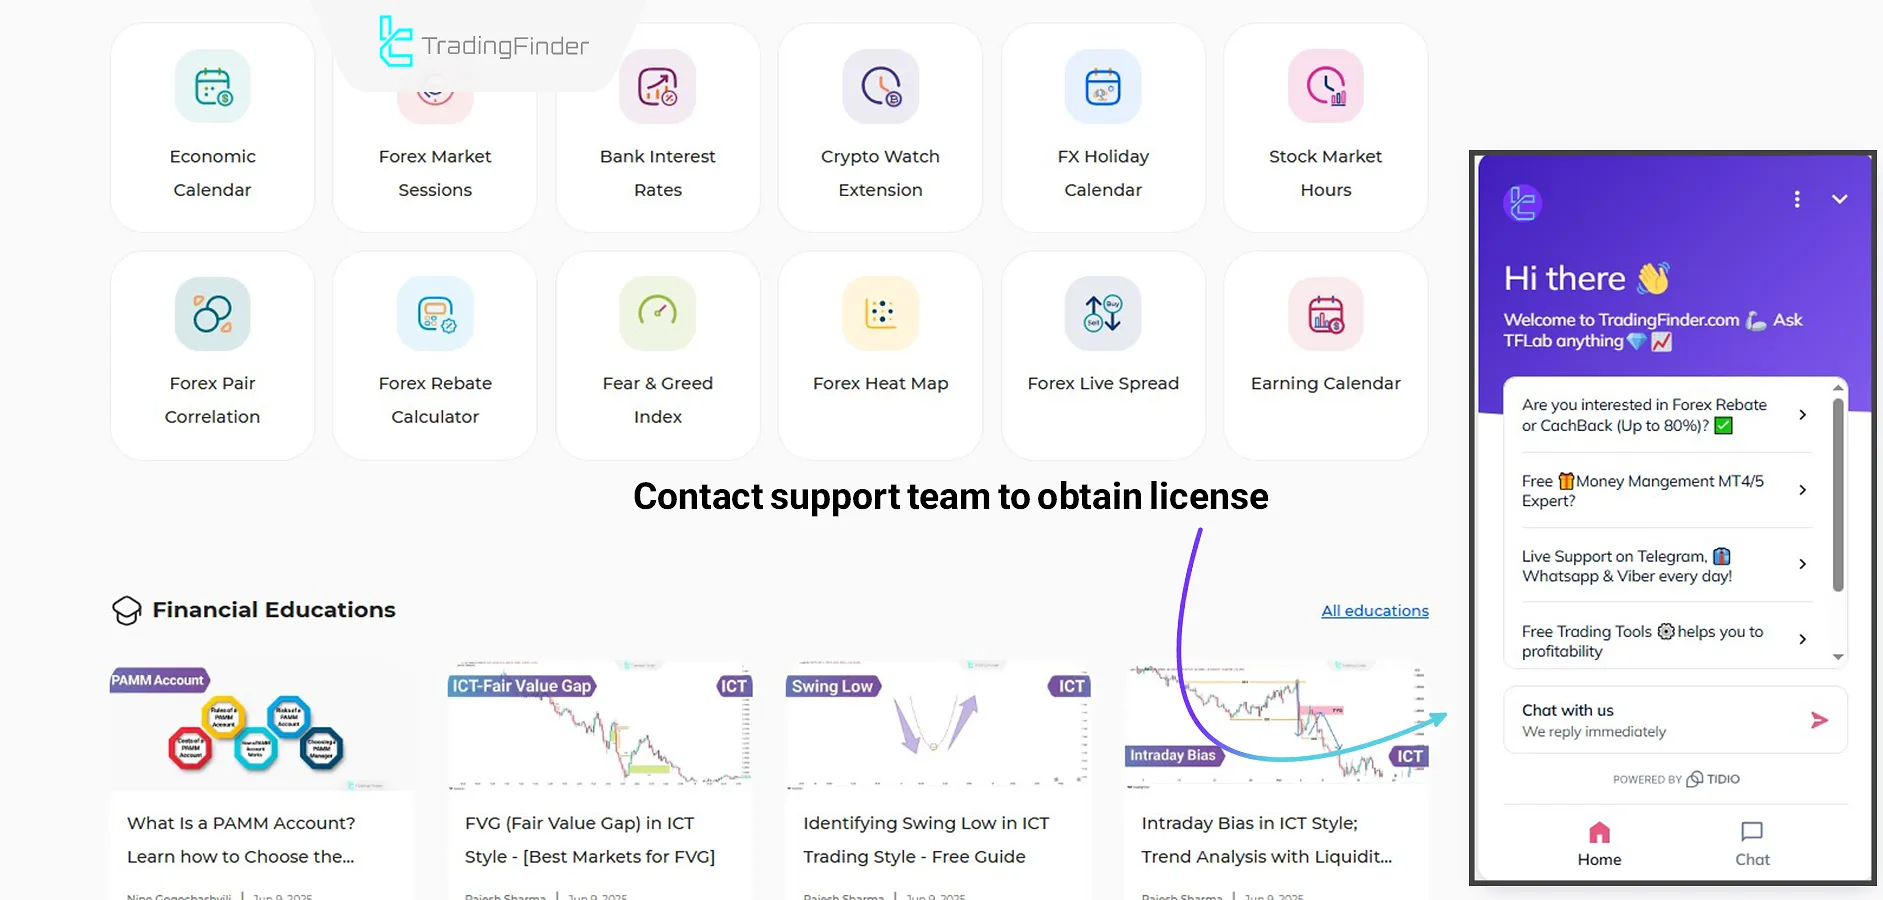
License Code Request
To obtain the license code, users can contact the support team of the Trading Finder website.
Additionally, you can submit a request through messaging apps like WhatsApp or Telegram.
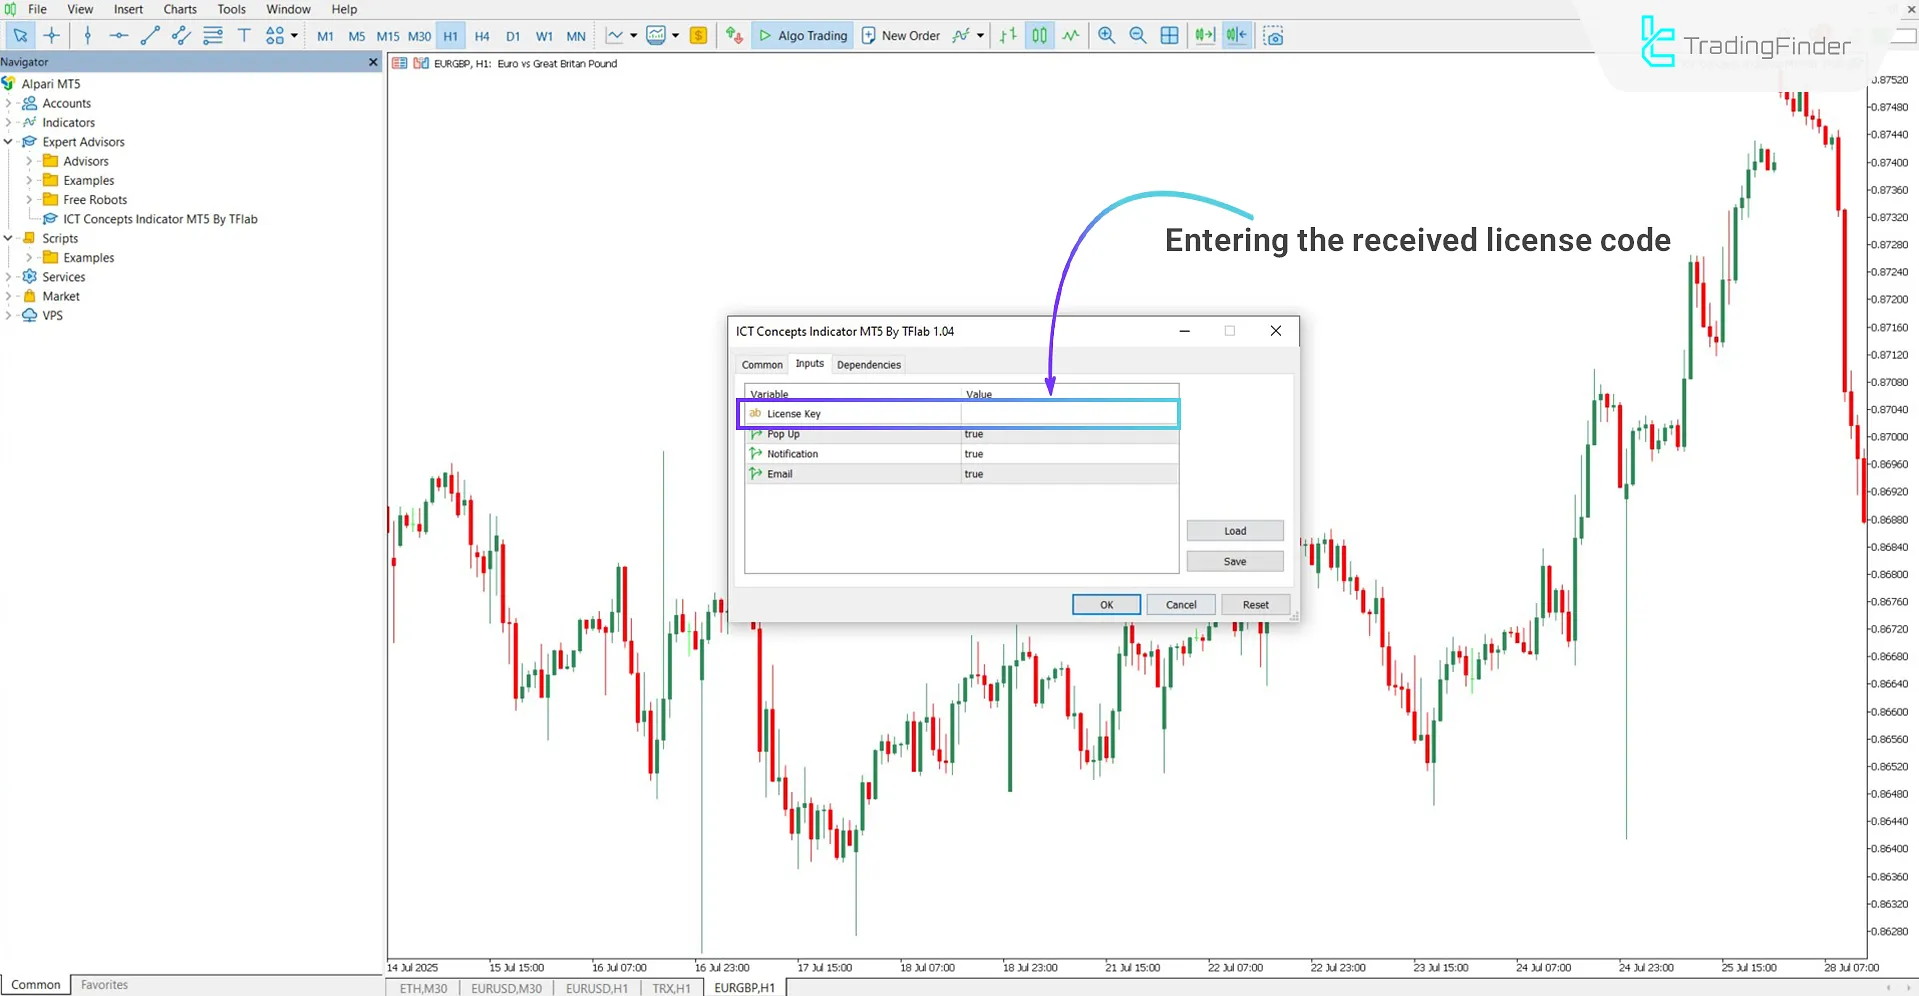
How to Use the License Code
When the Expert is placed on the chart, the main panel will appear automatically.
At this point, the user must enter the license code exactly as received (without modification) into the field labeled "Your License."
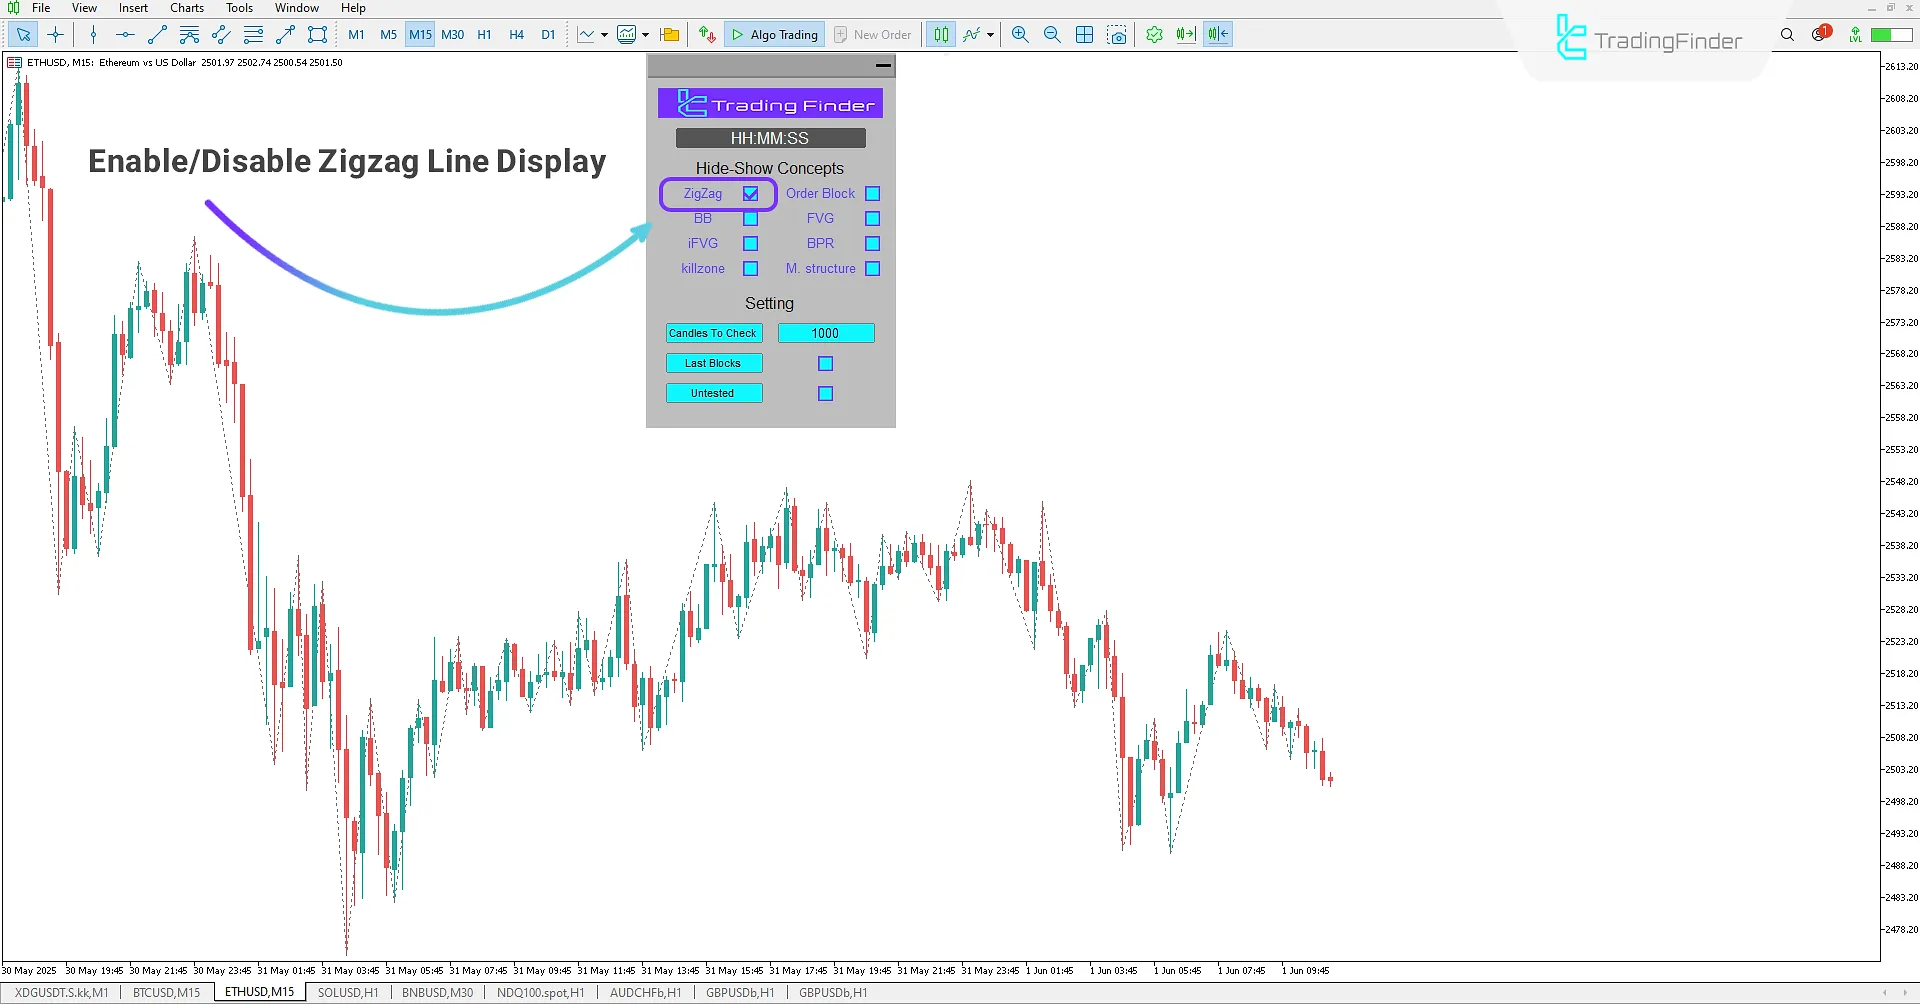
Zigzag Mode
In a 15-minute ETH/USD chart, activating the Zigzag Lines option in the ICT Concepts Indicator panel with the values 5, 3, 3 provides an overview of the broader price structure.
By drawing zigzag lines, this mode helps traders visually understand market trends and the underlying price structure. It highlights price highs and lows, playing a crucial role in identifying key swing points.
This tool aids traders in evaluating trend direction, market structure shifts, and the character of price movements, refining decision-making based on trend analysis and structural breaks.
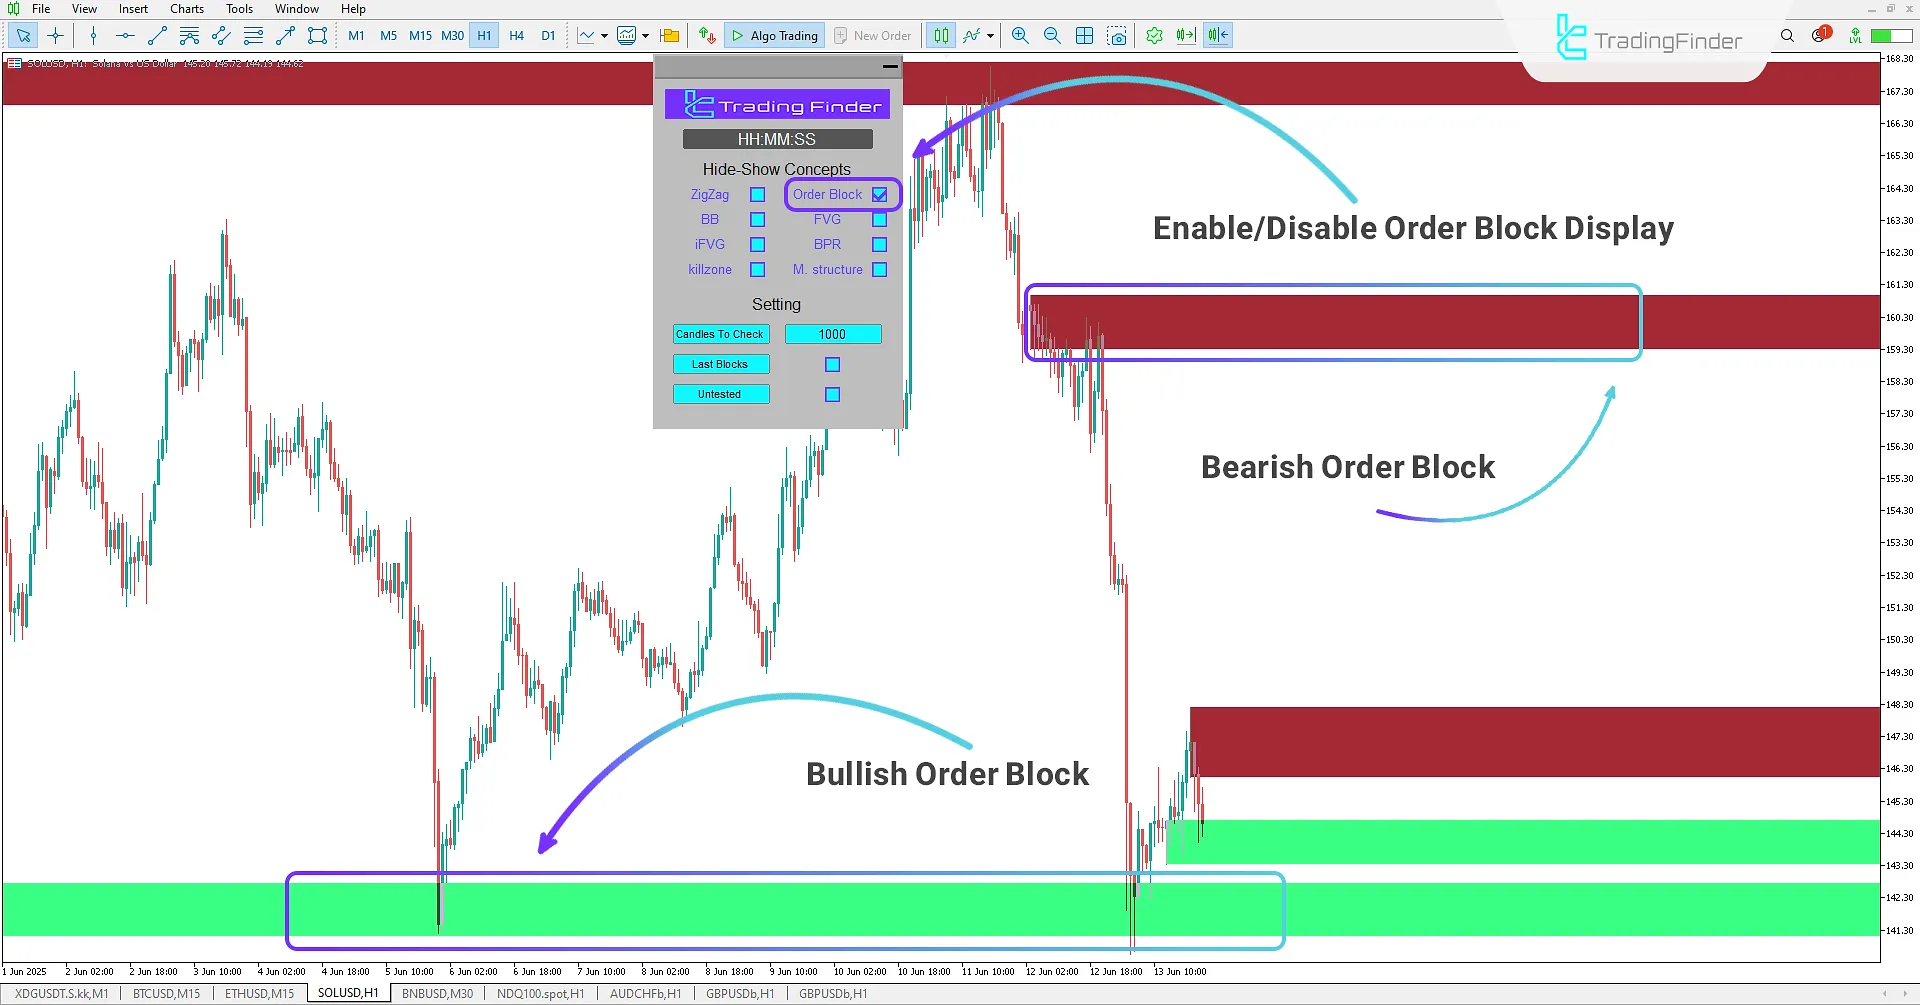
Order Block Mode
On a 1-hour SOL/USD chart, enabling the Order Blocks option within the ICT Concepts Indicator highlights high-liquidity zones typically created by smart money, banks, and institutions.
These Order Blocks represent areas with intense buying or selling pressure, often resulting in significant market moves. When price returns to these zones, traders can view them as potential impulse entry areas, since they often align with liquidity accumulation and trend definition.
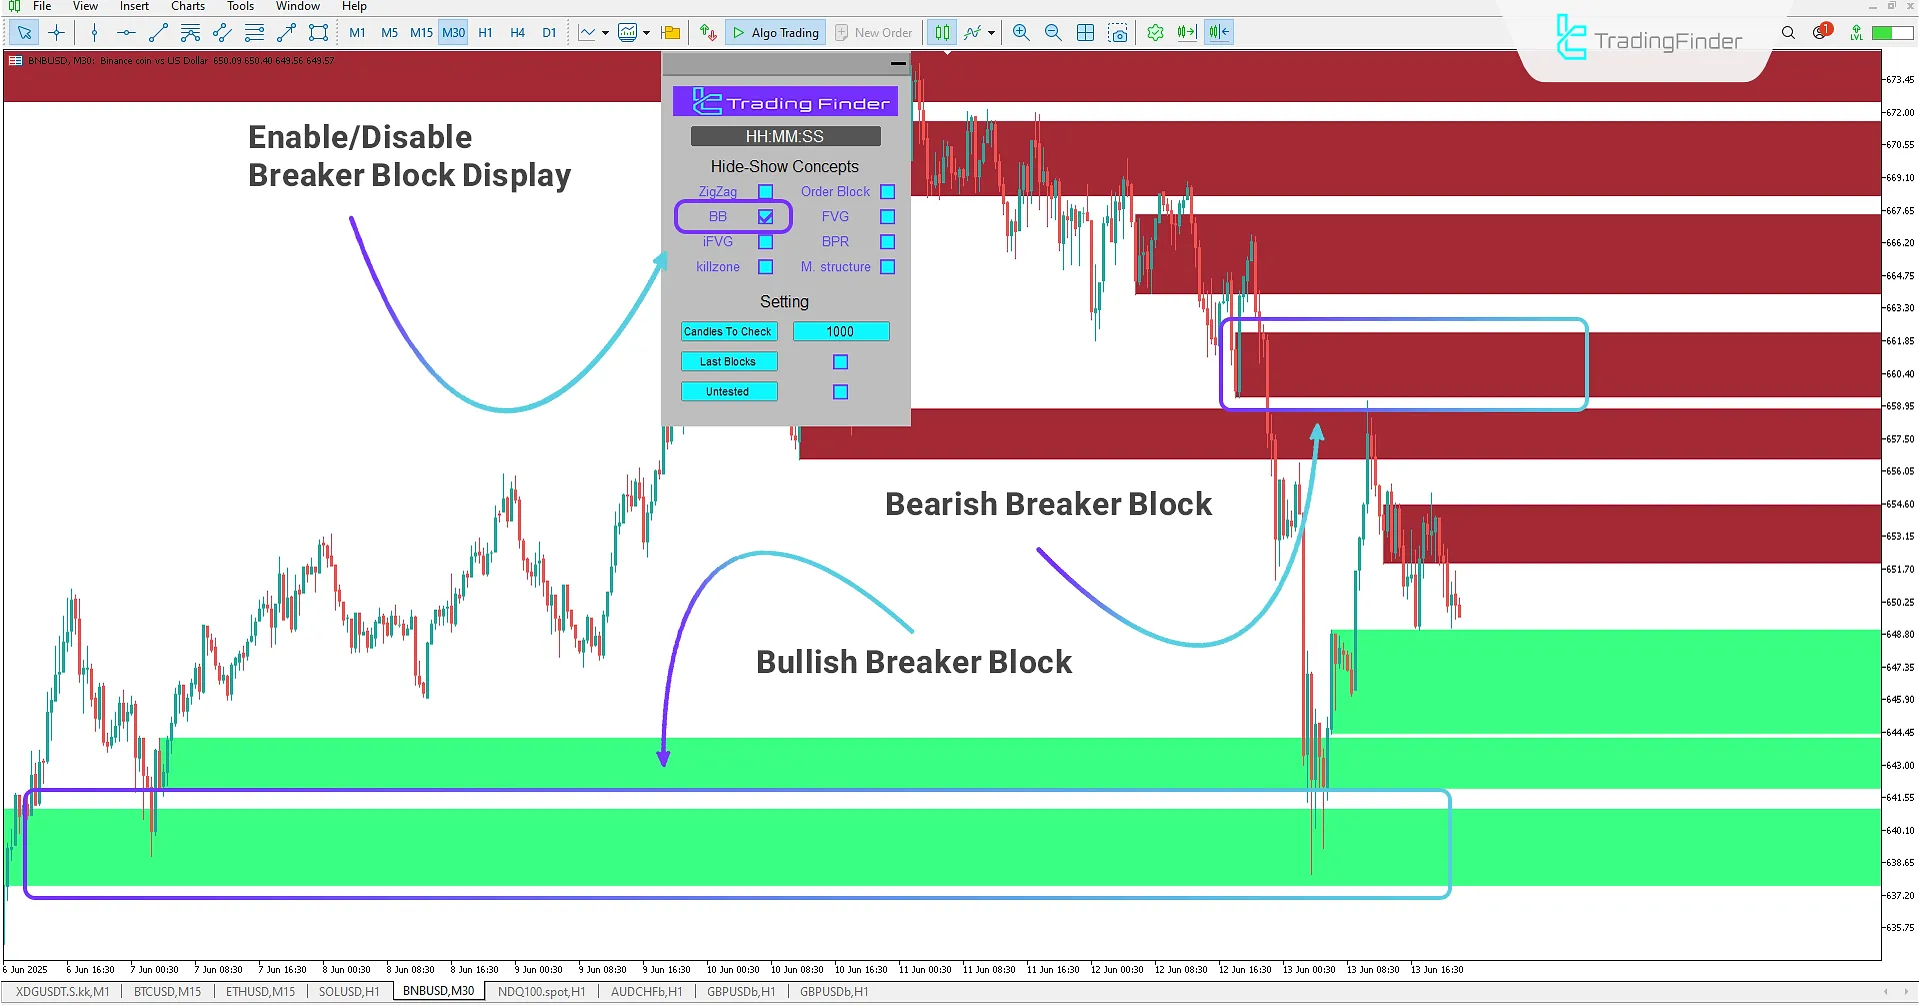
Breaker Block Mode
By activating Breaker Block mode, traders can identify broken Order Block zones. These are formed when an Order Block is invalidated due to liquidity grabs and a shift in market structure.
For example, a bullish Order Block once breached transforms into a bearish Breaker Block, turning support into resistance. Conversely, a bearish block transforms into a bullish one upon structure shift.
As price returns to these pivotal areas, traders can enter long or short positions by combining market structure confirmation with technical tools.
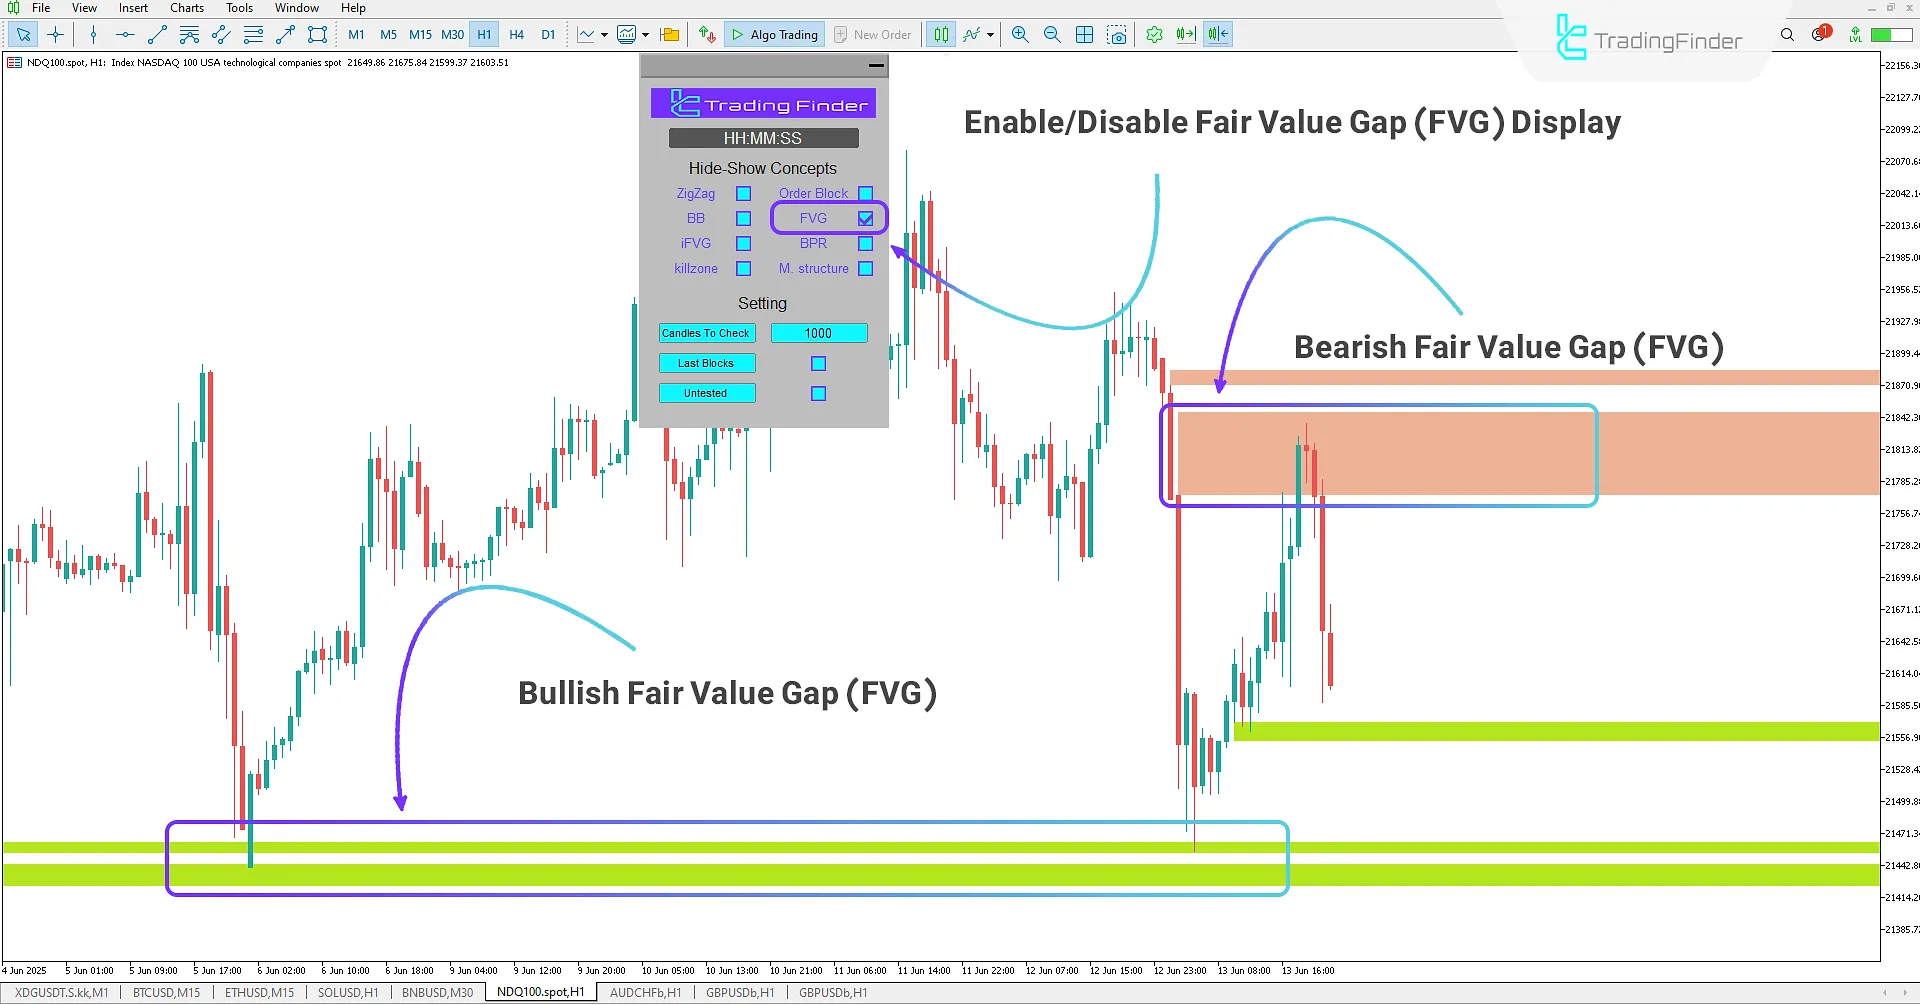
Fair Value Gap (FVG) Mode
The Fair Value Gap option enables users to detect price imbalances and market inefficiencies through a distinct three-candle pattern, where a gap is formed between the first and third candle while the second candle fails to fully fill it.
These gaps signal strong buying or selling pressure and tend to magnetically pull price back to restore equilibrium. Upon price return, these zones can act as reliable support or resistance levels.
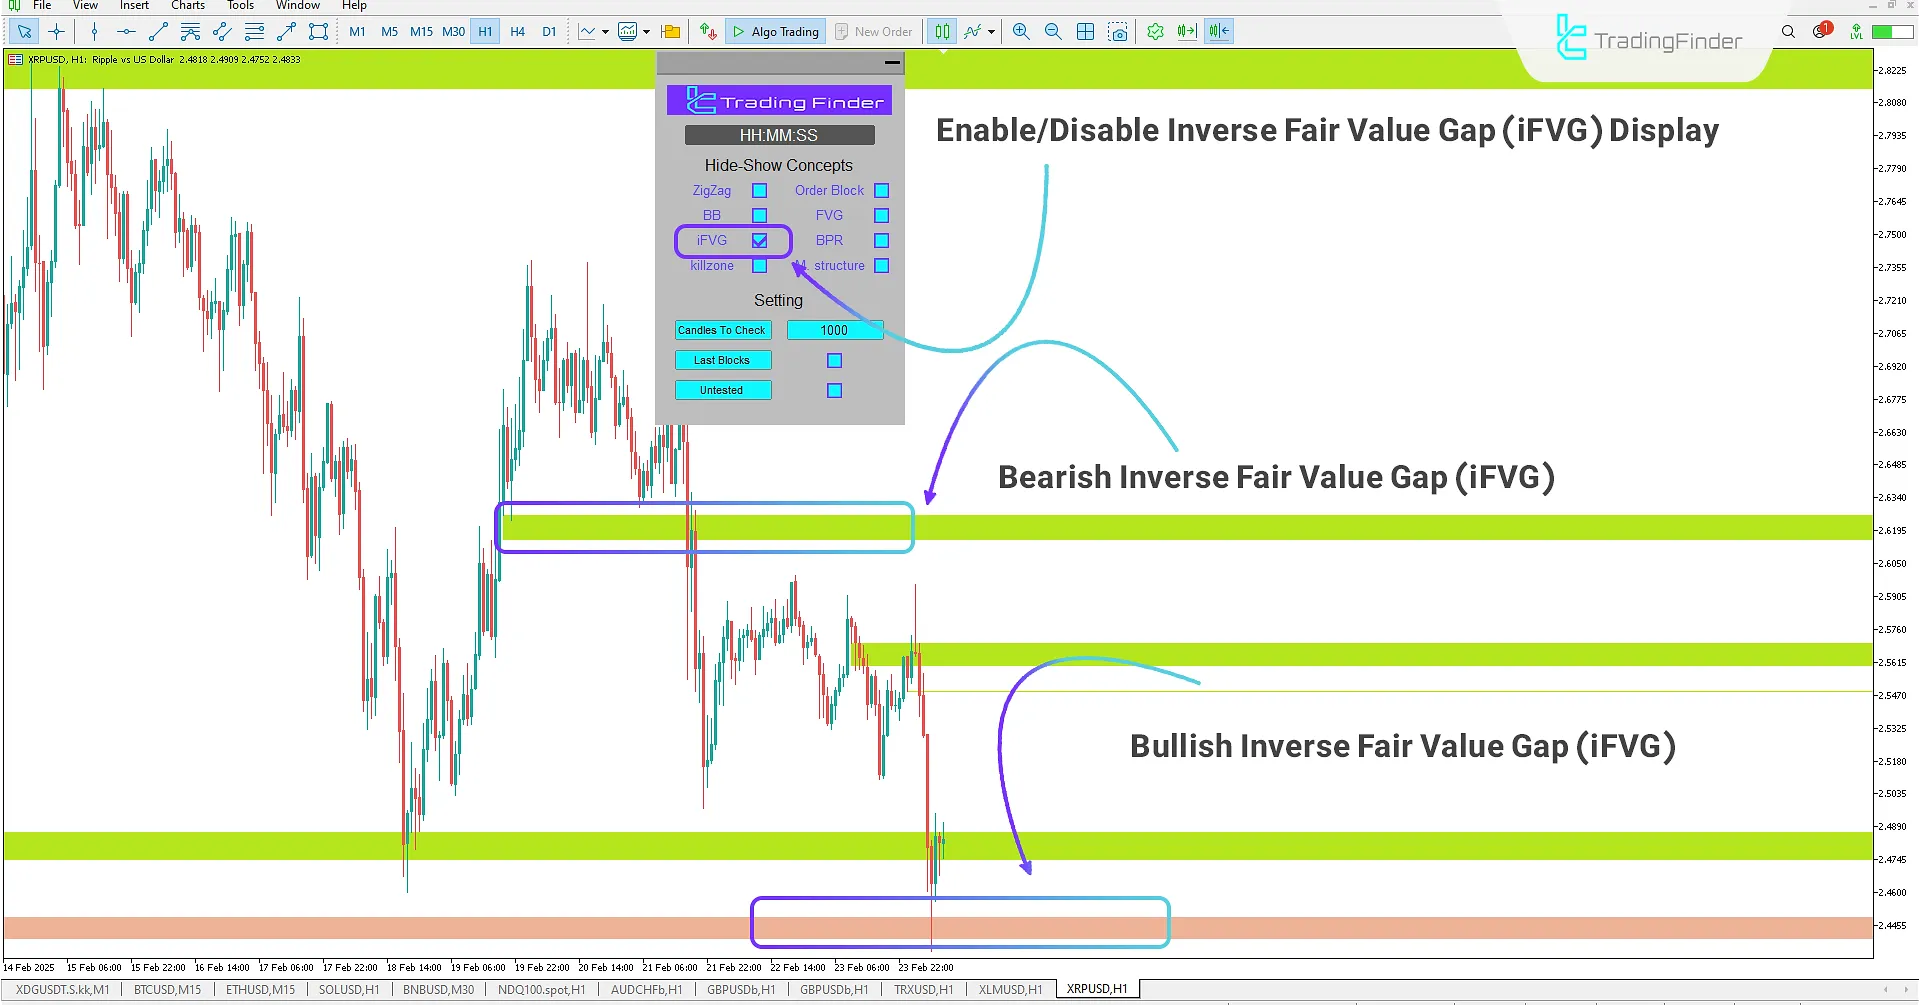
Inverse Fair Value Gap (iFVG) Mode
The iFVG mode identifies previously broken Fair Value Gaps that have shifted character due to market structure shifts.
A bullish FVG that’s been broken, for instance, may turn into a bearish iFVG, and vice versa. These modified zones become key reversal points, helping traders pinpoint areas of potential price reactivity.
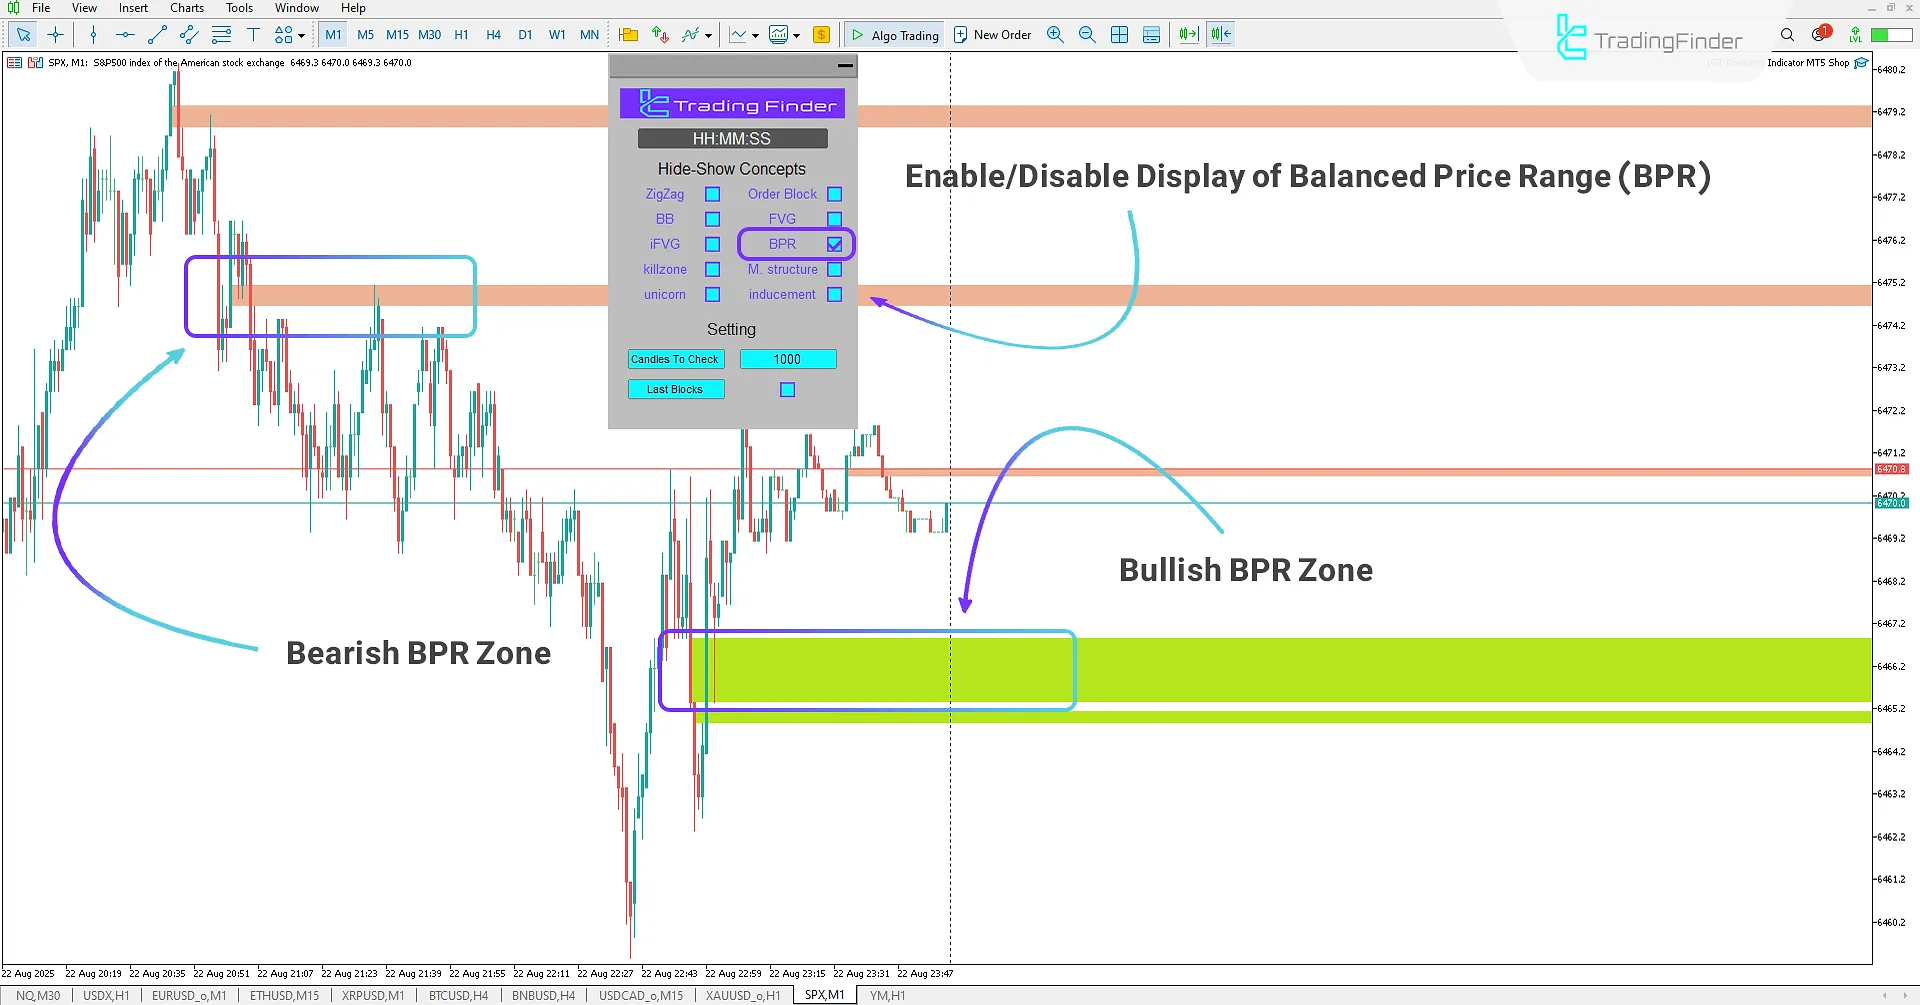
Balanced Price Range (BPR) Mode
One of the more advanced ICT concepts is the identification of Balanced Price Ranges, zones where price reaches relative equilibrium, exhibiting reduced or controlled volatility.
These areas are formed by the overlap of a bullish and bearish Fair Value Gap, creating a range that’s often viewed as a supply-demand equilibrium zone.
Upon price revisit, these areas often trigger strong reactions due to the conflicting forces of buyers and sellers, offering a strategic entry point for both long and short trades.
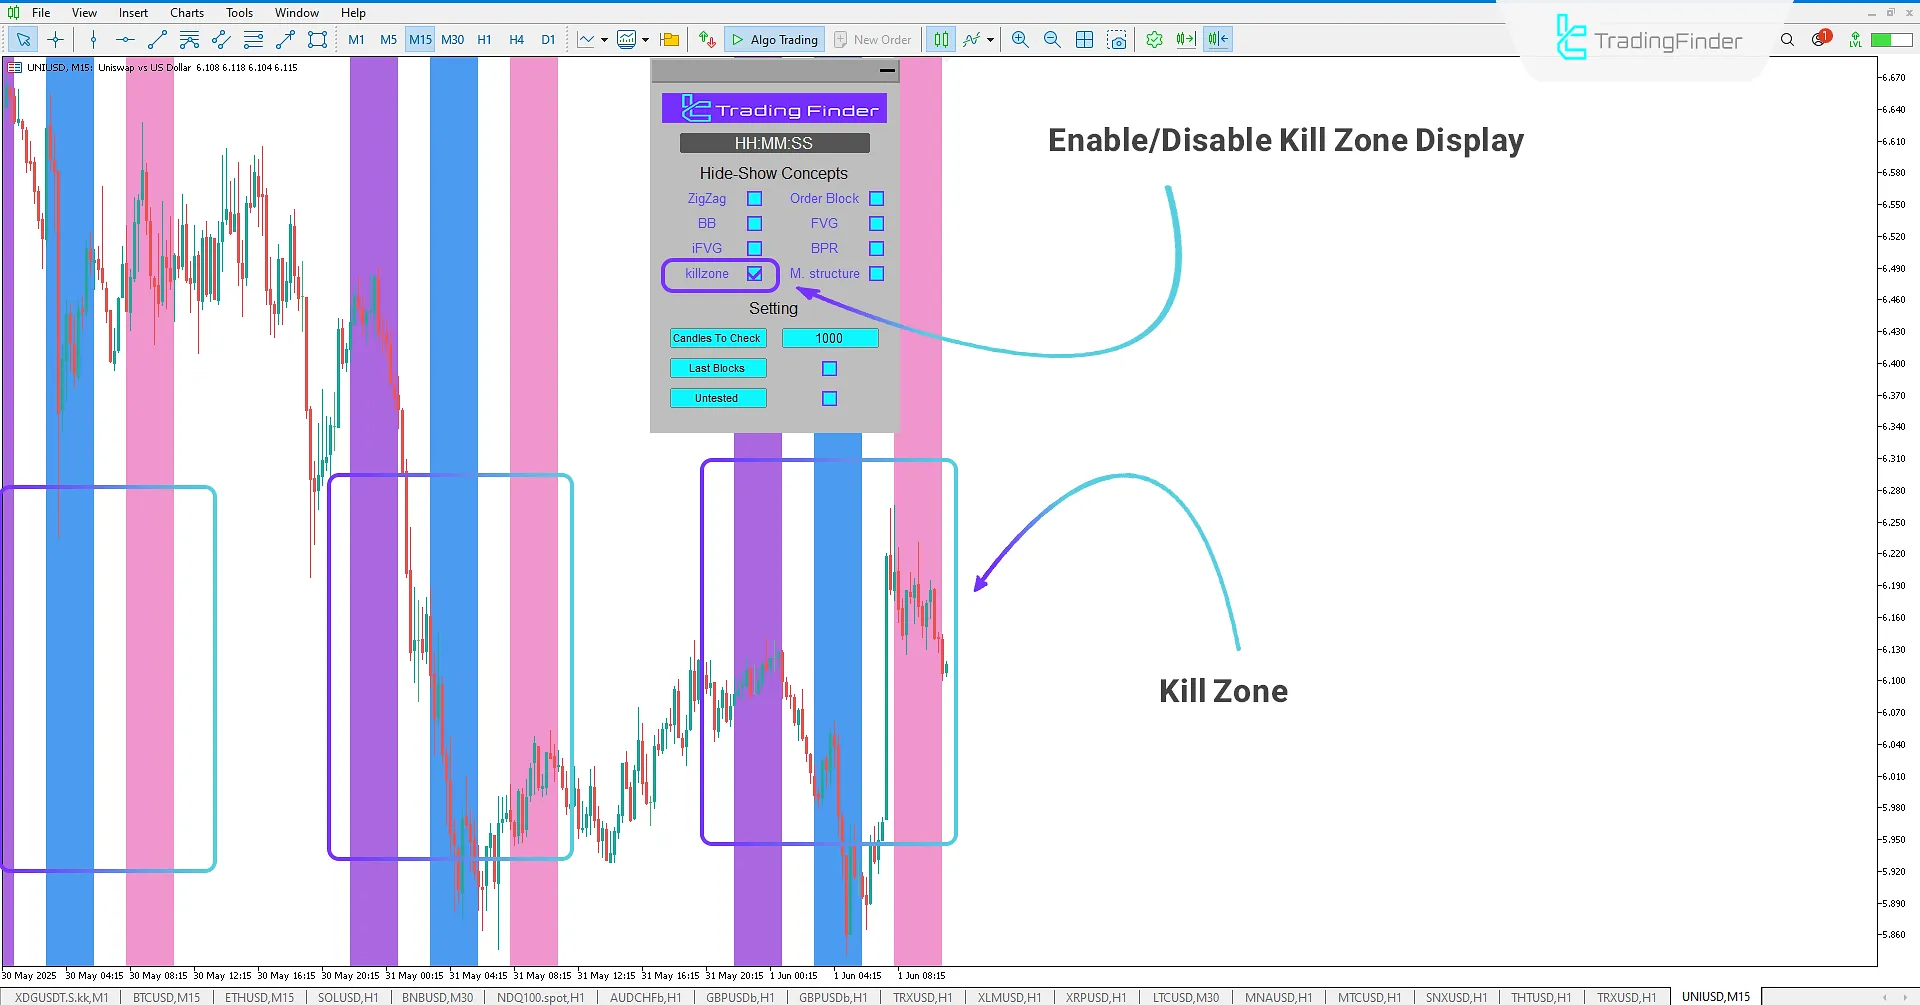
Kill Zone Mode
During trading sessions, certain time windows exhibit high volatility and volume ideal for low-risk, high-reward entries.
Enabling Kill Zone mode reveals three major time zones on the chart. These zones help traders establish the daily bias using the ICT analytical framework.
Using specialized ICT strategies like Judas Swing, Silver Bullet, and the Optimal Trade Entry (OTE) pattern, traders can capitalize on these powerful market moves.
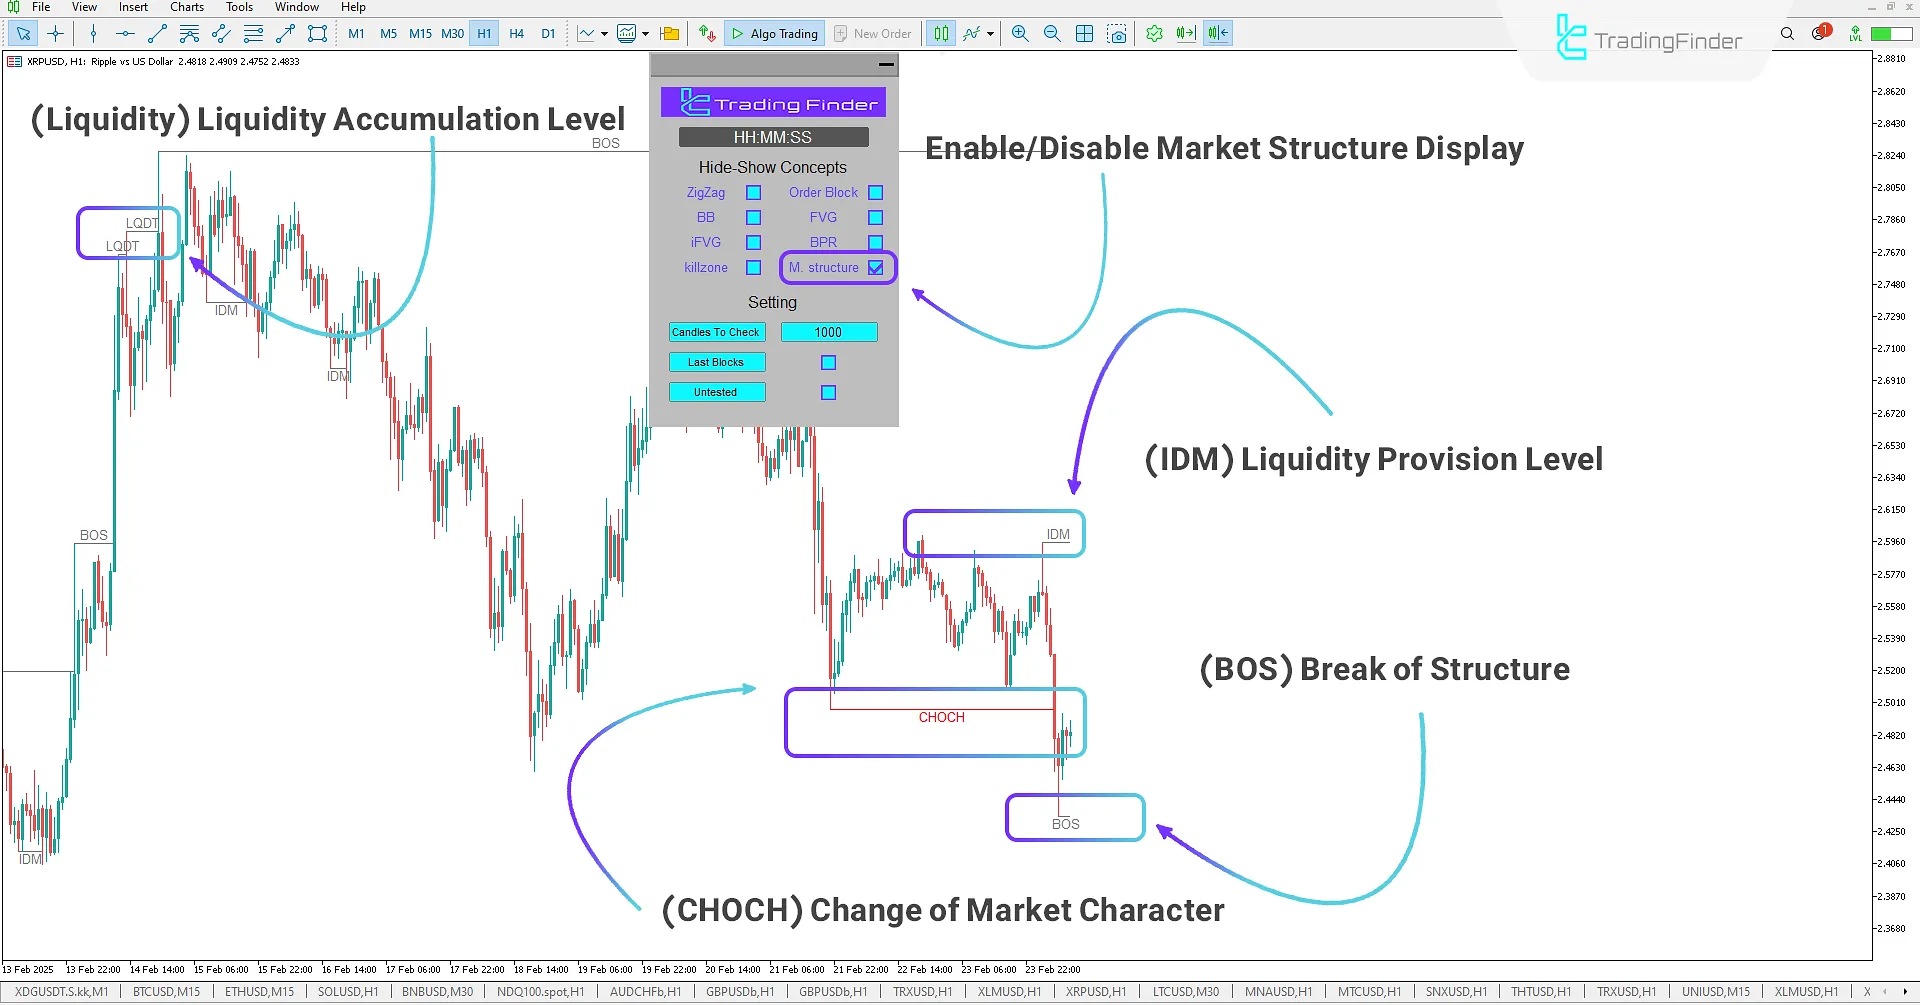
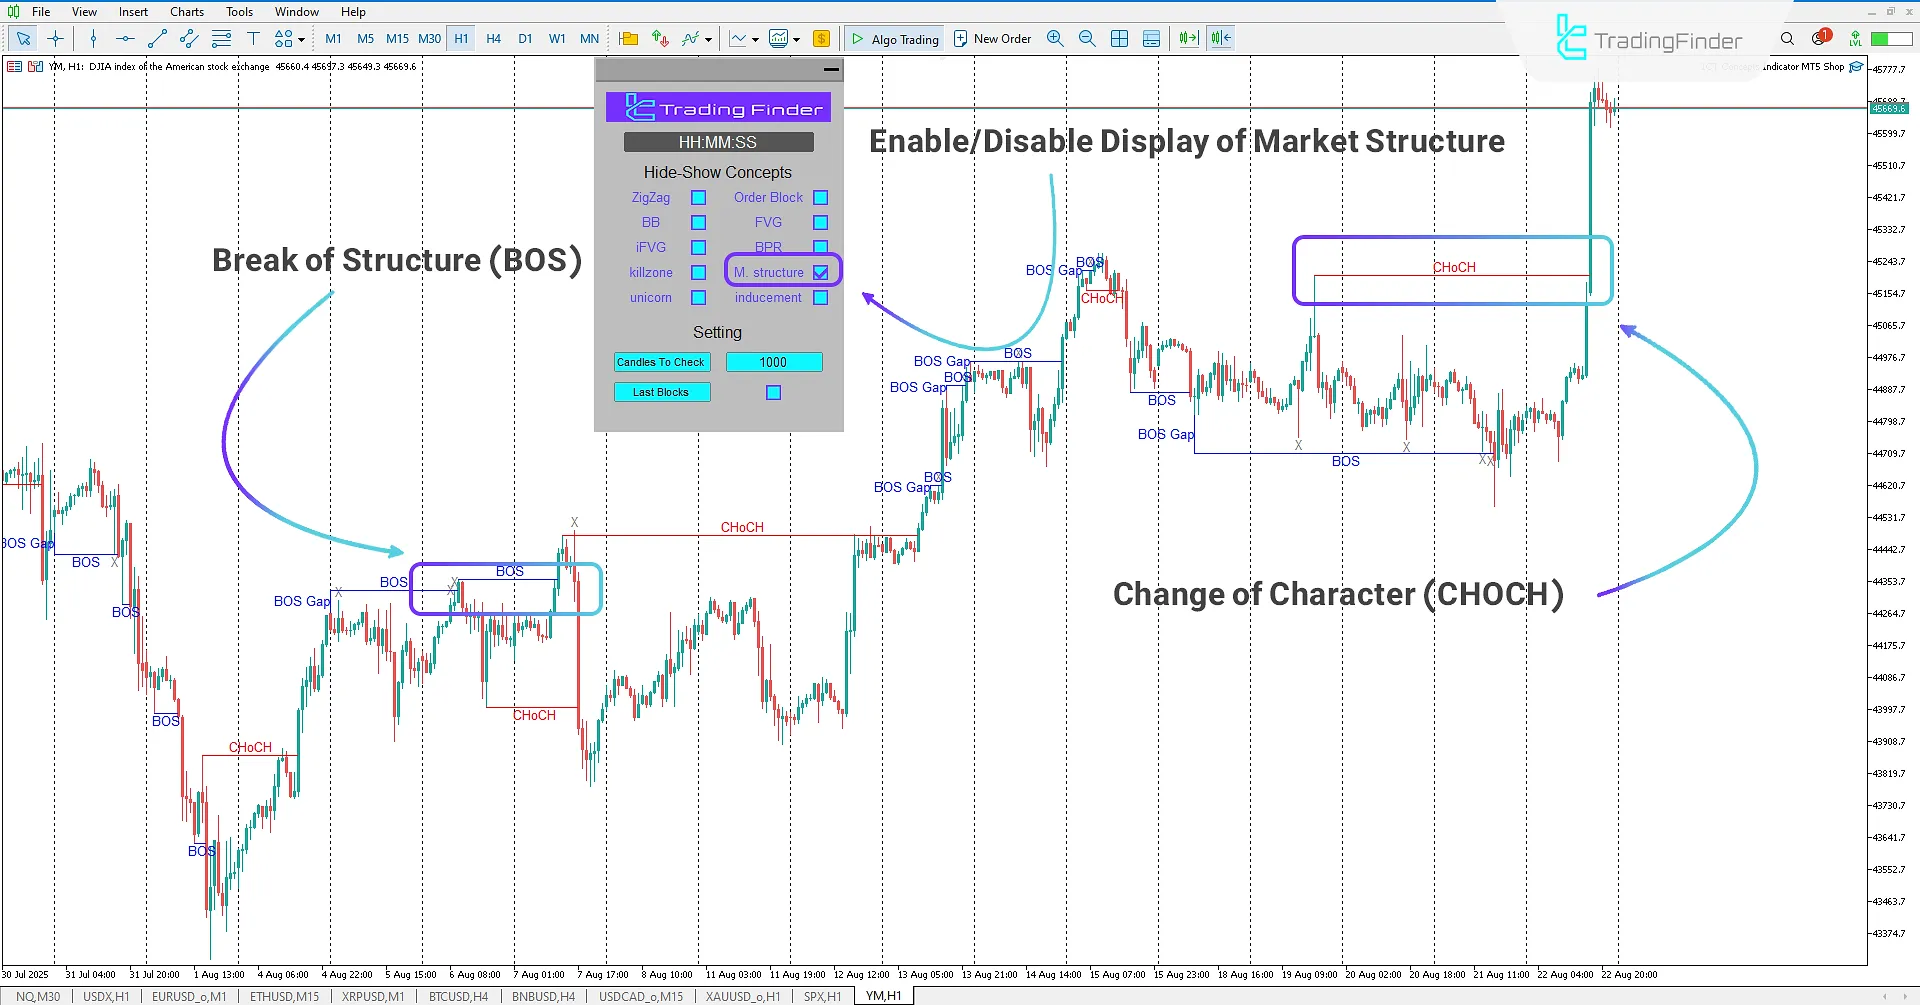
Market Structure (M Structure) Mode
Understanding Market Structure is essential for price behavior analysis. The ICT Concepts Indicator allows traders to clearly viewprice movement structures and detect key elements like Break of Structure (BOS) and Change of Character (CHOCH).
It also helps identify Liquidity Levels and Inducement Zones, essential for recognizing smart money activity. By analyzing how liquidity is collected or swept, traders can make more informed, lower-risk trading decisions.
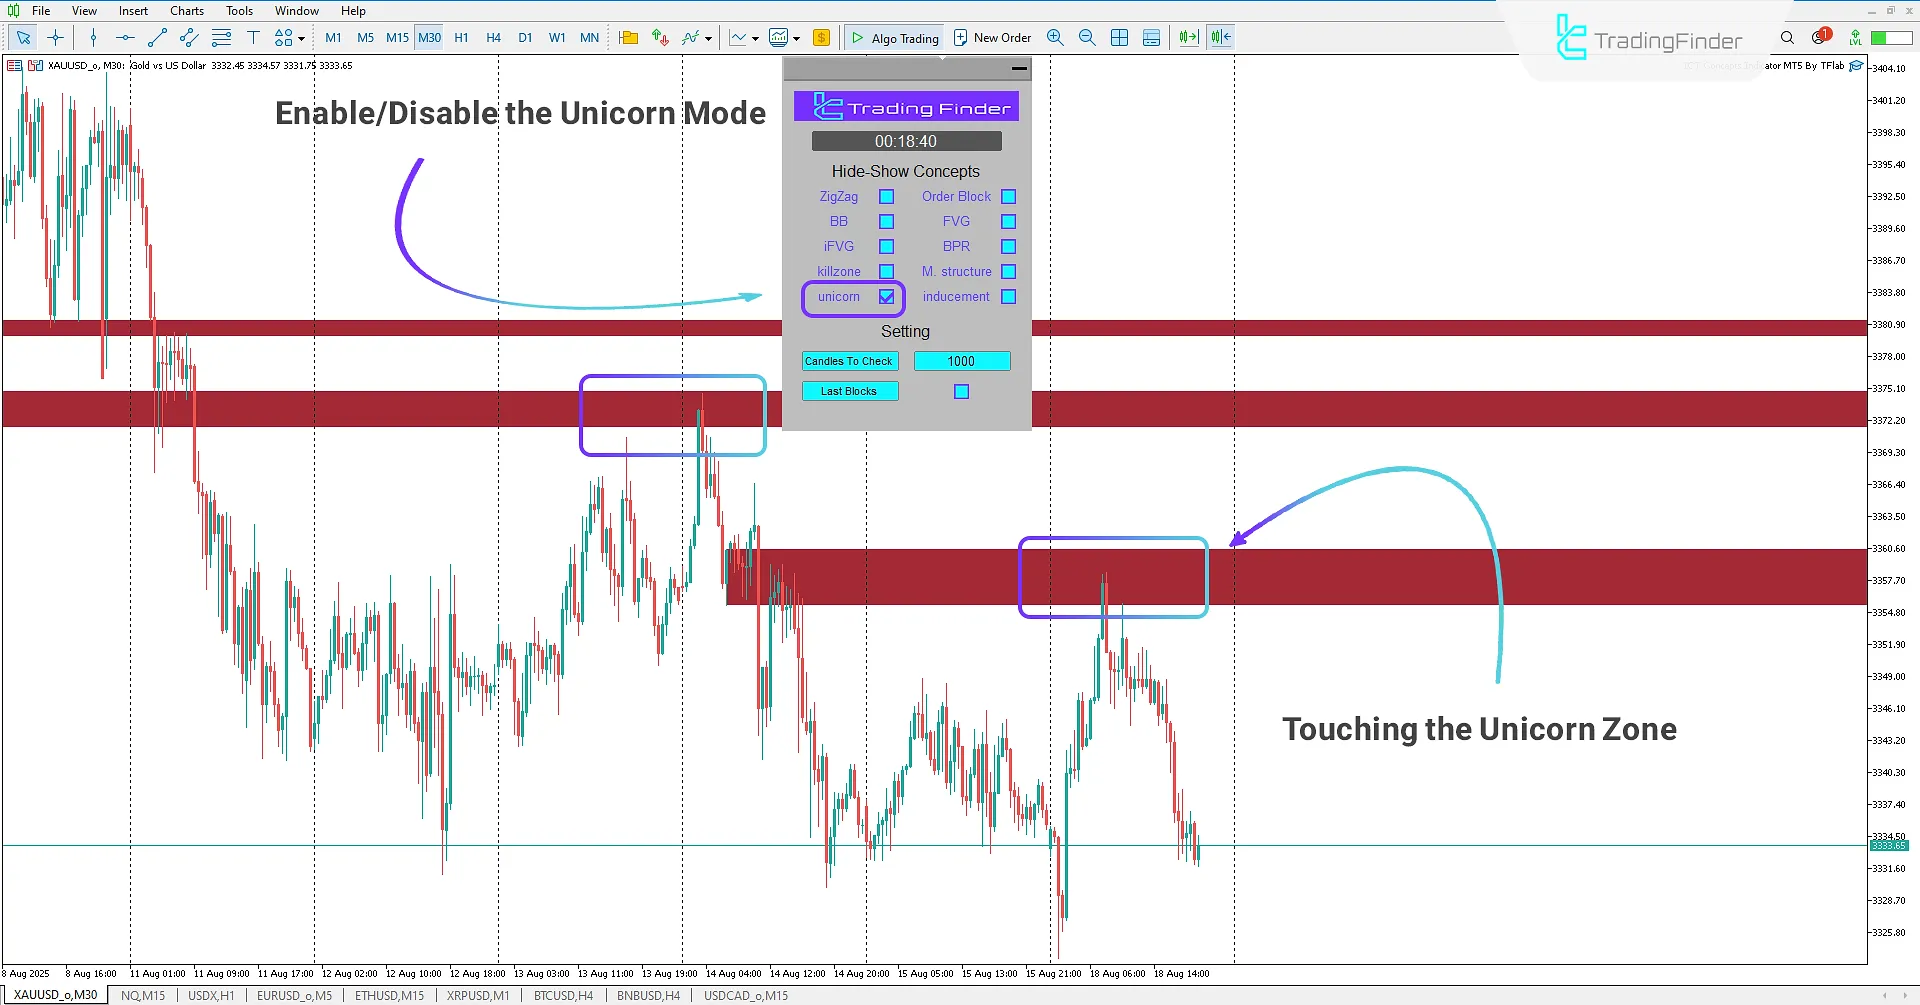
Unicorn Model
The Unicorn Model is formed based on several key parameters, including the structure of the Quasimodo (QM) pattern, the overlap of the Breaker Block, and the Fair Value Gap (FVG).
The combination of these factors makes this model a powerful and reliable zone for executing trades in the market.
By enabling the Unicorn mode, ICT-style traders can identify important price reaction zones and enter trades when the price reaches these areas.
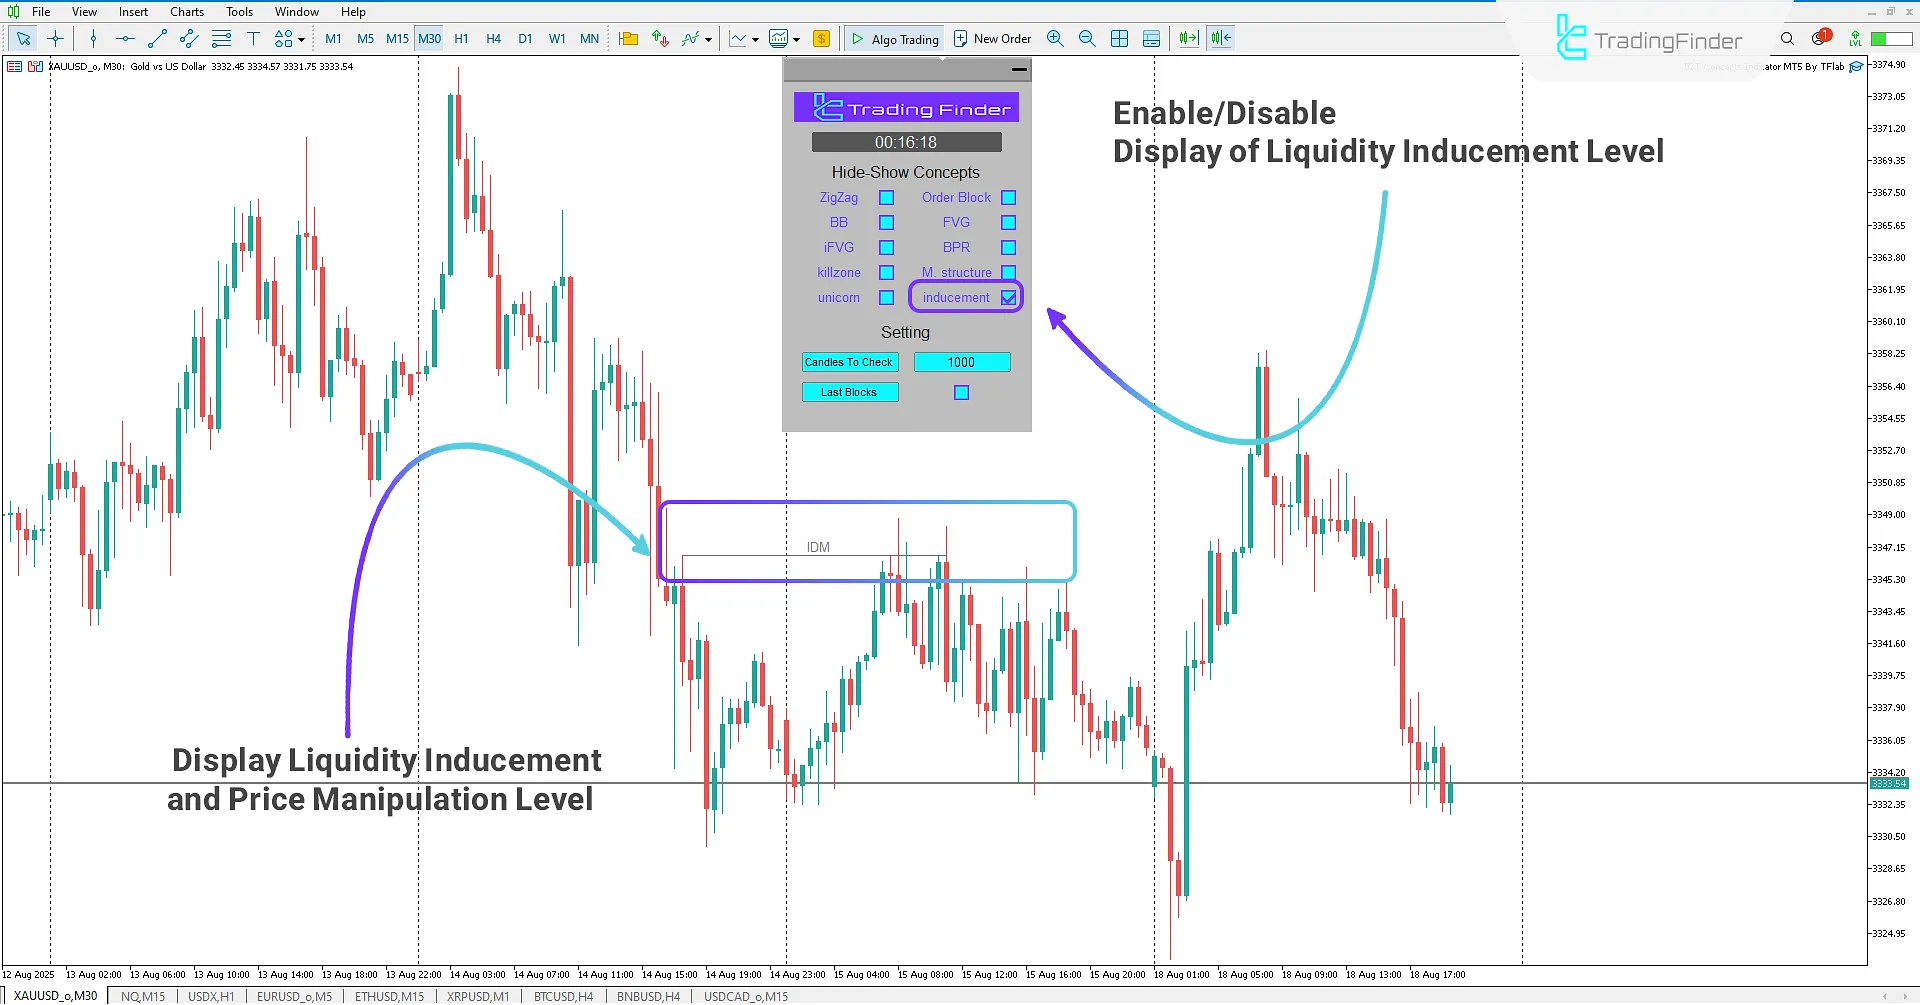
Identifying Liquidity Inducement
ICT-style traders can, by enabling the Inducement mode, identify liquidity inducement levels and track the footprints of Smart Money in the market.
These levels usually correspond to the locations of stop-losses and limit orders of retail traders. When Smart Money collects the hidden liquidity behind these levels, it initiates its main and powerful market move.
Indicator Settings
The following section contains the settings for the ICT Concepts indicator:
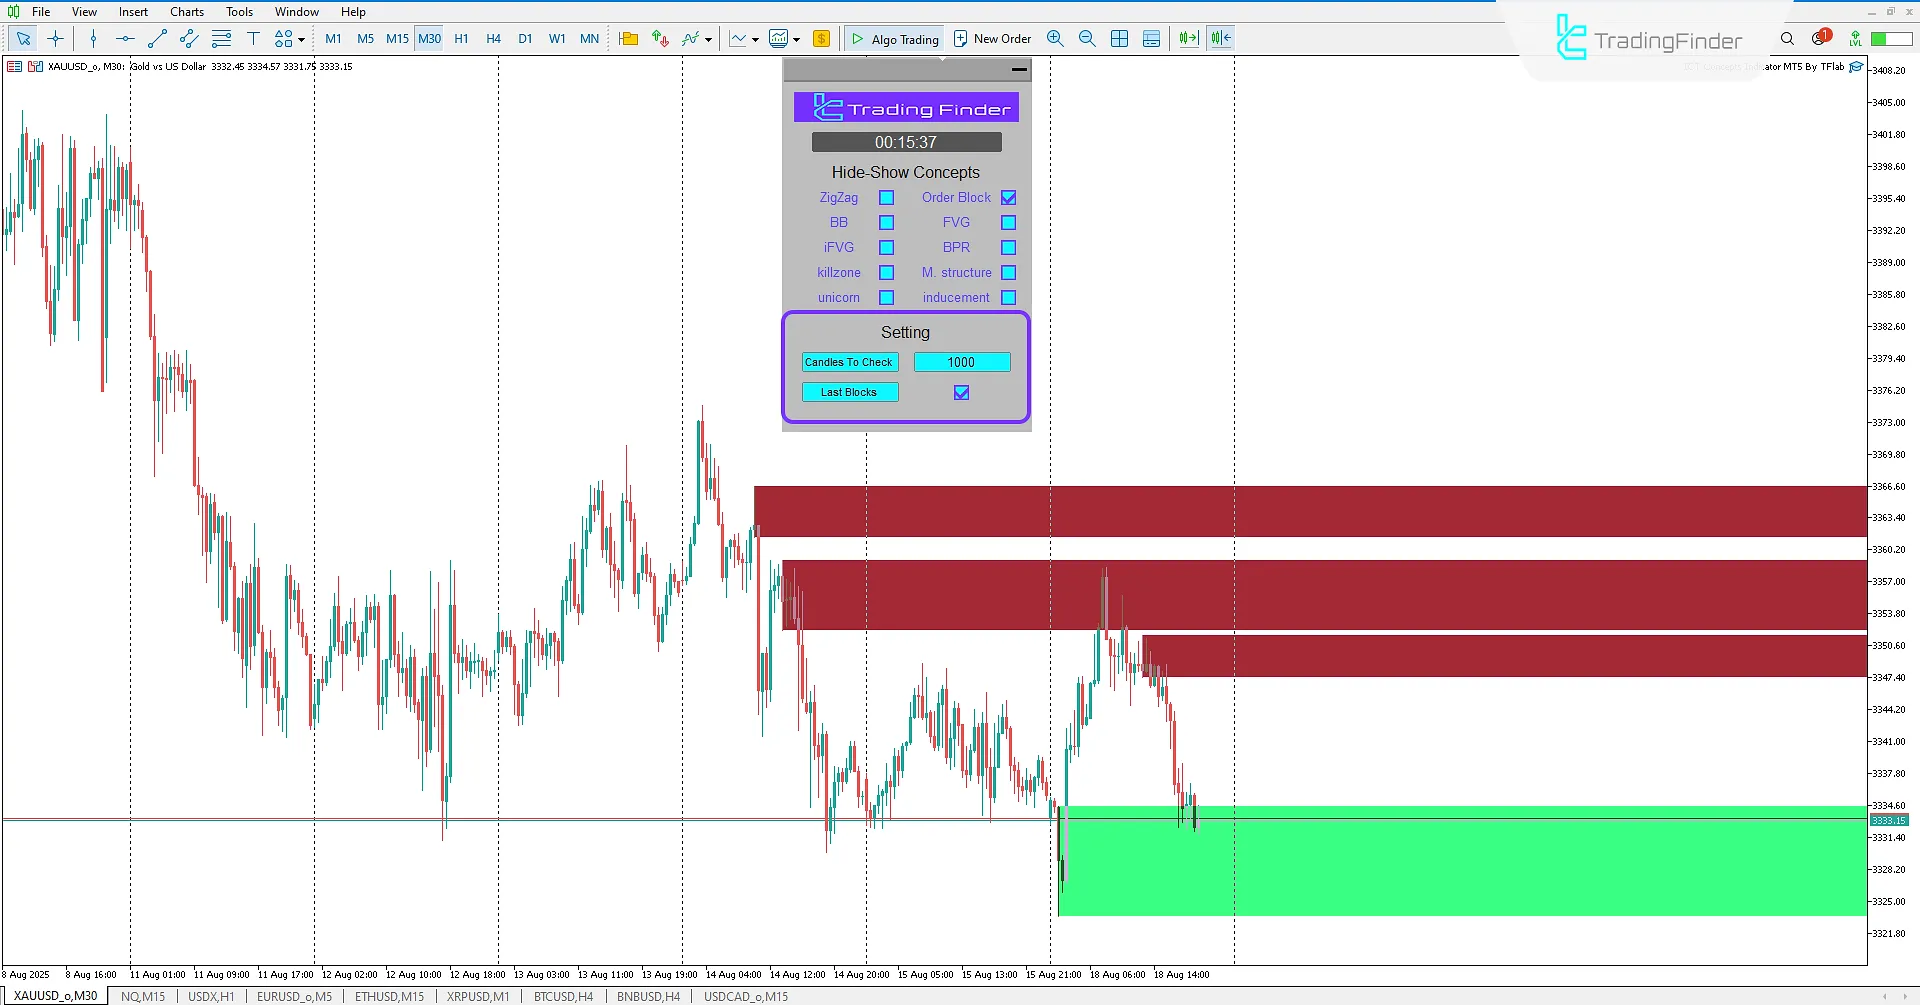
- Candles To Check: Set the number of candles used for concept detection
- Last Block: Toggle the display of the most recent zones
- Untested: Toggle the display of untested zones
Conclusion
The ICT Concepts Indicator is an all-in-one professional toolkit for traders following ICT and Smart Money strategies. By combining classical technical analysis with advanced ICT concepts, it enables the identification of optimal entries, thorough trend analysis, and high-probability trade forecasting.
With eight distinct analytical states in a professional and configurable panel, the indicator allows for in-depth, structured market evaluation.
Traders can track institutional footprints, smart money flows, and liquidity dynamics greatly enhancing their edge and success rate in financial markets.
ICT Concepts MT5 PDF
ICT Concepts MT5 PDF
Click to download ICT Concepts MT5 PDFWhat is the ICT Concepts Indicator, and which platform is it designed for?
It is a professional technical analysis tool developed specifically for MetaTrader 5, aligned with ICT and Smart Money methodologies.
Which core concepts are featured in the ICT Concepts Indicator?
Order Blocks, Fair Value Gaps, Breaker Blocks, Market Structure, Kill Zones, Zigzag Lines, Inverse FVGs, and Balanced Price Ranges.
What is the key advantage of this indicator for ICT traders?
It seamlessly merges traditional technical analysis with ICT theory, allowing for deeper insights and precise entry identification.
How does the indicator analyze Market Structure?
It highlights price movement patterns, focusing on BOS (Break of Structure) and CHOCH (Change of Character) to determine market trends and liquidity targets.
Thank you for your good work. This indicator works well on MT4 but it's not responding on MT5. What could be wrong? Kindly assist.

Hello, please watch our tutorial videos. The indicator output depends on market conditions and the settings configured. If you still have any issues, please contact our live chat support.
Hello, could you kindly furnish me with the license?
Hello,please contact our team on Telegram and WhatsApp.
Thank you for the ICT Concepts indicator, great job. Using your ICT concepts indicator.... i get a message saying "order block invalidated " for a red bearish order block when the candle closes below the bearish red order block Shouldn't this be the opposite? Can you confirm?
Hello, To review this issue, please send us a video of the situation and share it with our support team on Telegram or WhatsApp.


