![ICT Donchian Smart Money Structure Indicator MT5 – Free Download [TradingFinder]](https://cdn.tradingfinder.com/image/467115/2-110-en-ict-donchain-smart-money-structure-mt5-1.webp)
![ICT Donchian Smart Money Structure Indicator MT5 – Free Download [TradingFinder] 0](https://cdn.tradingfinder.com/image/467115/2-110-en-ict-donchain-smart-money-structure-mt5-1.webp)
![ICT Donchian Smart Money Structure Indicator MT5 – Free Download [TradingFinder] 1](https://cdn.tradingfinder.com/image/467126/2-110-en-ict-donchain-smart-money-structure-mt5-2.webp)
![ICT Donchian Smart Money Structure Indicator MT5 – Free Download [TradingFinder] 2](https://cdn.tradingfinder.com/image/467127/2-110-en-ict-donchain-smart-money-structure-mt5-3.webp)
![ICT Donchian Smart Money Structure Indicator MT5 – Free Download [TradingFinder] 3](https://cdn.tradingfinder.com/image/467128/2-110-en-ict-donchain-smart-money-structure-mt5-4.webp)
The ICT Donchian Smart Money Structure Indicator, by combining the Donchian channel, pivots, and Smart money concepts, dynamically analyzes market structure.
CHoCH lines indicate a change in price character and signal a possible trend reversal; once a new direction is confirmed, Break of Structure (BOS) is visualized through distinct lines. The indicator identifies key zones to determine high-probability entry points.
ICT Donchian Smart Money Structure Indicator Table
The general specifications of the ICT Donchian Smart Money Structure Indicator are presented in the table below.
Indicator Categories: | Smart Money MT5 Indicators Levels MT5 Indicators ICT MT5 Indicators |
Platforms: | MetaTrader 5 Indicators |
Trading Skills: | Advanced |
Indicator Types: | Breakout MT5 Indicators Reversal MT5 Indicators |
Timeframe: | Multi-Timeframe MT5 Indicators |
Trading Style: | Intraday MT5 Indicators |
Trading Instruments: | Forex MT5 Indicators Crypto MT5 Indicators Stock MT5 Indicators |
ICT Donchian Smart Money Structure Indicator Overview
The ICT-style Donchian Smart Money Structure Indicator utilizes 20-candle pivots to mark key reversal points on the chart accurately.
Successive breakouts of these pivots (typically 2–3 times) signal strong price movement and the occurrence of a Break of Structure (BOS). This leads to the formation of a structural gap, reflecting weakness in the existing market structure.
Uptrend Conditions
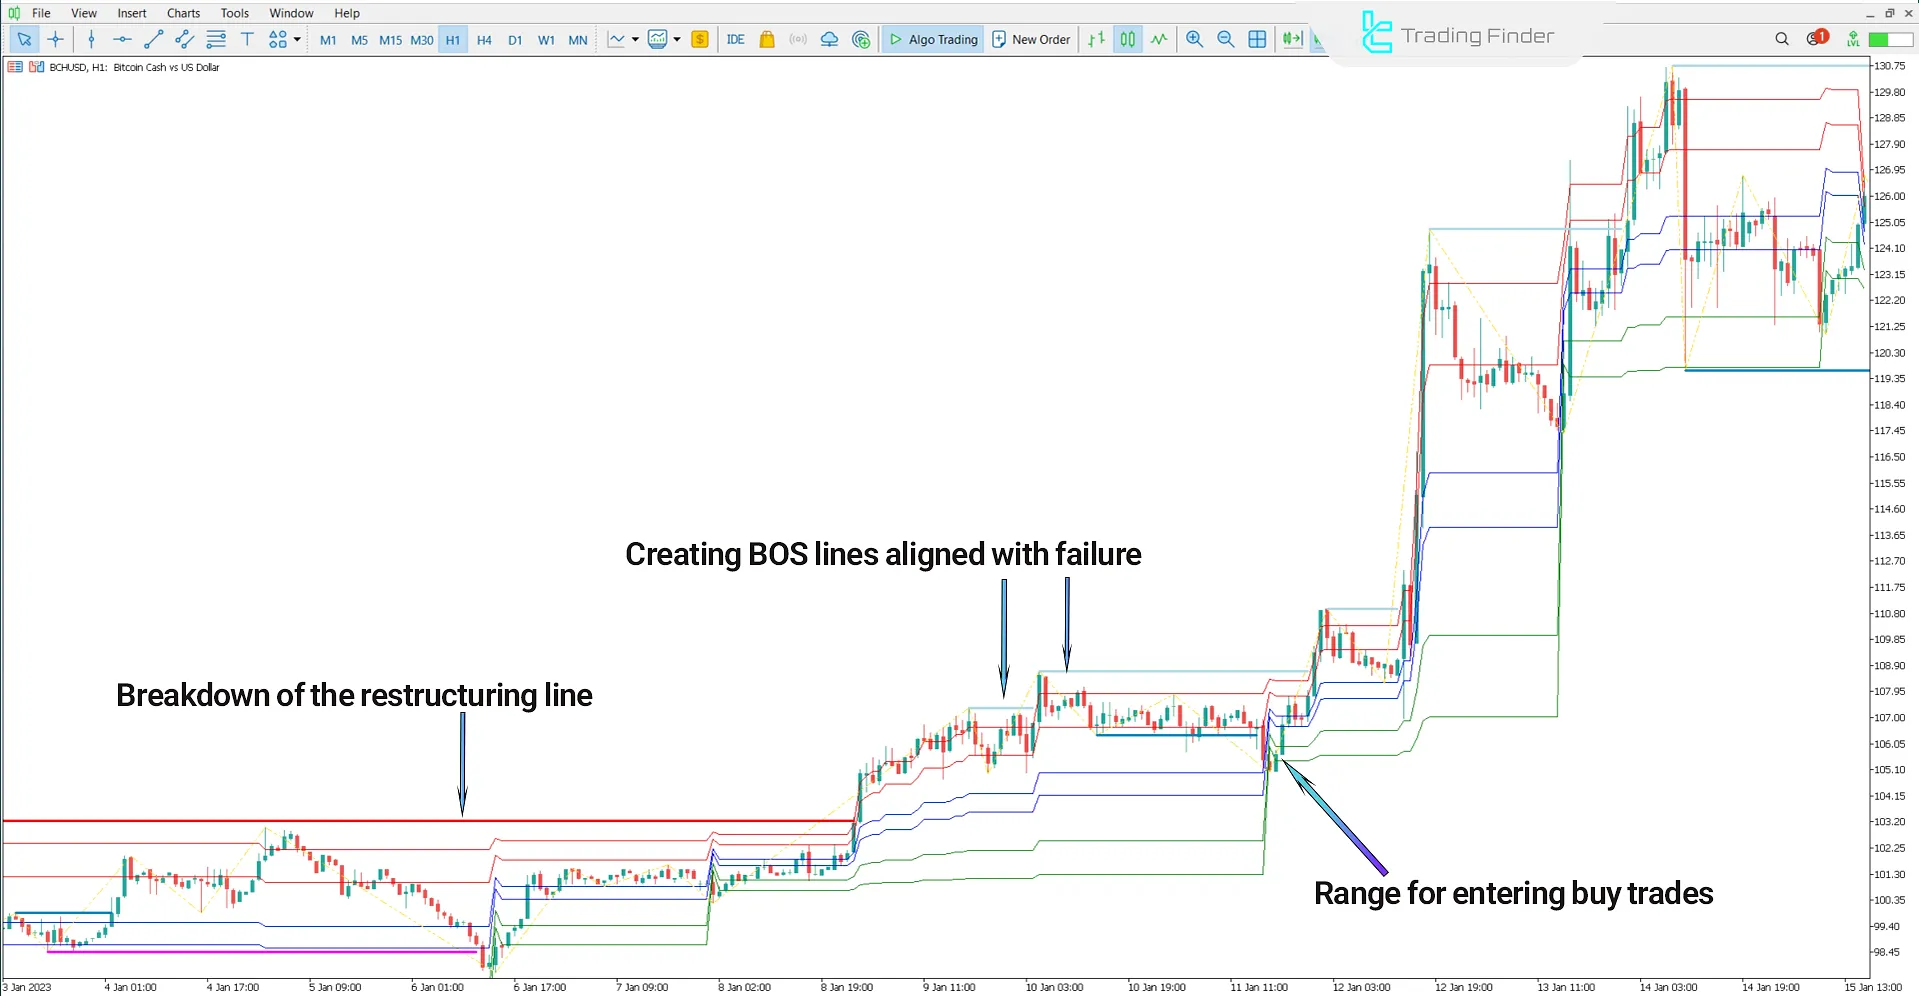
The chart below displays Bitcoin Cash (BCH/USD) on the 1-hour timeframe. During a downtrend, the breakout of the first minor high with a strong bullish candle is indicated by CHoCH, marking the beginning of a potential shift in market structure.
Following this, when a major high is confirmed without a new low, the Break of Structure(BOS) confirms the shift to a bullish phase. Consecutive breakouts of 20-candle pivots result in a structural gap, and the indicator highlights a buy entry zone in the "Discount" area.

Downtrend Conditions
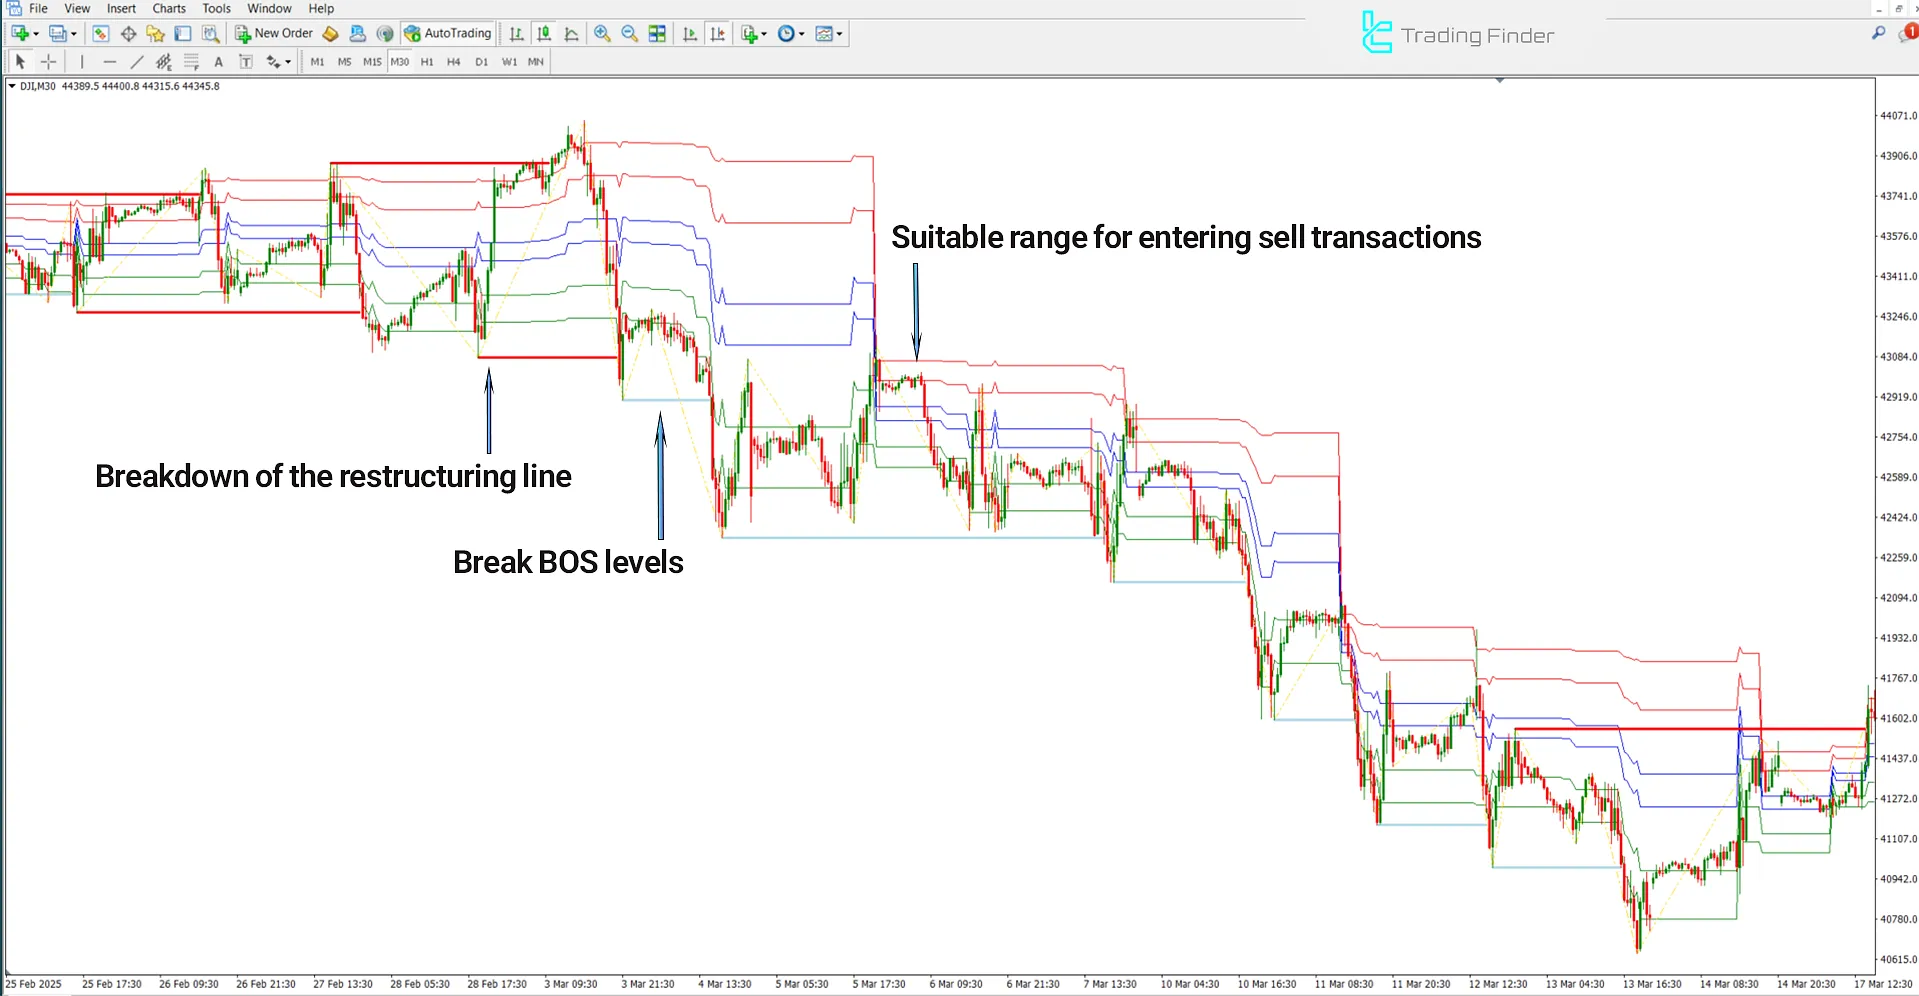
The following chart shows the Dow Jones Index (DJI) on the 30-minute timeframe. At the end of the uptrend, a CHoCH red line represents the potential structure change due to a lower low.
Upon forming a deeper low, the indicator draws the BOS line, confirming entry into the bearish phase. Breakouts of support pivots and the formation of a structural gap allow for a sell entry zone around the broken colored horizontal lines.

ICT Donchian Smart Money Structure Indicator Settings
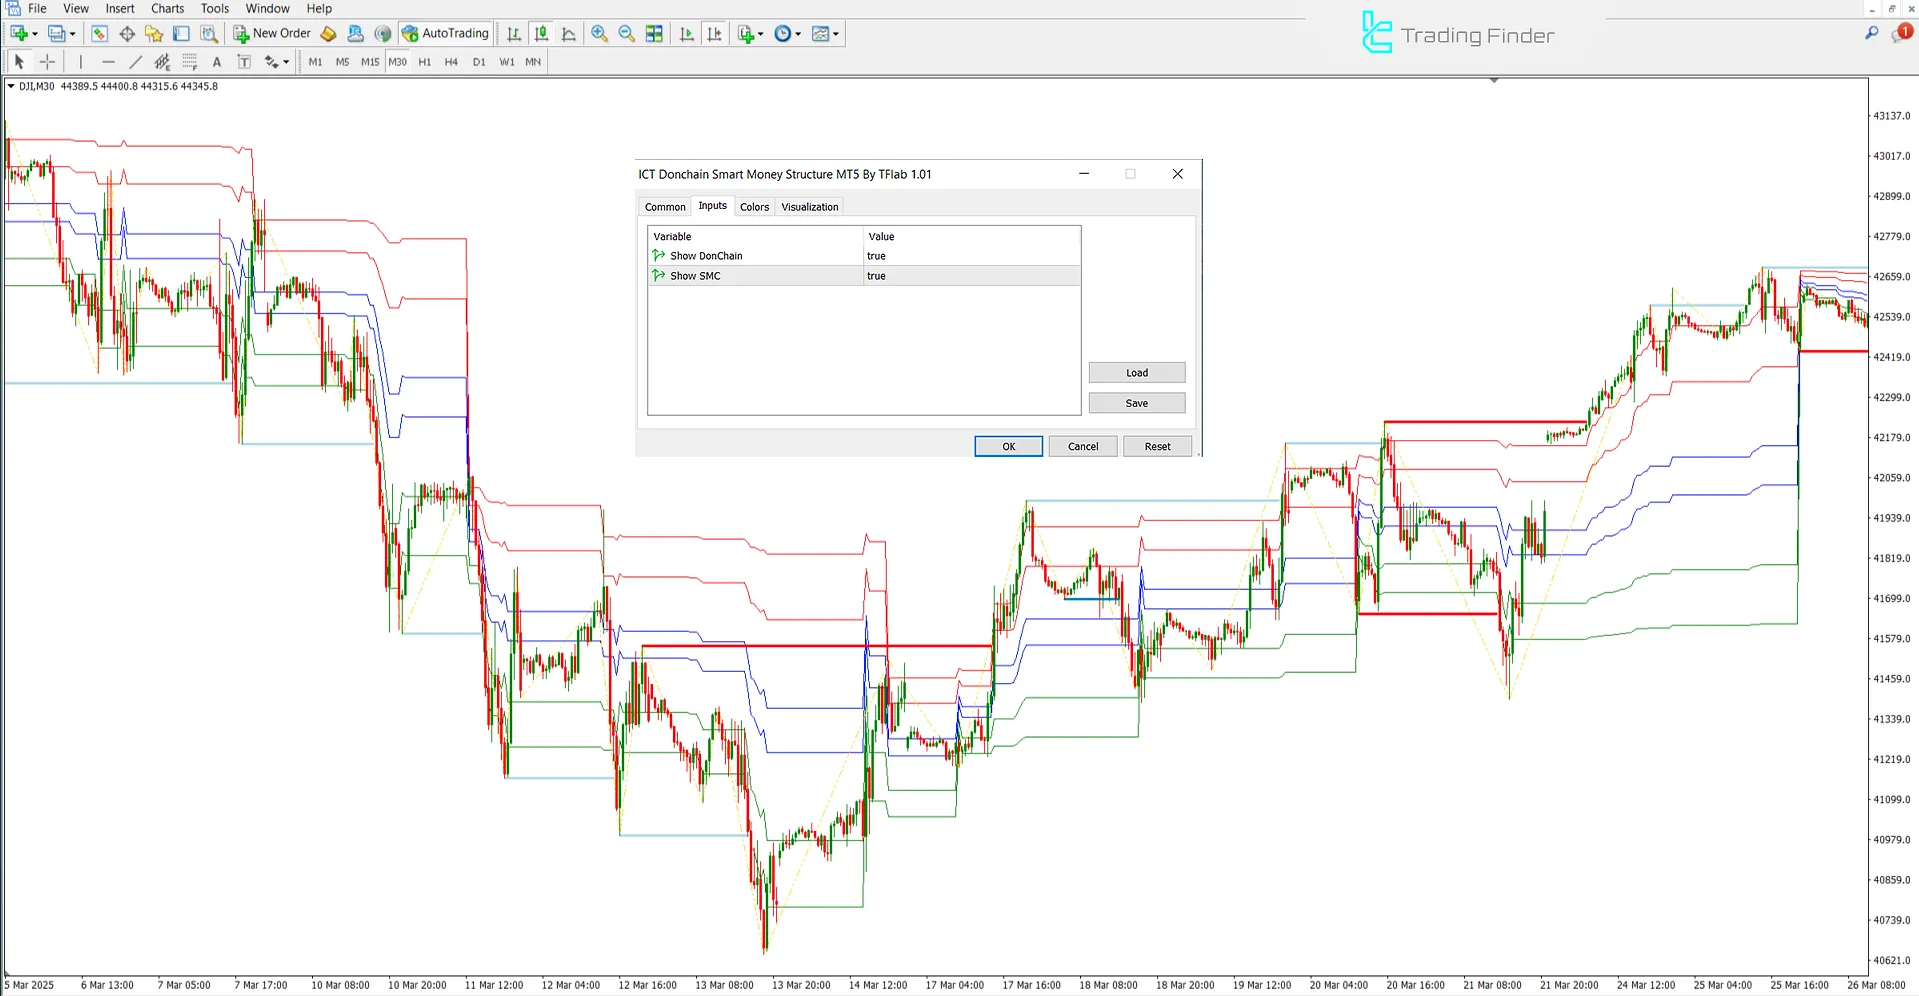
The settings panel of the ICT Donchian Smart Money Structure Indicator is shown below:

- Show DonChain: Displays the Donchian channel.
- Show SMC: Displays the Smart Money Structure.
Note: The Donchian channel can be turned off in the settings, allowing traders to focus solely on structural levels.
Conclusion
The ICT Donchian Smart Money Structure Indicator is an advanced tool for analyzing market structure based on the concepts of Smart Money.
By identifying CHoCH, BOS, pivot breakouts, and structural gaps, this tool detects key trend reversal points and suitable entry zones.
The integration of fractal structure with the Donchian channel offers a precise visualization of price action strength and weakness.
ICT Donchian Smart Money Structure MT5 PDF
ICT Donchian Smart Money Structure MT5 PDF
Click to download ICT Donchian Smart Money Structure MT5 PDFWhat is the difference between Break of Structure and Change of Character in the ICT Donchian Smart Money Structure Indicator?
In this indicator, BOS is shown with a light blue line, indicating a valid structural break and confirming the market's entry into a new trend (bullish or bearish). CHoCH, on the other hand, is considered only an early warning signal.
What is the primary role of Change of Character (CHoCH) in the ICT Donchian Smart Money Structure Indicator?
In this tool, CHoCH is visually marked with a red line and signifies an initial change in price structure, generally serving as a preliminary alert for a potential trend reversal.
Очень интересный индикатор нравится но зависает нужно постоянно переключать тайфрейм просьба наладить спасибо:)))


