![Implied FVG Indicator for MT5 Download - Free - [Trading Finder]](https://cdn.tradingfinder.com/image/165039/13-33-en-impliedfg-mt5-1.webp)
![Implied FVG Indicator for MT5 Download - Free - [Trading Finder] 0](https://cdn.tradingfinder.com/image/165039/13-33-en-impliedfg-mt5-1.webp)
![Implied FVG Indicator for MT5 Download - Free - [Trading Finder] 1](https://cdn.tradingfinder.com/image/165035/13-33-en-impliedfg-mt5-2.webp)
![Implied FVG Indicator for MT5 Download - Free - [Trading Finder] 2](https://cdn.tradingfinder.com/image/165037/13-33-en-impliedfg-mt5-3.webp)
![Implied FVG Indicator for MT5 Download - Free - [Trading Finder] 3](https://cdn.tradingfinder.com/image/165034/13-33-en-impliedfg-mt5-4.webp)
The Implied Fair Value Gap indicator is an advanced tool to detect hidden price gaps on the MetaTrader 5 platform.
This MT5 ICT indicator uses a unique approach by drawing two hypothetical lines at the 50% point of the shadows of adjacent candles, designating the space between these lines as the Implied fair value gap. An important note is that if the shadows of adjacent candles completely overlap, no hidden fair value gap will be formed.
Indicator Specifications Table
Indicator Categories: | Smart Money MT5 Indicators Liquidity Indicators MT5 Indicators ICT MT5 Indicators |
Platforms: | MetaTrader 5 Indicators |
Trading Skills: | Advanced |
Indicator Types: | Reversal MT5 Indicators |
Timeframe: | Multi-Timeframe MT5 Indicators |
Trading Style: | Intraday MT5 Indicators Scalper MT5 Indicators |
Trading Instruments: | Forex MT5 Indicators Crypto MT5 Indicators Stock MT5 Indicators Commodity MT5 Indicators Forward MT5 Indicators Share Stock MT5 Indicators |
Indicator Overview
The primary difference between the "Implied FVG" and the standard "FVG" lies in how they identify gaps. In a typical FVG, a gap forms when there is no movement between the price of the first and third candles.
However, an Implied FVG forms when the space between the first and third candles is covered only by the shadows of adjacent candles.
Conditions for an Uptrend
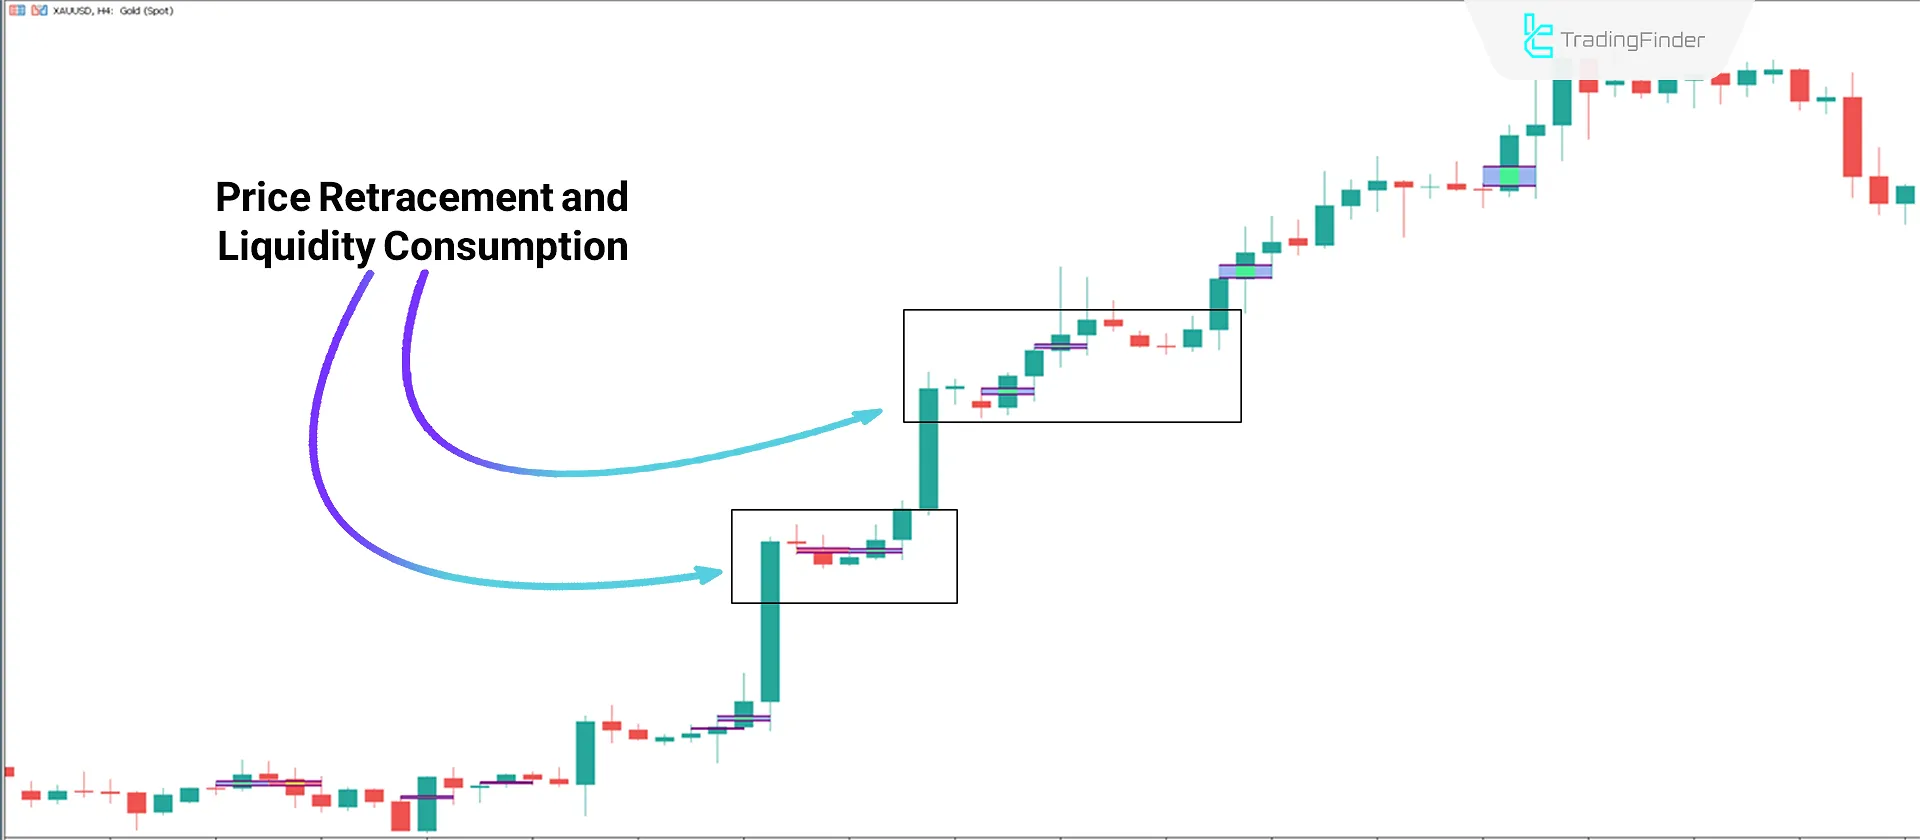
According to the 4-hour price chart of Gold against the US Dollar (XAU/USD), each time the price returns to the hidden fair value gaps and gathers the necessary liquidity, it fluctuates toward higher levels.
Price retracement points to these areas offering suitable entry opportunities.

Conditions for a Downtrend
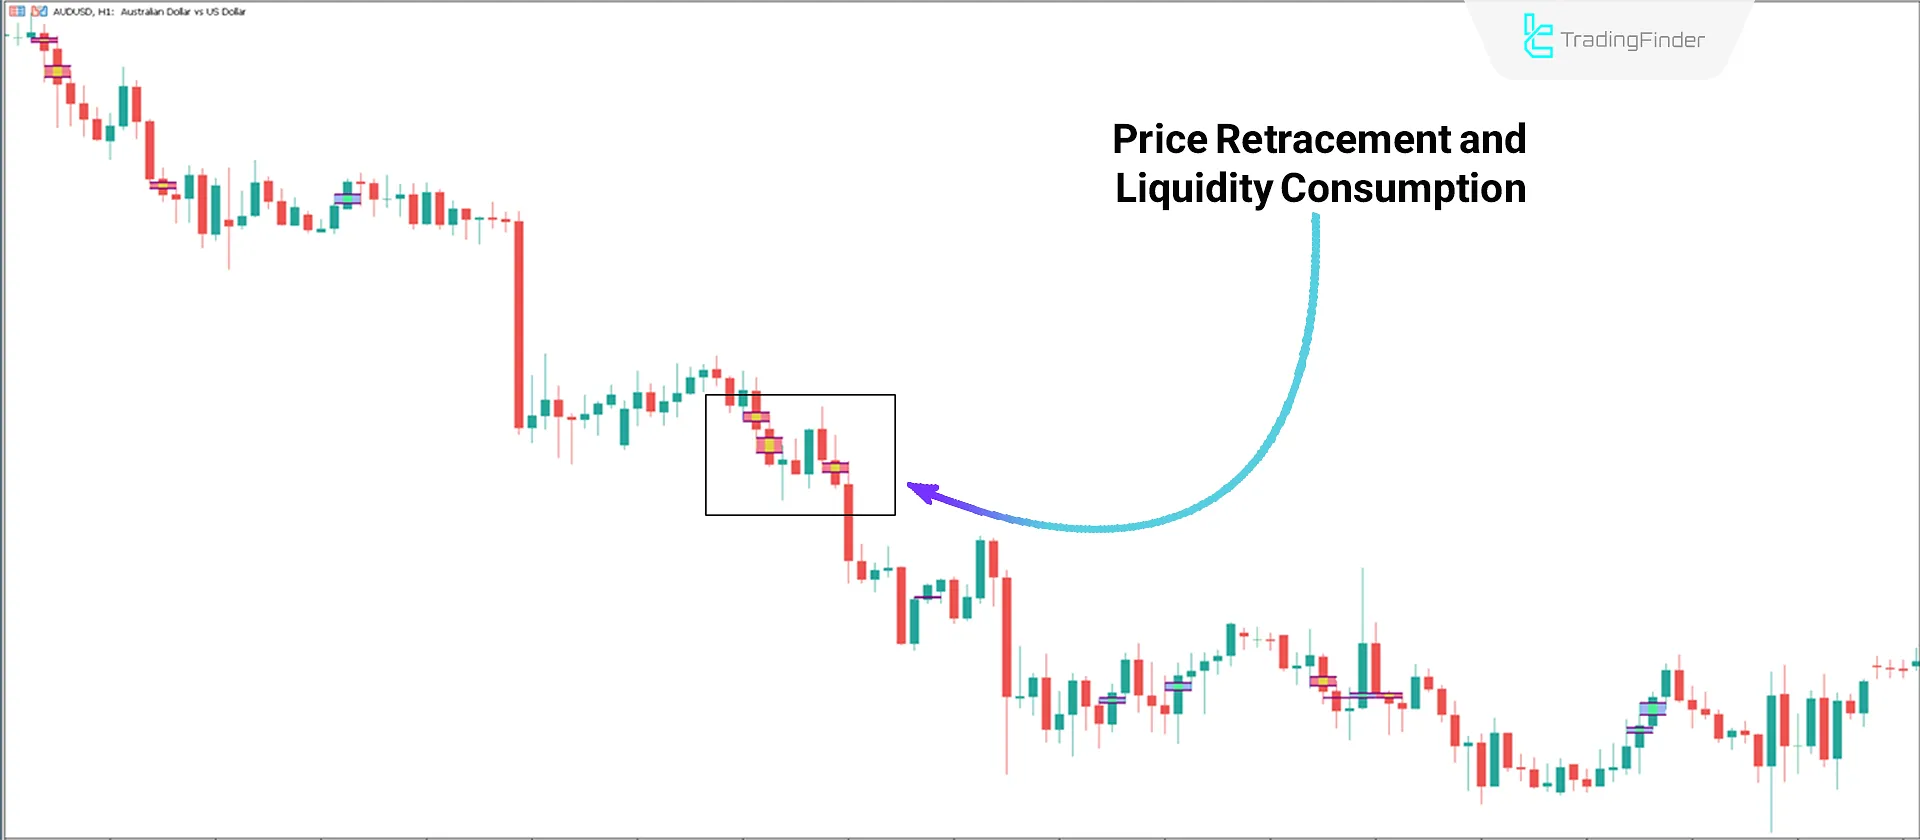
As shown in the 1-hour price chart of the Australian Dollar against the US Dollar (AUD/USD), each time the price returns to the hidden fair value gaps and gathers the necessary liquidity, it fluctuates toward lower levels.
Price retracement points to these areas and provides suitable entry opportunities.

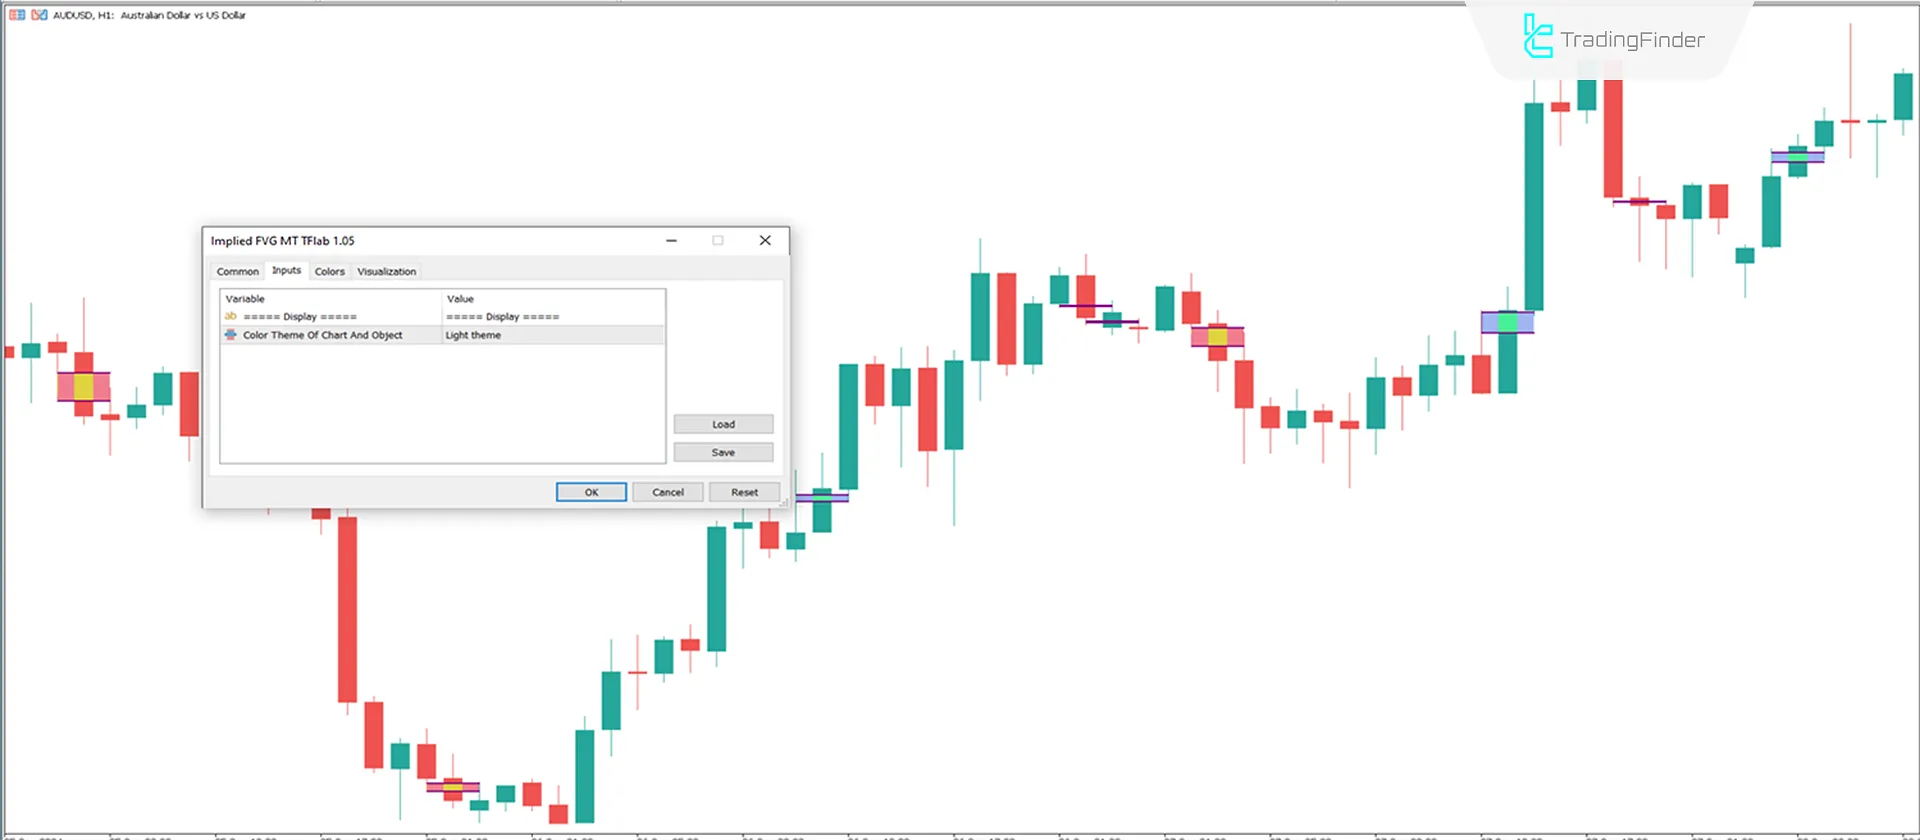
Indicator Settings

- Theme: Indicator theme.
Conclusion
The Implied FVG indicator in MetaTrader 5 identifies key price zones with a different approach compared to standard FVGs.
The key difference is that the Implied FVG uses a 50% overlap of adjacent candle shadows to identify these areas, whereas the standard FVG considers only the gap between adjacent candles.
Implied FVG MT5 PDF
Implied FVG MT5 PDF
Click to download Implied FVG MT5 PDFDoes this indicator also mark support and resistance areas?
No, this indicator does not specifically identify support and resistance areas, but the zones marked by the indicator can be considered support and resistance under appropriate conditions.
Does this indicator generate buy and sell signals?
No, this indicator provides no buy or sell entry/exit signals.


