![Inducement and Sweep ICT Indicator for MT5 Download – Free – [TradingFinder]](https://cdn.tradingfinder.com/image/126646/4-11-en-inducement-and-sweep-mt5-1.webp)
![Inducement and Sweep ICT Indicator for MT5 Download – Free – [TradingFinder] 0](https://cdn.tradingfinder.com/image/126646/4-11-en-inducement-and-sweep-mt5-1.webp)
![Inducement and Sweep ICT Indicator for MT5 Download – Free – [TradingFinder] 1](https://cdn.tradingfinder.com/image/126615/4-11-en-inducement-and-sweep-mt5-4.webp)
![Inducement and Sweep ICT Indicator for MT5 Download – Free – [TradingFinder] 2](https://cdn.tradingfinder.com/image/126614/4-11-en-inducement-and-sweep-mt5-3.webp)
![Inducement and Sweep ICT Indicator for MT5 Download – Free – [TradingFinder] 3](https://cdn.tradingfinder.com/image/126613/4-11-en-inducement-and-sweep-mt5-2.webp)
The Liquidity Hunt Indicator in Market Structure (MSIS) in MetaTrader 5 indicators identifiesprice-inducing movements in the market, such as Support or Resistance. This indicator detects points of deception or price traps.
When traders make poor decisions based on false signals, these movements often lead them into traps, resulting in financial losses.
Indicator Table
Indicator Categories: | Smart Money MT5 Indicators Liquidity Indicators MT5 Indicators ICT MT5 Indicators |
Platforms: | MetaTrader 5 Indicators |
Trading Skills: | Advanced |
Indicator Types: | Reversal MT5 Indicators |
Timeframe: | Multi-Timeframe MT5 Indicators |
Trading Style: | Scalper MT5 Indicators Day Trading MT5 Indicators |
Trading Instruments: | Forex MT5 Indicators Crypto MT5 Indicators Stock MT5 Indicators Forward MT5 Indicators Share Stock MT5 Indicators |
Indicator at a Glance
The MSIS indicator, by precisely identifying Change of Character (CHoCH), Break of Structure (BOS), Liquidity Zones, and Inducement (IDM), provides traders with a comprehensive view of market structure and trading opportunities. This tool is designed for Smart Money and ICT styles and is suitable for scalping and day trading in markets such as Forex and Cryptocurrencies.
The Liquidity Hunt Indicator shows how market makers use False Breakouts as traps to activate traders' Stop Loss levels.
Liquidity Hunt Indicator in an Uptrend
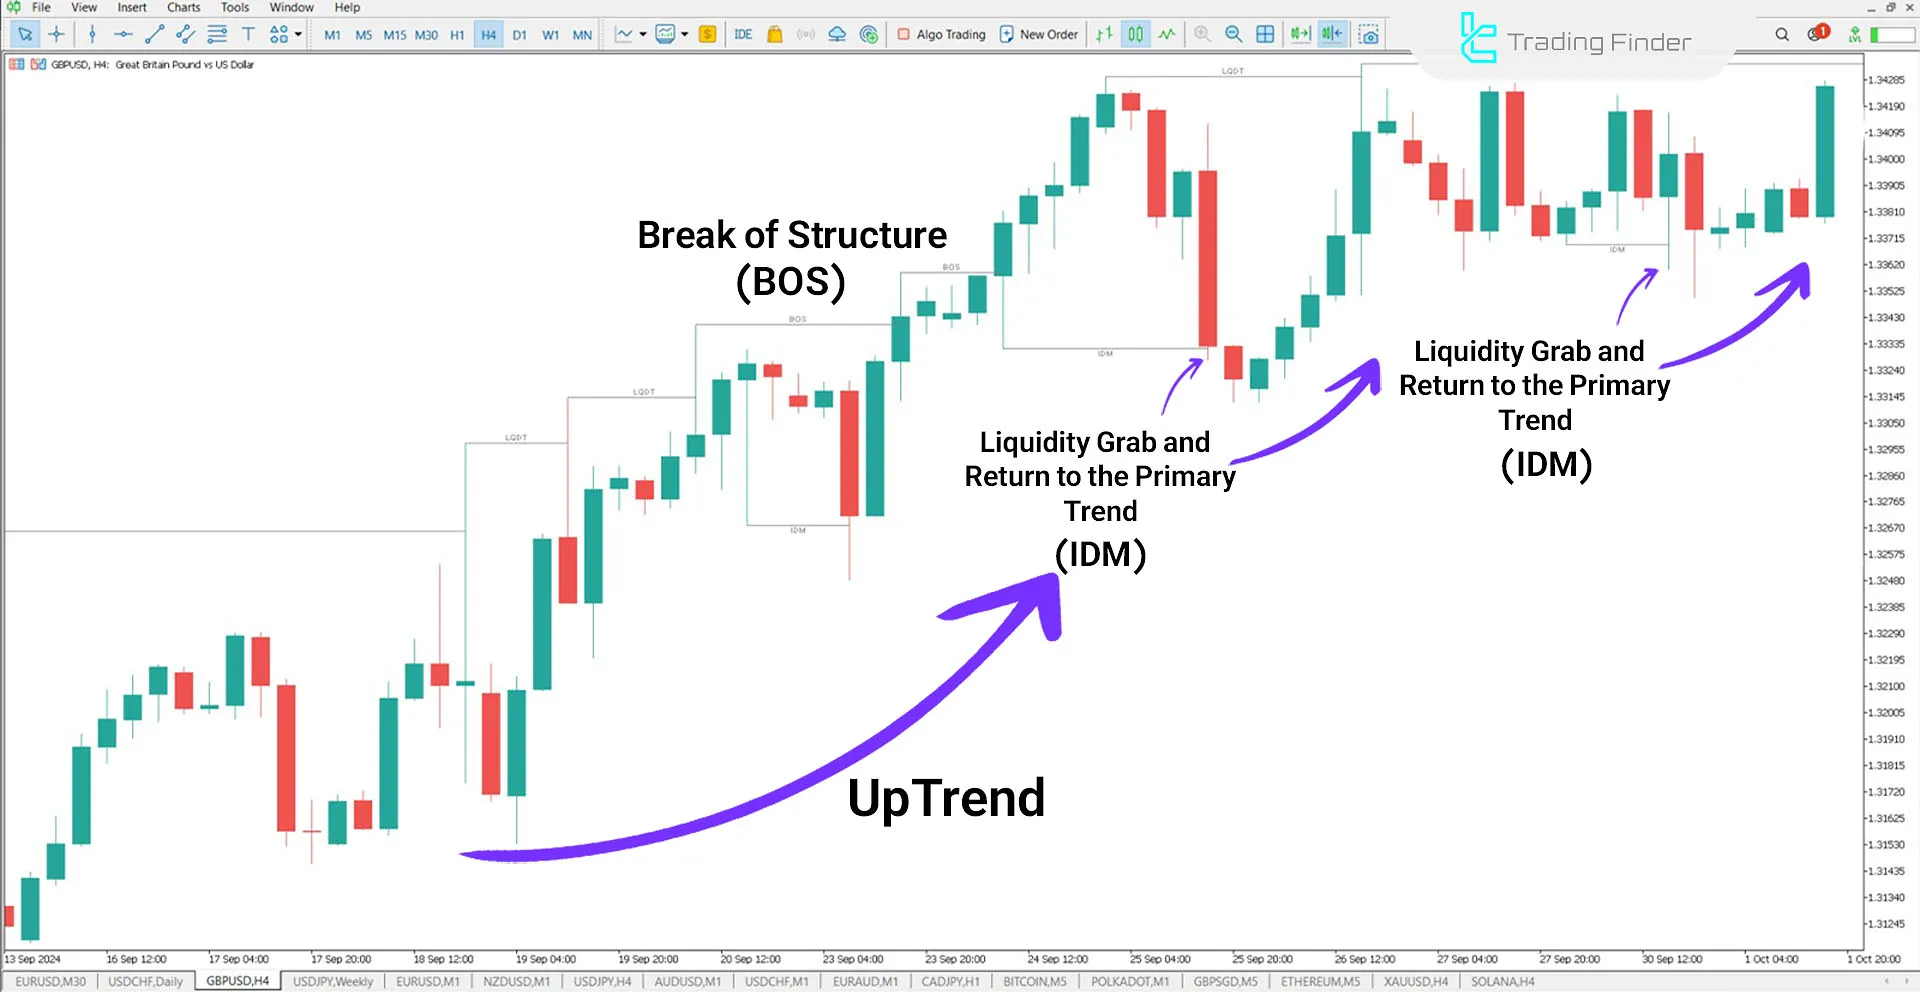
In an uptrend, the Liquidity Hunt Indicator identifies key areas such as Change of Character (CHoCH), Inducement Levels (IDM), and Break of Structure (BOS).
On the 4-hour price chart of the GBP/USD currency pair, the price resumes its uptrend after the liquidity hunt phase. These fluctuations enable traders to analyze price movements to determine suitable entry or exit points.

Liquidity Hunt Indicator in a Downtrend
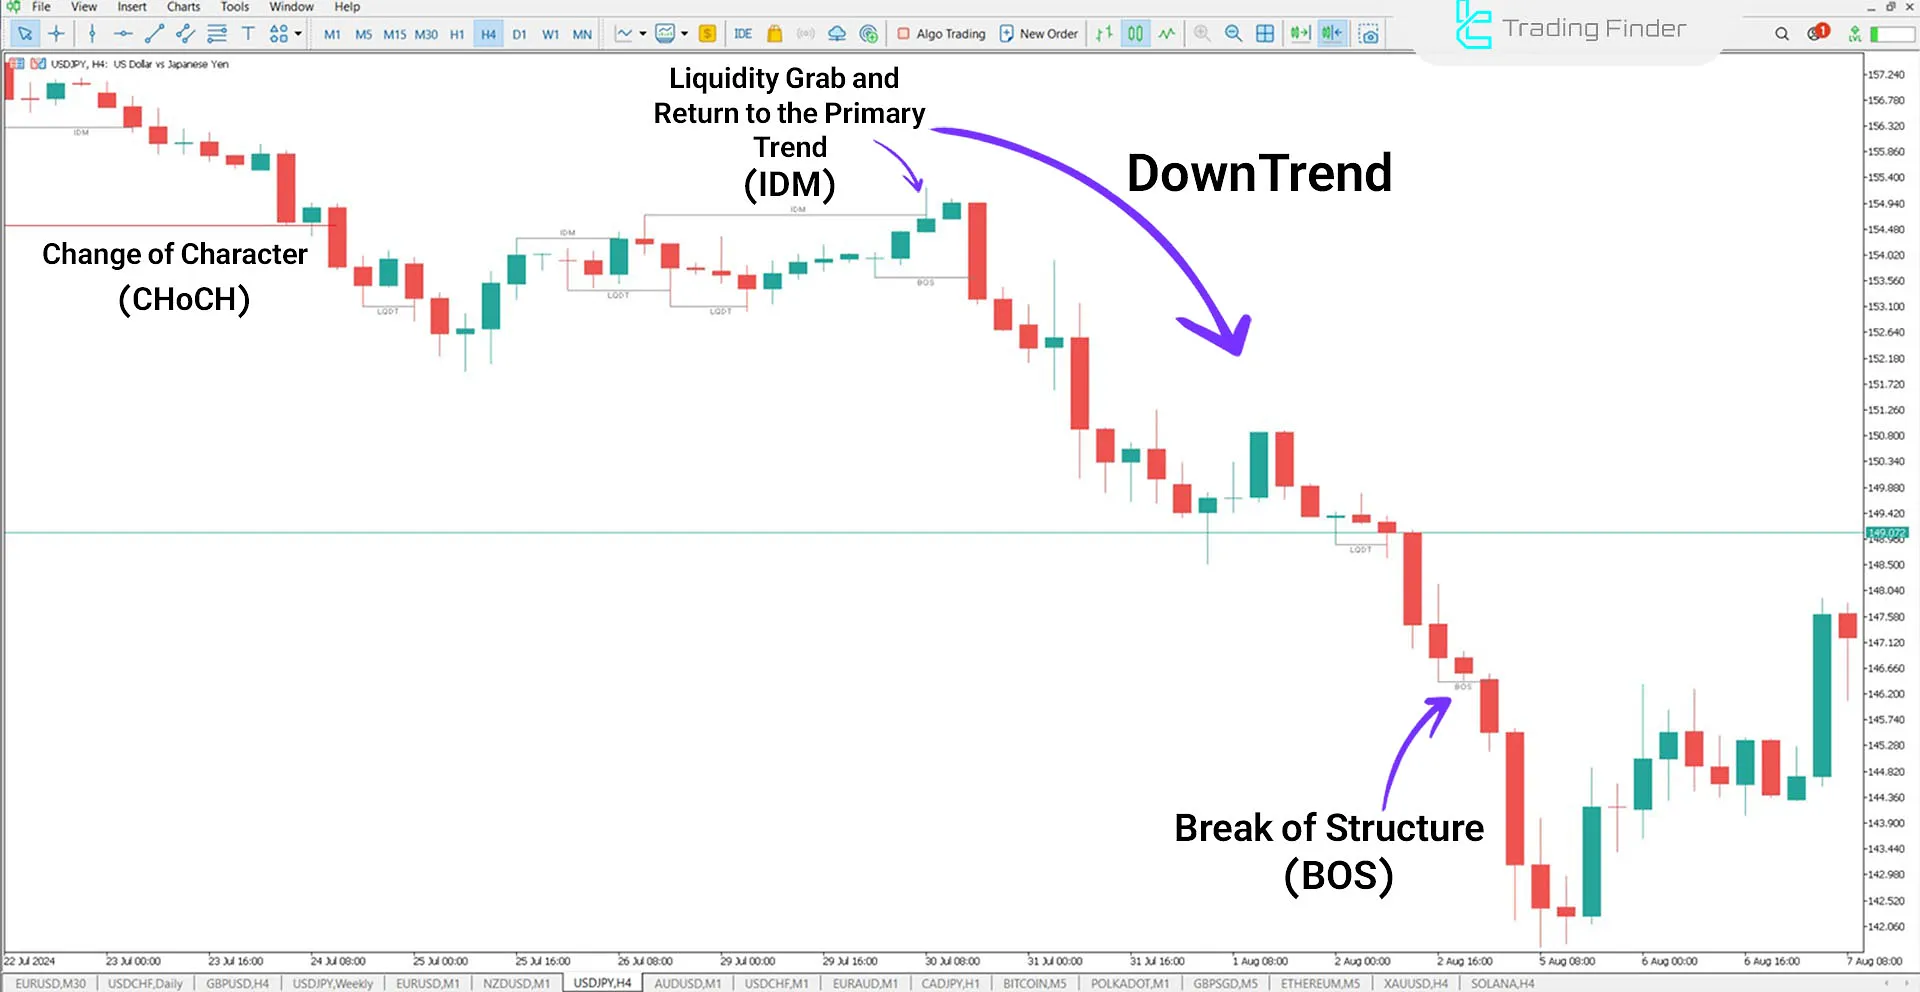
On the USD/JPY price chart, after a Change of Character (CHoCH), the price moves toward a liquidity hunt in a downtrend. This movement can create false stimuli for many traders who mistakenly enter short positions.
Following these fluctuations and liquidity accumulation, the price returns to its previous trend.

Indicator Settings

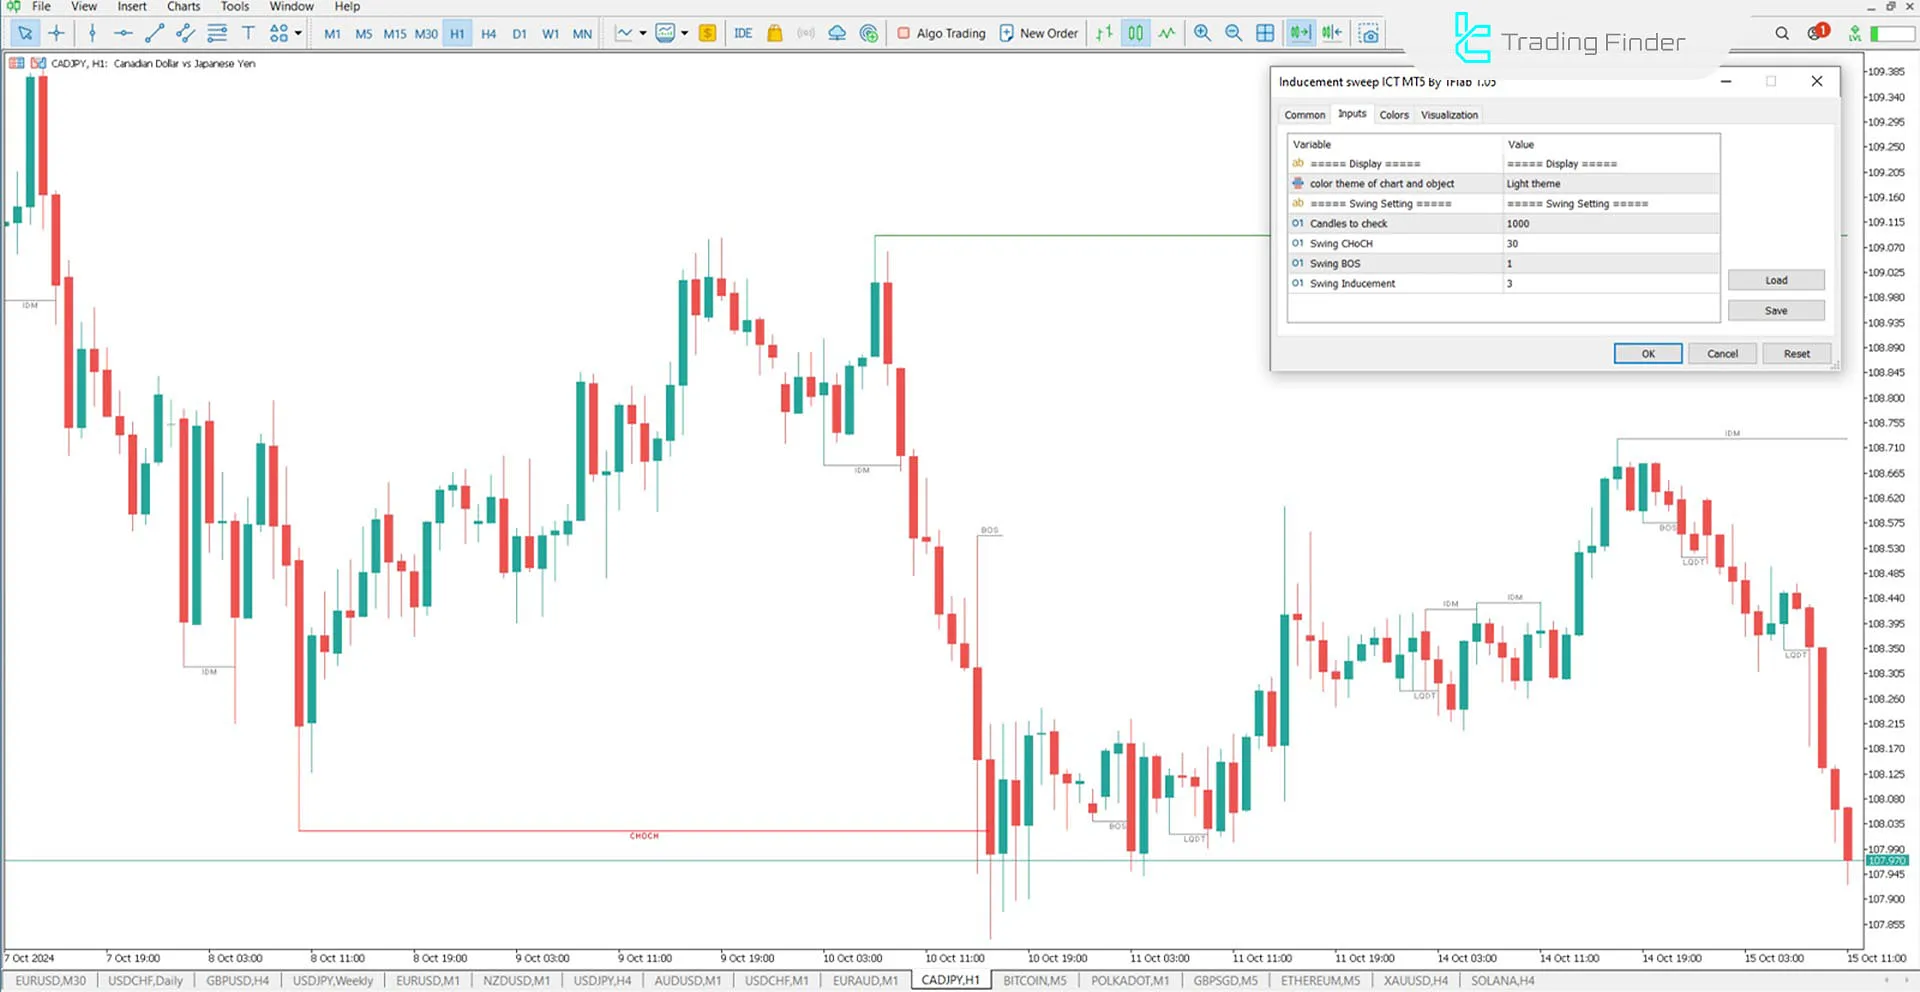
- Color theme of chart and object: Chart background color
- Candles to check: Number of return candles
- Swing CHoCH: Calculated Change of Character equals 30 candles to the left and right
- Swing BOS: Calculated break
- Swing inducement: Calculated inducement
Conclusion
The Market Structure and Liquidity Hunt (MSIS) indicator helps traders identify price movements that lead to liquidity accumulation. This indicator provides a comprehensive insight into trading opportunities by highlighting key points like Change of Character, Break of Structure and Inducement Zones.
Inducement Sweep ICT MT5 PDF
Inducement Sweep ICT MT5 PDF
Click to download Inducement Sweep ICT MT5 PDFWhat is the Liquidity Hunt Indicator (MSIS)?
A tool to identify price movements and liquidity accumulation.
How does this indicator assist traders?
By identifying suspicious price movements and deceptive points, the indicator enables traders to make better decisions when faced with unreal fluctuations.


