![Key Price Action Levels Indicator for MT5 Download - [TFlab]](https://cdn.tradingfinder.com/image/204656/2-15-en-key-pa-levels-mt5-1.webp)
![Key Price Action Levels Indicator for MT5 Download - [TFlab] 0](https://cdn.tradingfinder.com/image/204656/2-15-en-key-pa-levels-mt5-1.webp)
![Key Price Action Levels Indicator for MT5 Download - [TFlab] 1](https://cdn.tradingfinder.com/image/204651/2-15-en-key-pa-levels-mt5-2.webp)
![Key Price Action Levels Indicator for MT5 Download - [TFlab] 2](https://cdn.tradingfinder.com/image/204657/2-15-en-key-pa-levels-mt5-3.webp)
![Key Price Action Levels Indicator for MT5 Download - [TFlab] 3](https://cdn.tradingfinder.com/image/204650/2-15-en-key-pa-levels-mt5-4.webp)
The Key Price Action Levels Indicator in MetaTrader 5 operates based on Price Action analysis. This tool examines real price movements to identify and draw key levels (based on critical points).
These key levels include pivot points, rounded price levels, Fibonacci rounded levels, and support and resistance rounded levels.
Key PA Levels Indicator Specifications Table
Table below provides a brief guide to the specifications of the Key Price Action Levels Indicator:
Indicator Categories: | Support & Resistance MT5 Indicators Bands & Channels MT5 Indicators Levels MT5 Indicators |
Platforms: | MetaTrader 5 Indicators |
Trading Skills: | Intermediate |
Indicator Types: | Range MT5 Indicators Breakout MT5 Indicators |
Timeframe: | Multi-Timeframe MT5 Indicators |
Trading Style: | Day Trading MT4 Indicators |
Trading Instruments: | Forex MT5 Indicators Crypto MT5 Indicators Stock MT5 Indicators Commodity MT5 Indicators Indices MT5 Indicators Share Stock MT5 Indicators |
Indicator Overview
The Round Levels Indicator acts as support and resistance levels. When the price approaches these round levels, the likelihood of a reversal or a trend pause increases. These levels serve as potential reversal or breakout points as the price nears them.
Uptrend Conditions
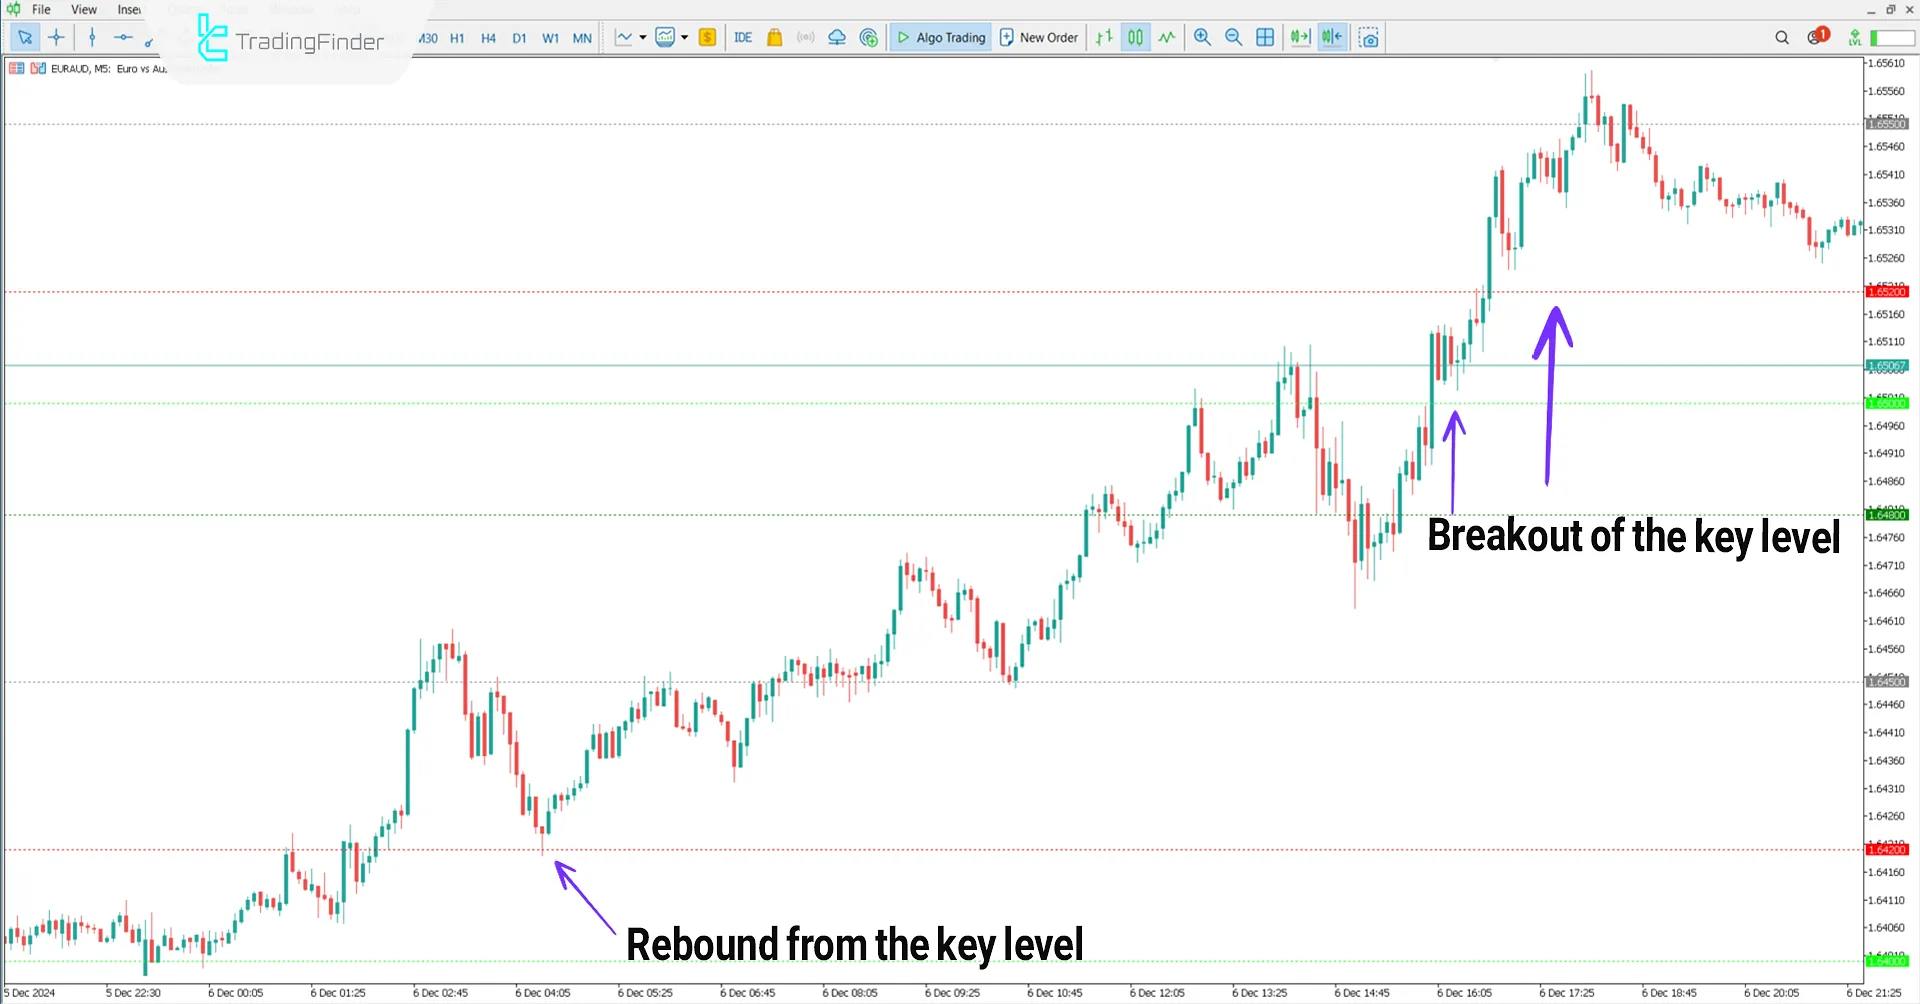
The chart below displays the EUR/AUD pair on a 5 minute timeframe. Given the limited movement range of currency pairs, when the price touches and breaks the key levels, the continuation of the trend is likely.
However, if the price reacts to these levels without breaking them, the probability of a trend reversal increases.

Downtrend Conditions
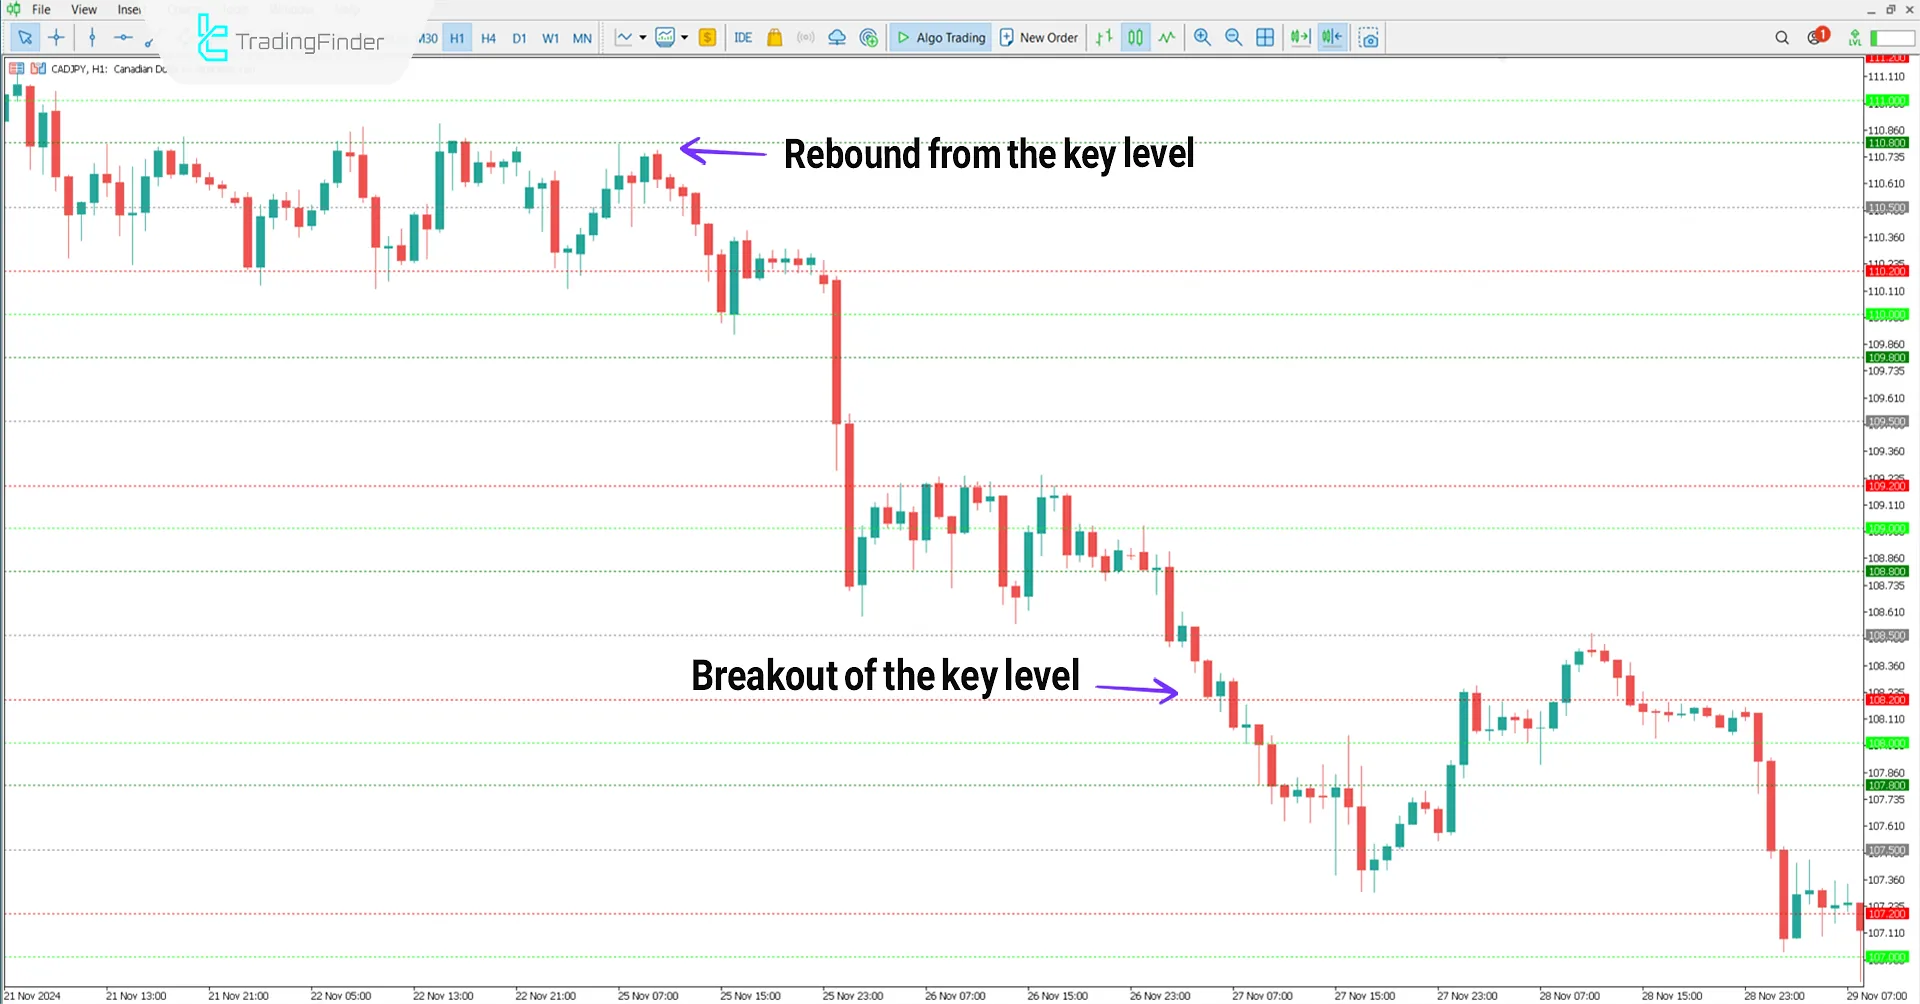
The image below shows the CAD/JPY pair on a 1 hour timeframe. Considering that currency pairs generally have a more limited range of movement compared to commodities and indices, using the Key Price Action Levels Indicator in higher timeframes offers greater accuracy and reliability.
If the rounded levels are broken, the trend continuation is likely; however, if the price fails to surpass these levels, the probability of a trend reversal increases.

Indicator Settings
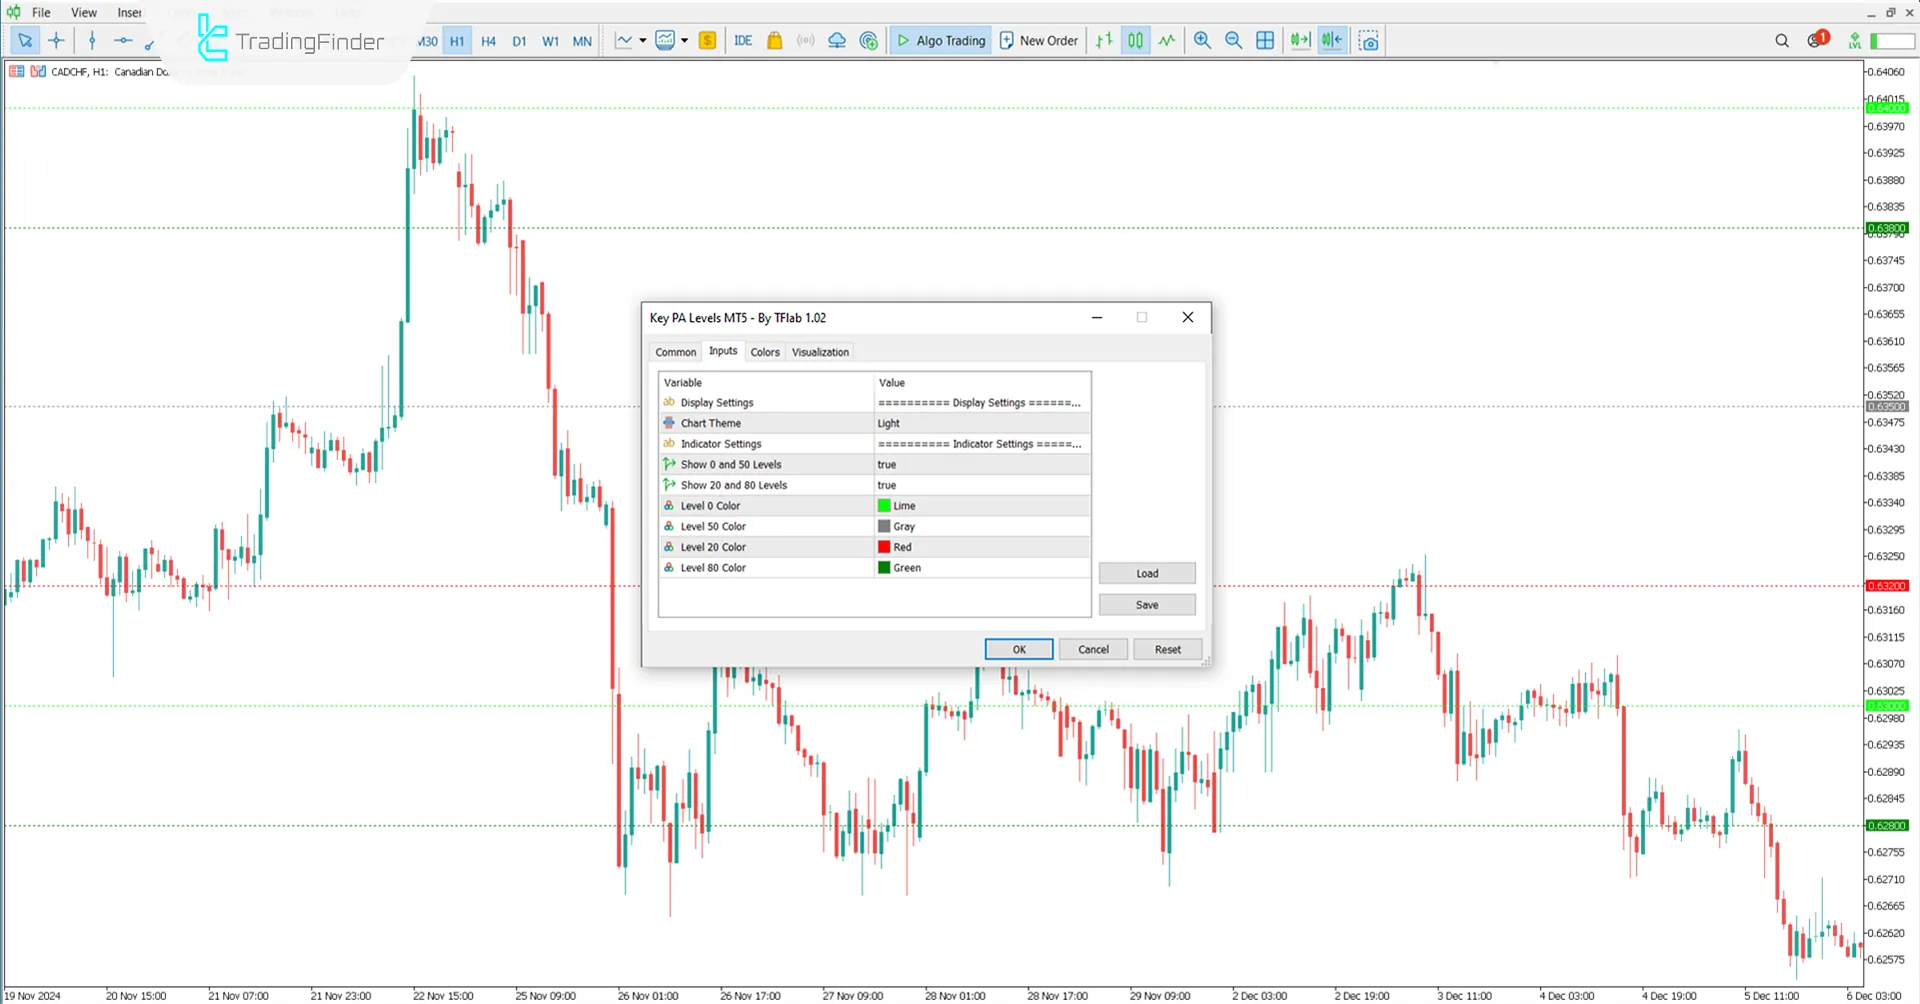
Image below demonstrates the full settings of the Key Price Action Levels Indicator for optimal use in MetaTrader 5 Indicator:

- Chart theme: Display Chart theme;
- Show 0 and 50 levels: Display 0 and 50 levels;
- Show 20 and 80 levels: Display 20 and 80 levels;
- Level 0 color: Level 0 color;
- Level 50 color: Level 50 color;
- Level 20 color: Level 20 color;
- Level 80 color: Level 80 color.
Conclusion
The Key PA Levels Indicator, as one of the support and resistance levels, is a practical analytical tool for financial markets applicable across all timeframes.
This tool identifies key price action levels using historical price data and directly displays them on the chart.
Key Price Action Levels MT5 PDF
Key Price Action Levels MT5 PDF
Click to download Key Price Action Levels MT5 PDFIs this tool suitable for identifying support and resistance levels?
Yes, the Key Price Action Levels Indicator provides not only pivot points but also Fibonacci rounded levels, rounded price levels, and support and resistance levels.
Can the Key Price Action Levels Indicator be used in a multi timeframe manner?
Yes, this tool supports multi-timeframe usage.


