![KG Support & Resistance Indicator for MT5 Download - Free - [TFlab]](https://cdn.tradingfinder.com/image/283704/13-69-en-kg-support-and-resistance-mt5-01.webp)
![KG Support & Resistance Indicator for MT5 Download - Free - [TFlab] 0](https://cdn.tradingfinder.com/image/283704/13-69-en-kg-support-and-resistance-mt5-01.webp)
![KG Support & Resistance Indicator for MT5 Download - Free - [TFlab] 1](https://cdn.tradingfinder.com/image/283702/13-69-en-kg-support-and-resistance-mt5-02.webp)
![KG Support & Resistance Indicator for MT5 Download - Free - [TFlab] 2](https://cdn.tradingfinder.com/image/283705/13-69-en-kg-support-and-resistance-mt5-03.webp)
![KG Support & Resistance Indicator for MT5 Download - Free - [TFlab] 3](https://cdn.tradingfinder.com/image/283703/13-69-en-kg-support-and-resistance-mt5-04.webp)
The KG Support & Resistance Indicator is one of the trading assist indicators in MT5. With its customized settings, this indicator displays support and resistance zones from different timeframes in distinct colors on the chart.
The plotted levels are highly significant for analysts as price frequently reacts at these zones. However, it should be noted that once these levels are broken, they lose their validity and will no longer be drawn on the chart.
KG Support & Resistance Indicator Settings Table
The features and capabilities of the KG Support & Resistance indicator include the following.
Indicator Categories: | Support & Resistance MT5 Indicators Trading Assist MT5 Indicators Levels MT5 Indicators |
Platforms: | MetaTrader 5 Indicators |
Trading Skills: | Elementary |
Indicator Types: | Breakout MT5 Indicators Reversal MT5 Indicators |
Timeframe: | Multi-Timeframe MT5 Indicators |
Trading Style: | Scalper MT5 Indicators Day Trading MT5 Indicators |
Trading Instruments: | Forex MT5 Indicators Crypto MT5 Indicators Stock MT5 Indicators Commodity MT5 Indicators Forward MT5 Indicators |
Indicator at a Glance
This indicator allows users to customize support and resistance levels. Four different timeframes can be selected to display these levels in the settings section. Additionally, options for modifying the zones' color, shape, and display type are available.
The KG indicator’s support and resistance zones appear simultaneously across all timeframes.
Uptrend Conditions
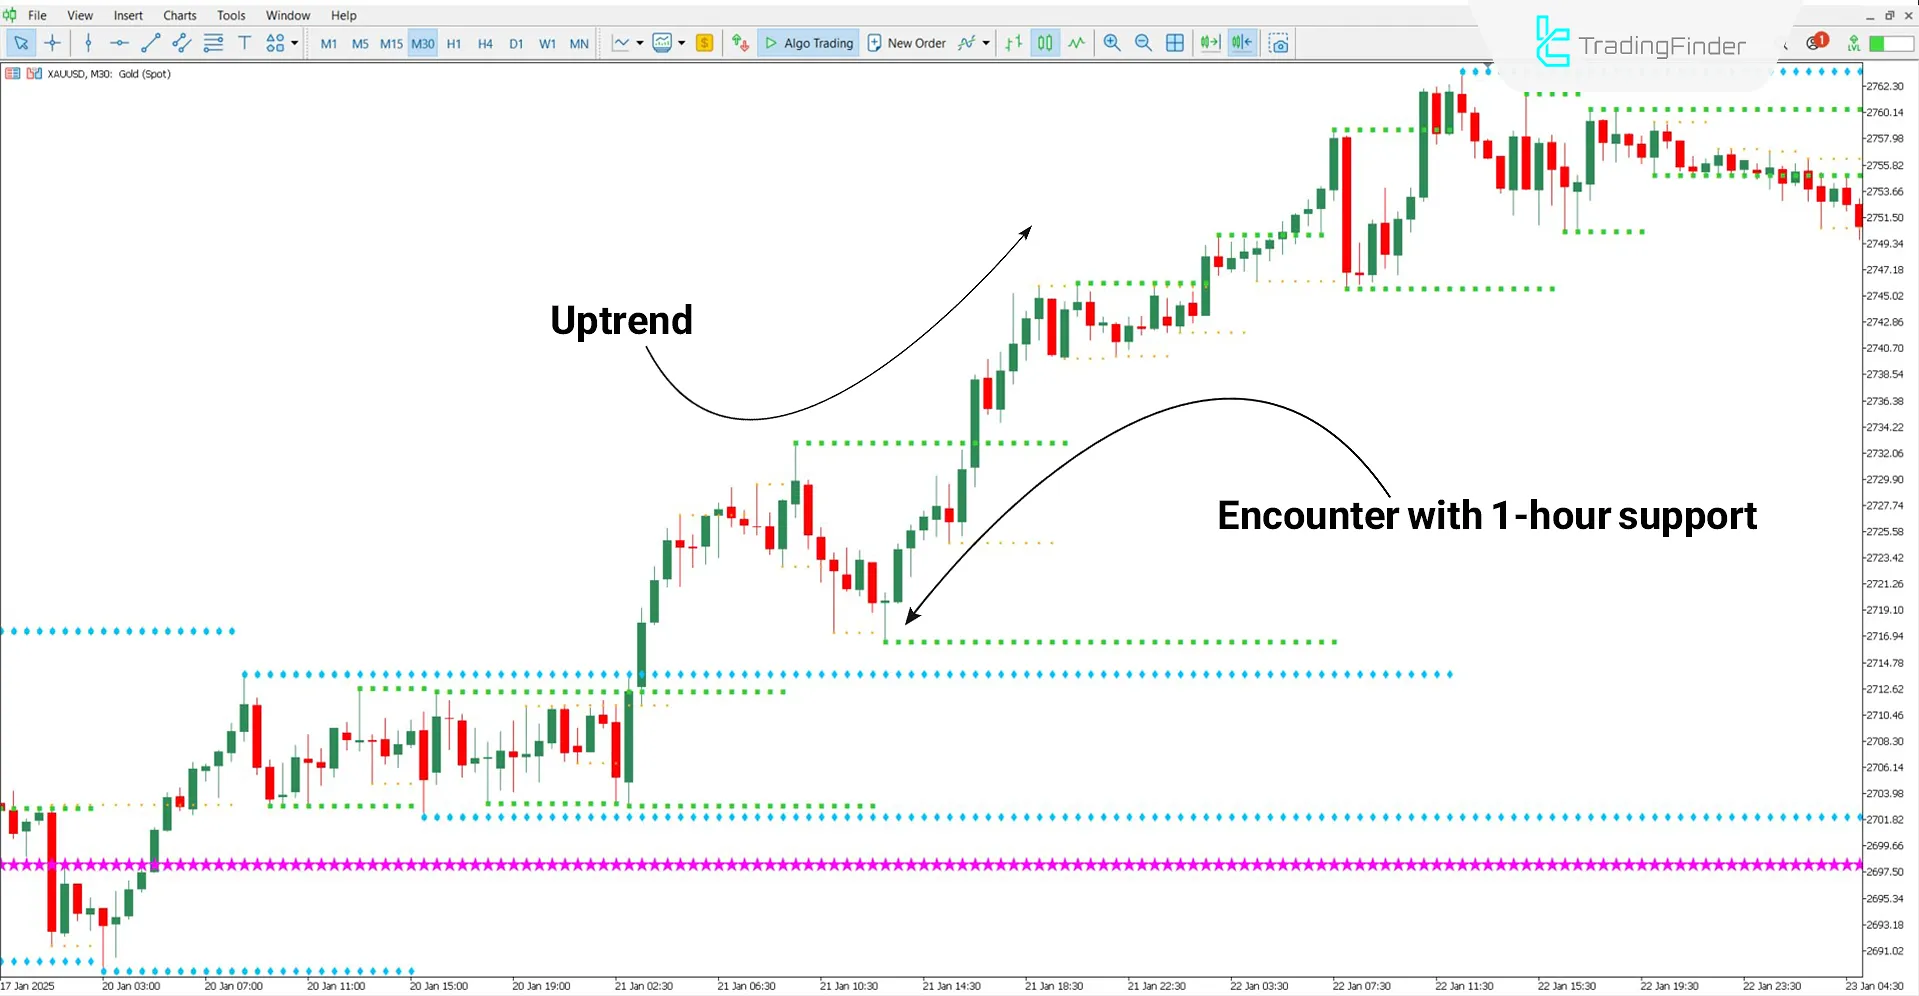
An analysis of the 30-minute Gold to US Dollar (XAU/USD) chart shows that the levels drawn by This indicator have played a significant support role.
The price initially touched the 1-hour support zone (light green) and subsequently moved into a bullish trend.

Downtrend Conditions
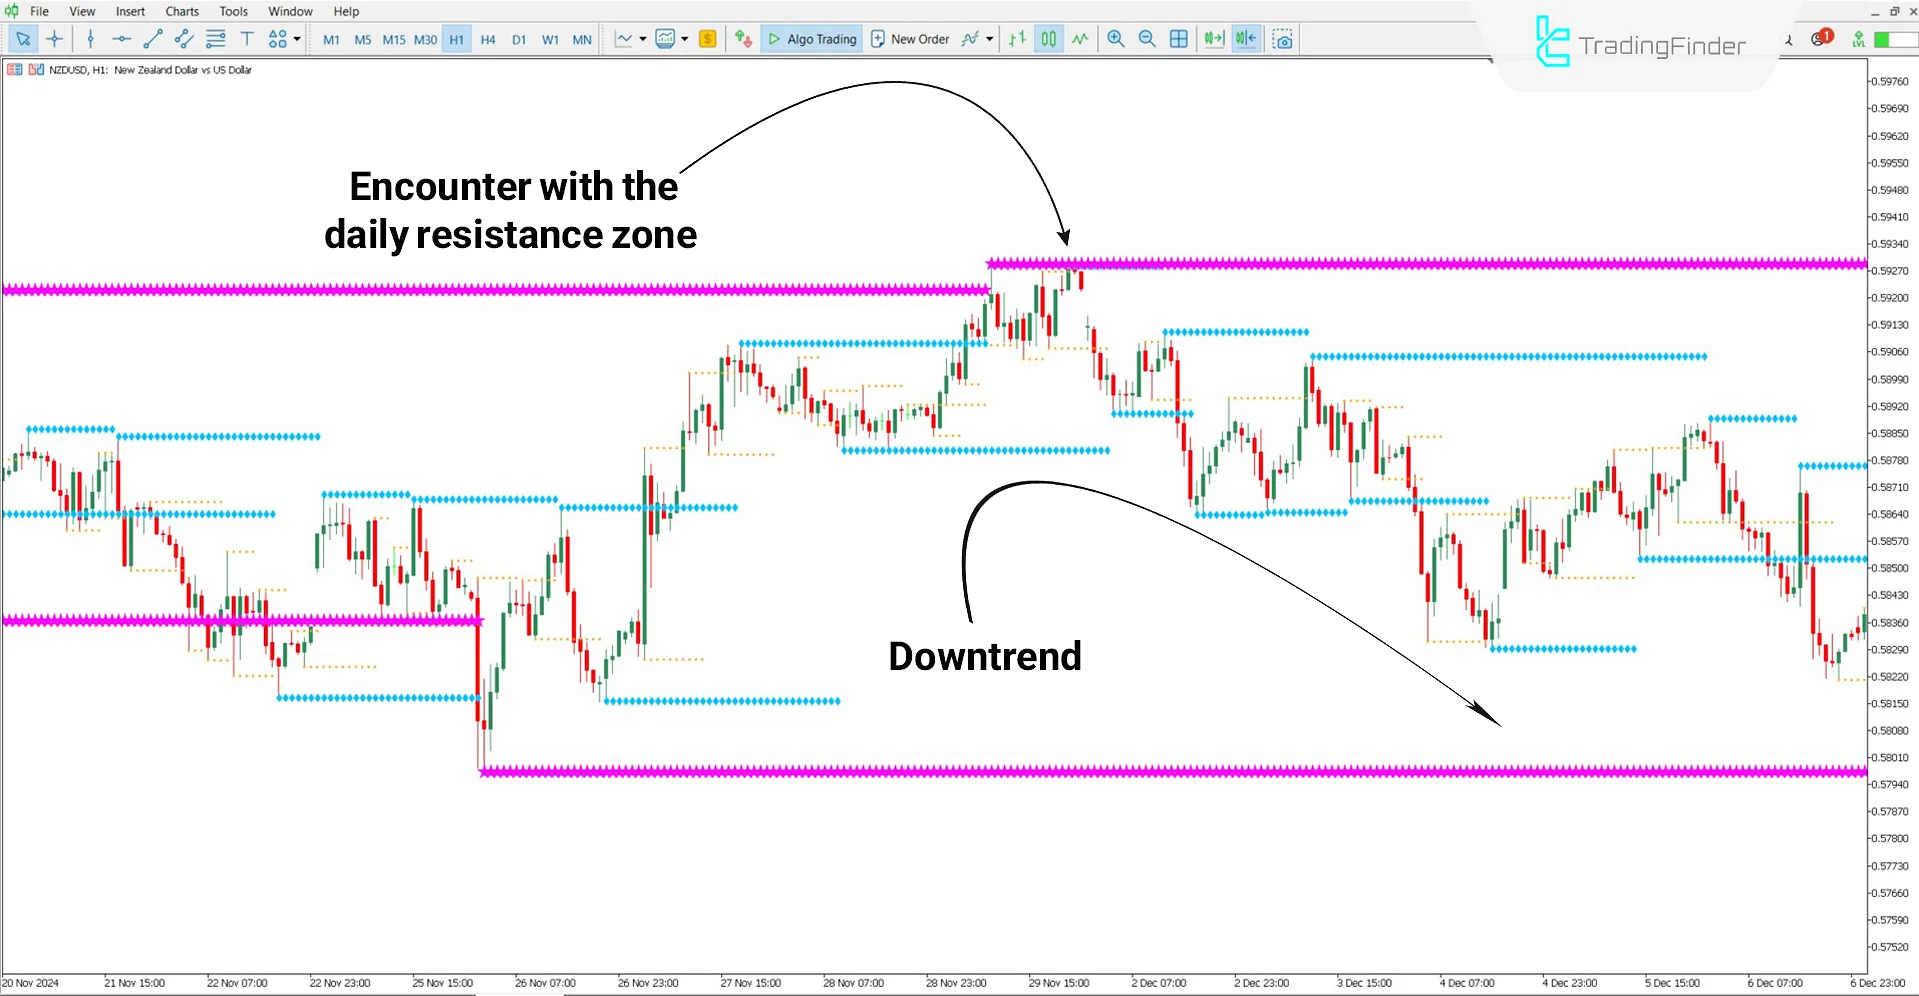
In the analysis of the New Zealand Dollar to US Dollar (NZD/USD) currency pair in the 1-hour timeframe, the price sharply declined after touching the daily resistance zone (pink area), forming a bearish trend.

KG Support & Resistance Indicator Settings
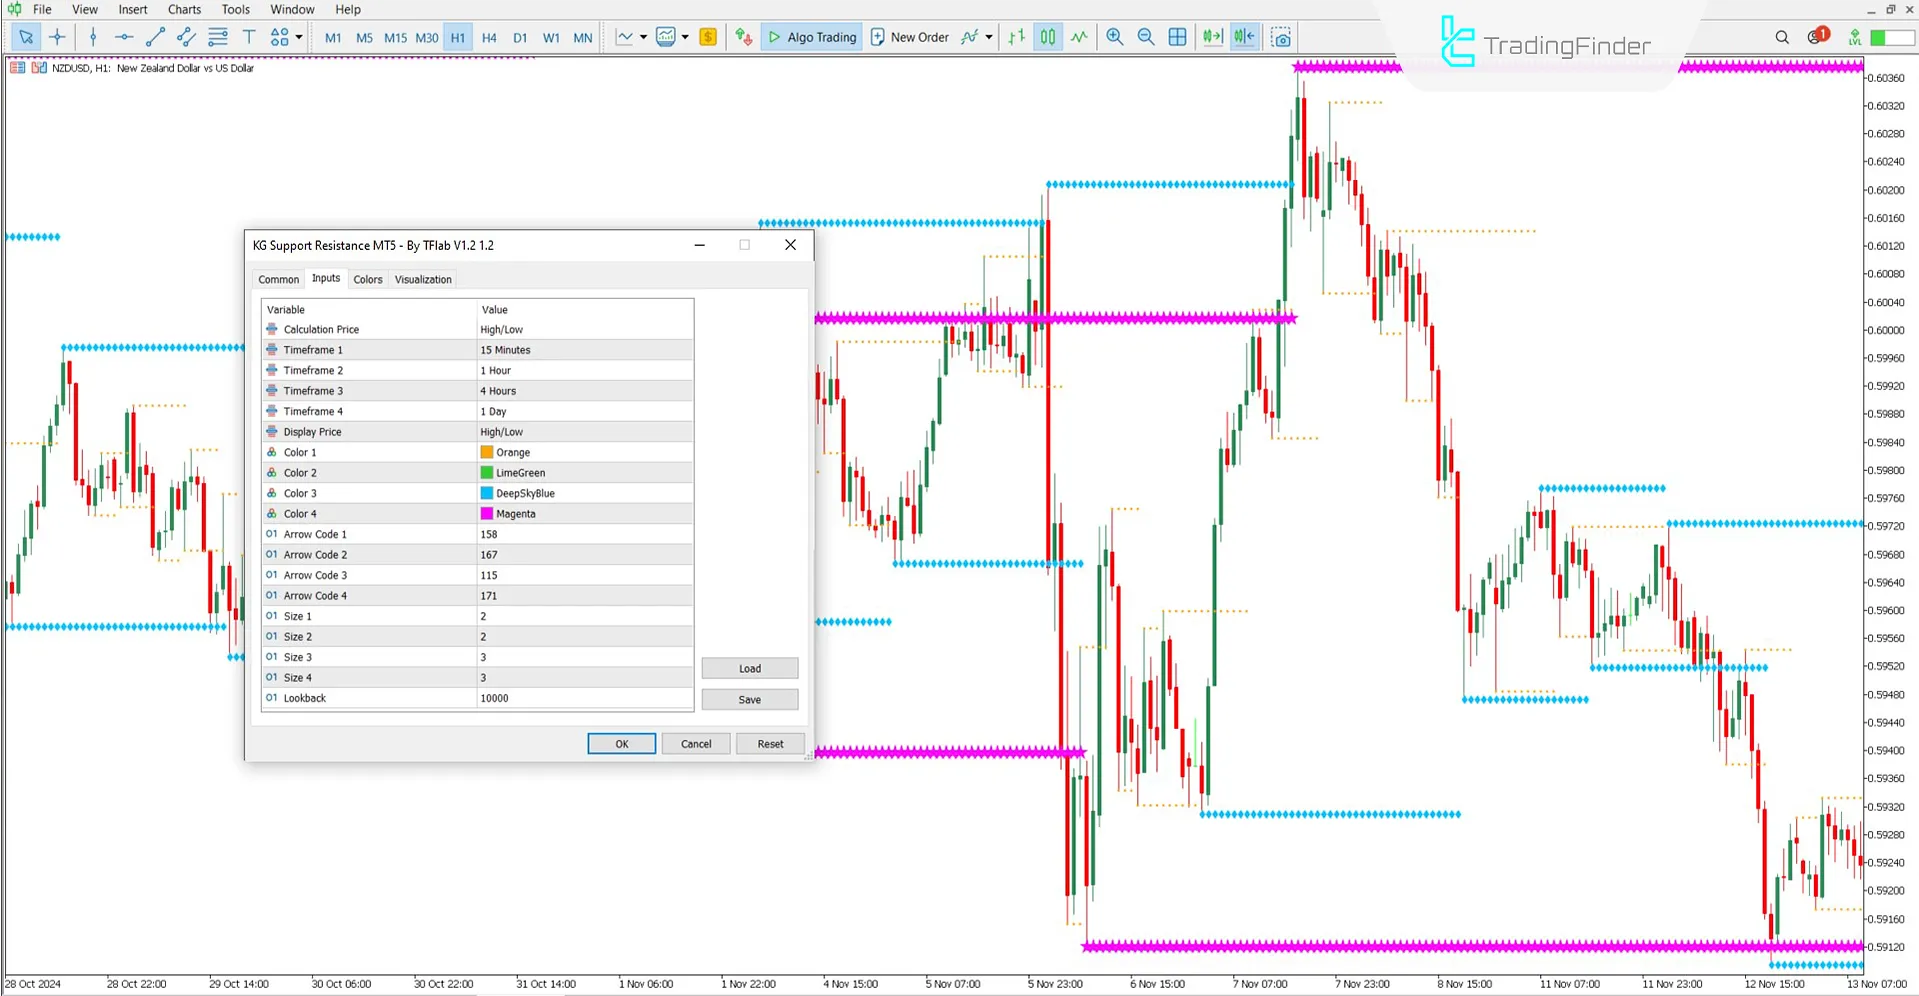
The following is an explanation of the settings and configuration of the KG Support & Resistance Indicator:

Calculation Settings
- Calculation Price (High/Low): Determines calculations based on highs and lows of price movements
Timeframe Settings
These parameters define which timeframes the indicator should draw support and resistance lines for:
- Timeframe 1: 15 minutes
- Timeframe 2: 1 hour
- Timeframe 3: 4 hours
- Timeframe 4: 1 day
- Display Price (High/Low): Displays prices related to the drawn levels
Zone Color Settings
In the Color section, users can customize the color of the support and resistance levels:
- Color 1,2,3,4: Define the colors of the four support and resistance levels
Zone Shape Settings
These parameters allow for modifying the visual representation of the support and resistance zones:
- Arrow Code 1,2,3,4: Defines the appearance of support and resistance zones 1, 2, 3, and 4
Size Settings
In the Size section, users can set the size of the support and resistance zones:
- Size 1,2,3,4: Determines the size of zones 1, 2, 3, and 4
- Lookback: The number of past candles was considered for calculations
Conclusion
Based on specified input parameters, the KG Support & Resistance Indicator for MetaTrader 5 automatically plots support and resistance zones on the chart.
This trading tool highlights key price levels and allows users to customize the colors and visual settings of the zones.
The zones drawn by this indicator are areas where price reactions are highly probable, and they can be used in the analysis of trading instruments in the Forex market and other financial markets.
KG Support Resistance MT5 PDF
KG Support Resistance MT5 PDF
Click to download KG Support Resistance MT5 PDFWhich markets is the KG Support & Resistance Indicator suitable for?
The KG Support & Resistance Indicator can be used in all trading markets without limitations.
Is the KG Support & Resistance Indicator only applicable for higher timeframes?
No, this is a multi-timeframe indicator and can be used in all timeframes.


