![Linear Regression Channel Indicator Download for Meta Trader 5 - Free - [Trading Finder]](https://cdn.tradingfinder.com/image/105448/10-11-en-linear_regression-mt5.webp)
![Linear Regression Channel Indicator Download for Meta Trader 5 - Free - [Trading Finder] 0](https://cdn.tradingfinder.com/image/105448/10-11-en-linear_regression-mt5.webp)
![Linear Regression Channel Indicator Download for Meta Trader 5 - Free - [Trading Finder] 1](https://cdn.tradingfinder.com/image/30417/10-11-en-linear-regression-channel-mt5-02.avif)
![Linear Regression Channel Indicator Download for Meta Trader 5 - Free - [Trading Finder] 2](https://cdn.tradingfinder.com/image/30419/10-11-en-linear-regression-channel-mt5-03.avif)
![Linear Regression Channel Indicator Download for Meta Trader 5 - Free - [Trading Finder] 3](https://cdn.tradingfinder.com/image/30422/10-11-en-linear-regression-channel-mt5-04.avif)
The Linear Regression Channel Indicator automatically draws regression channels on the price chart in Meta Trader 5. This Signal and Forecast indicator creates a price channel for trends based on their slope without the need for manual drawing. In bullish trends, the channel is upward (positive slope), and in bearish trends, it is downward (negative slope).
The upper channel line acts as an Overbought area in bearish channels and is a suitable range for sell (Sell Position) transactions. Similarly, the lower channel line is an oversold area in bullish channels and is an appropriate range for entering buy (Buy Position) transactions.
Indicator Table
Indicator Categories: | Signal & Forecast MT5 Indicators Bands & Channels MT5 Indicators Levels MT5 Indicators |
Platforms: | MetaTrader 5 Indicators |
Trading Skills: | Intermediate |
Indicator Types: | Reversal MT5 Indicators |
Timeframe: | Multi-Timeframe MT5 Indicators |
Trading Style: | Swing Trading MT5 Indicators Scalper MT5 Indicators Day Trading MT5 Indicators |
Trading Instruments: | Forex MT5 Indicators Crypto MT5 Indicators Stock MT5 Indicators Forward MT5 Indicators Share Stock MT5 Indicators |
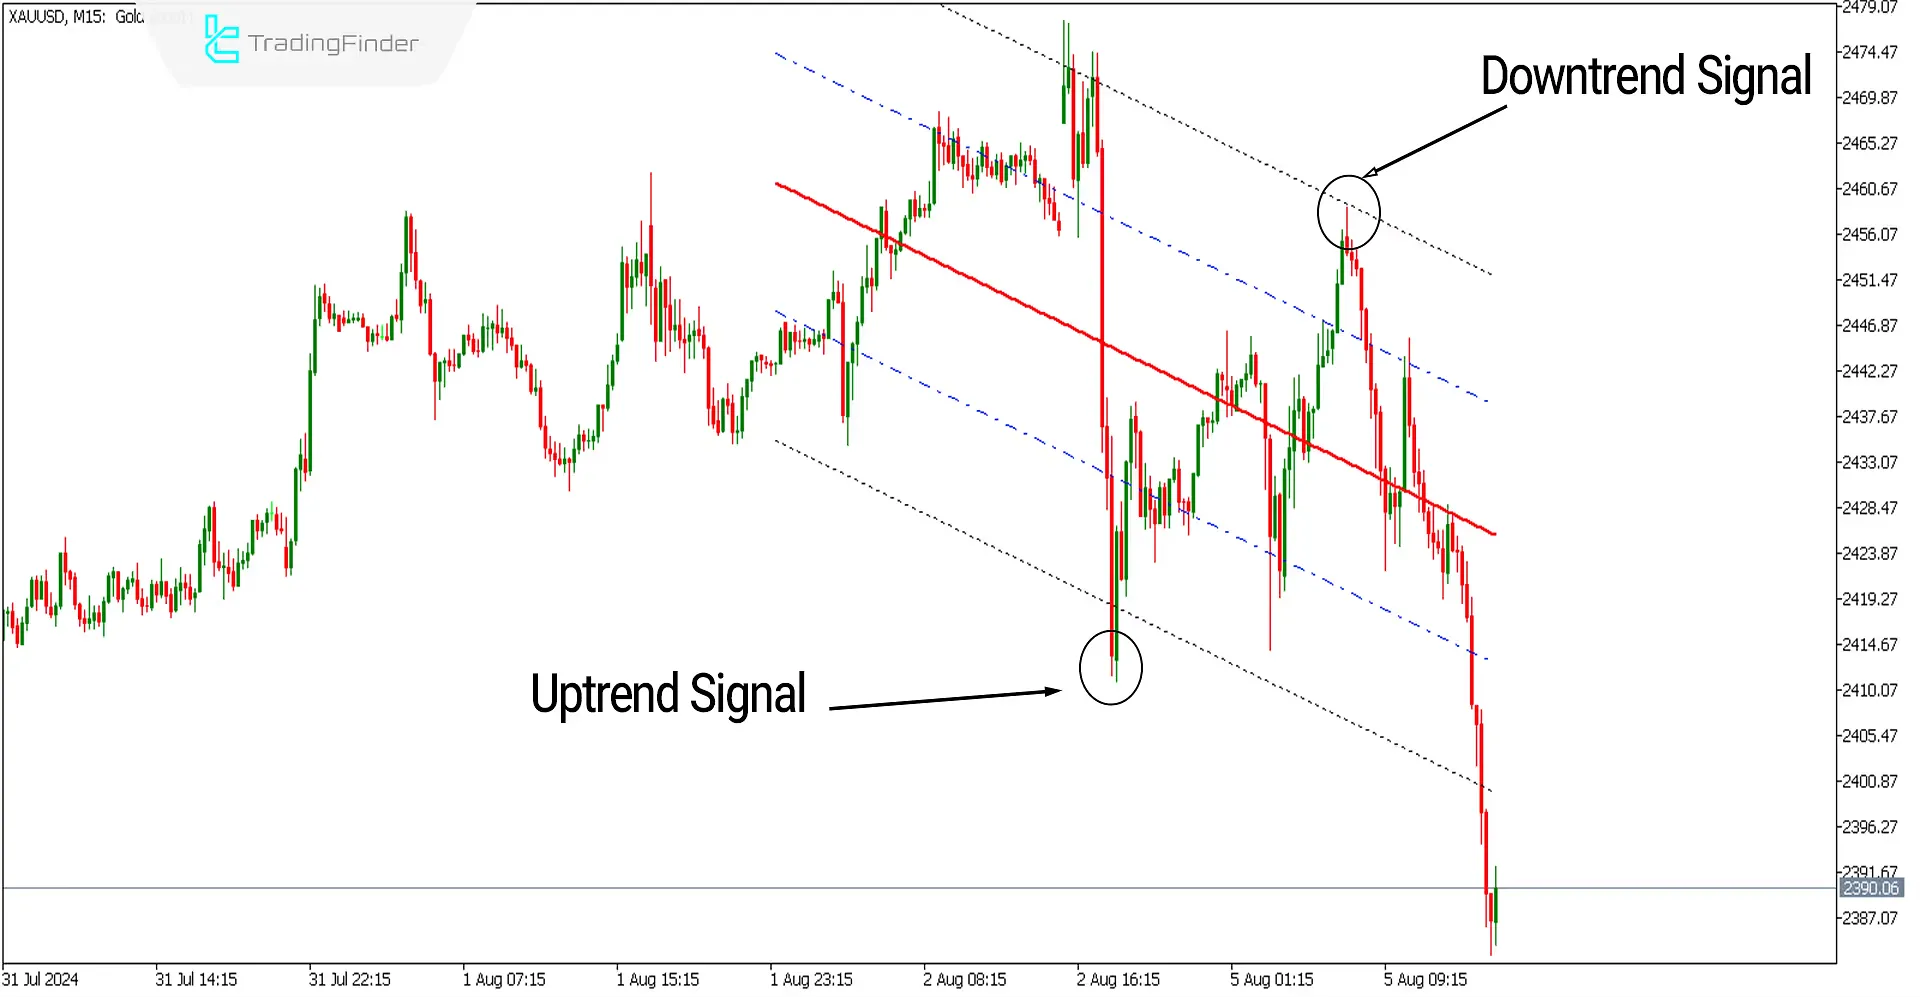
The image below shows the price chart of gold [XAUUSD] in a 15-minute timeframe. The Linear Regression Channel Indicator, based on the highest and lowest prices (High-Low), draws the regression channel as shown in the image.
This channel includes a middle line (red), two level 1 lines (blue), and two level 2 lines (black). When the price hits the upper channel line, sell orders are triggered, and at the bottom of the channel, buy orders are activated when the price hits the lower channel line.

Overview
The linear regression channel indicator is a widely used technical analysis tool for identifying trends and support and resistance levels (Support-Resistance). This indicator draws a bullish regression channel (Bullish Channel) in bullish trends and a bearish regression channel (Bearish Channel) in bearish trends, which is helpful when manually drawing price channels is complex.
Buy Signal Conditions Indicator (Buy Position)
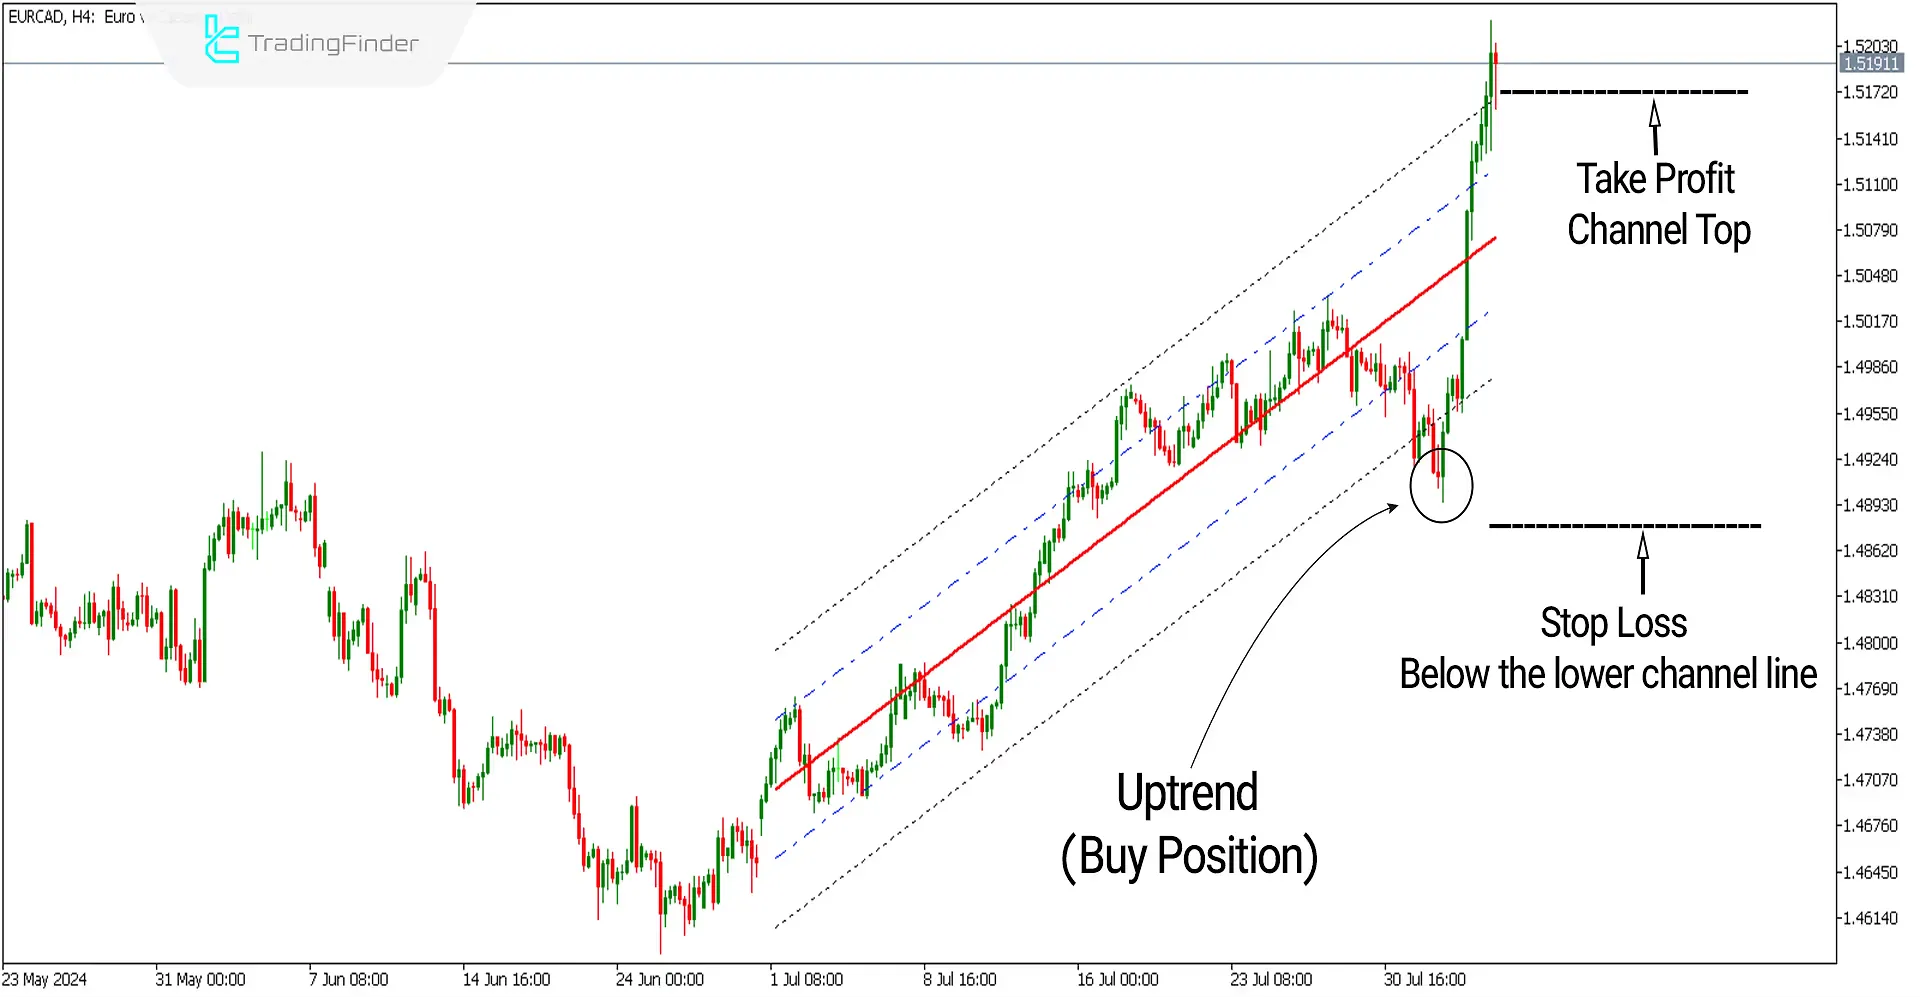
The chart of the EUR/CAD currency pair [EURCAD] in a 4-hour timeframe is shown in the image below. The price in the circle shown hits the bottom of the regression channel (lower line) and plays its supportive role, leading to a solid bullish movement (Impulse Bullish). Under these conditions, one can look for triggers to enter long (Buy) positions.
Take Profit and Stop Loss for Buy Signal
The stop loss can be placed a few pips below the lower channel line, and the profit target can be placed at the top of the channel (upper line).

Sell Signal Conditions Indicator (Sell Positions)
The image below shows the chart of the Australian Dollar to Canadian Dollar currency pair [AUDCAD] in a one-hour timeframe.
The price in the circle shown hits the top of the regression channel (upper line), and the channel acts as dynamic resistance (Resistance) against the price, starting a strong bearish movement (Impulse Bearish). Under these conditions, one can look for triggers to enter short (Sell) positions.
Take Profit and Stop Loss for Sell Signal
The stop loss can be placed a few pips above the upper channel line, and the profit target can be placed at the bottom (lower line).

Settings of the Linear Regression Channel Indicator

- Channel Period: The number of candles used for calculation is 150.
- Multiplier Bands: The multiplier distance of level 1 and 2 lines from the middle line is 1.
Note: In the Colors section (Colors), you can select colors for each line according to your preferred background color.
Conclusion
The linear regression channel indicator displays trends as either a bullish or bearish channel, facilitating better trend identification. Trading in the direction of the trend reduces risk and increases the win rate.
To filter out unreliable signals in this Metatrader 5 indicator, other analytical tools, such as divergences and classical chart patterns (Classic Chart Pattern), can also be used to ascertain the correct trend direction.
Linear Regression Channel Meta MT5 PDF
Linear Regression Channel Meta MT5 PDF
Click to download Linear Regression Channel Meta MT5 PDFDoes the Linear Regression Channel differ from a moving average?
While a moving average predicts future trends with each candle change, the Linear Regression Channel, by averaging prices from the start to the end, identifies the trend's midline and predicts the probable ranges of tops and bottoms.
How is the Linear Regression Channel Indicator calculated?
Using statistical calculations, the Linear Regression Channel Indicator automatically calculates the overall trend path over a specified timeframe. Dashed lines of the channel are also drawn parallel to the midline at a predefined distance set in the settings to form the regression channel.


