![MACD Double Indicator for MetaTrader 5 – Free Download [TradingFinder]](https://cdn.tradingfinder.com/image/550734/2-147-en-macd-double-mt5-1.webp)
![MACD Double Indicator for MetaTrader 5 – Free Download [TradingFinder] 0](https://cdn.tradingfinder.com/image/550734/2-147-en-macd-double-mt5-1.webp)
![MACD Double Indicator for MetaTrader 5 – Free Download [TradingFinder] 1](https://cdn.tradingfinder.com/image/550735/2-147-en-macd-double-mt5-2.webp)
![MACD Double Indicator for MetaTrader 5 – Free Download [TradingFinder] 2](https://cdn.tradingfinder.com/image/550737/2-147-en-macd-double-mt5-3.webp)
![MACD Double Indicator for MetaTrader 5 – Free Download [TradingFinder] 3](https://cdn.tradingfinder.com/image/550733/2-147-en-macd-double-mt5-4.webp)
The MACD Double Indicator in MetaTrader 5 is a more advanced version of the classic MACD indicator which, by using a higher time frame as a filter, increases the accuracy of signals in trading strategies.
This tool displays the direction and strength of the market trend through candle color changes and identifies the entry zones for buy and sell trades.
MACD Double Indicator Table
The general specifications of the MACD Double Indicator (MACD Double) are shown in the table below.
Indicator Categories: | Signal & Forecast MT5 Indicators Trading Assist MT5 Indicators MACD Indicators for MetaTrader 5 |
Platforms: | MetaTrader 5 Indicators |
Trading Skills: | Elementary |
Indicator Types: | Reversal MT5 Indicators |
Timeframe: | Multi-Timeframe MT5 Indicators |
Trading Style: | Intraday MT5 Indicators |
Trading Instruments: | Forex MT5 Indicators Crypto MT5 Indicators Stock MT5 Indicators |
MACD Double Indicator at a Glance
The MACD Double Indicator in MetaTrader 5 issues buy and sell signals with the help of candle color changes. These signals are generated based on MACD crosses with the signal line or crossing the zero line.
- Color change from red to blue: Beginning of an uptrend (Buy signal)
- Color change from blue to red: Beginning of a downtrend (Sell signal)
Indicator in Bullish Trend
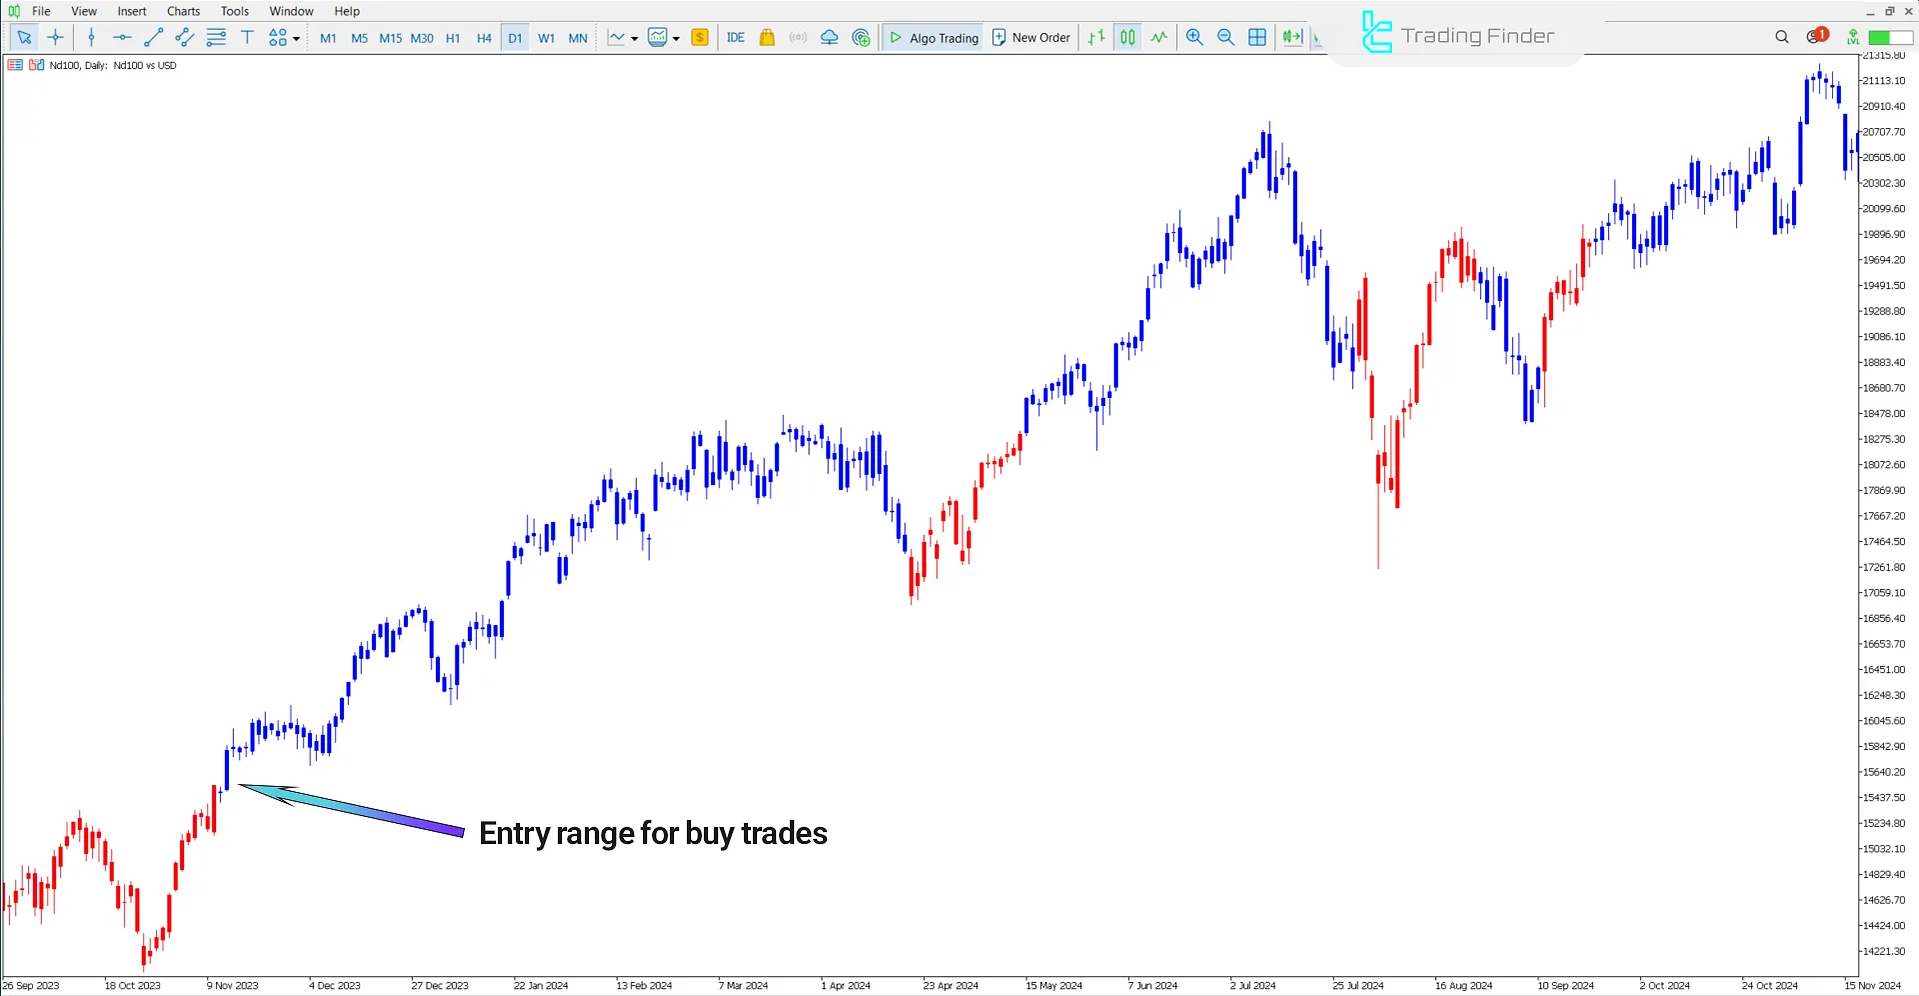
The price chart below shows the Nasdaq index with symbol (Nd100) on the daily timeframe.
When the market is in a downtrend, candles are usually seen in red. With increasing buyer strength, the first blue candle forms. This color change from red to blue indicates the start of a fresh bullish trend and is used as a suitable signal for entering a Buy trade.

Indicator in Bearish Trend
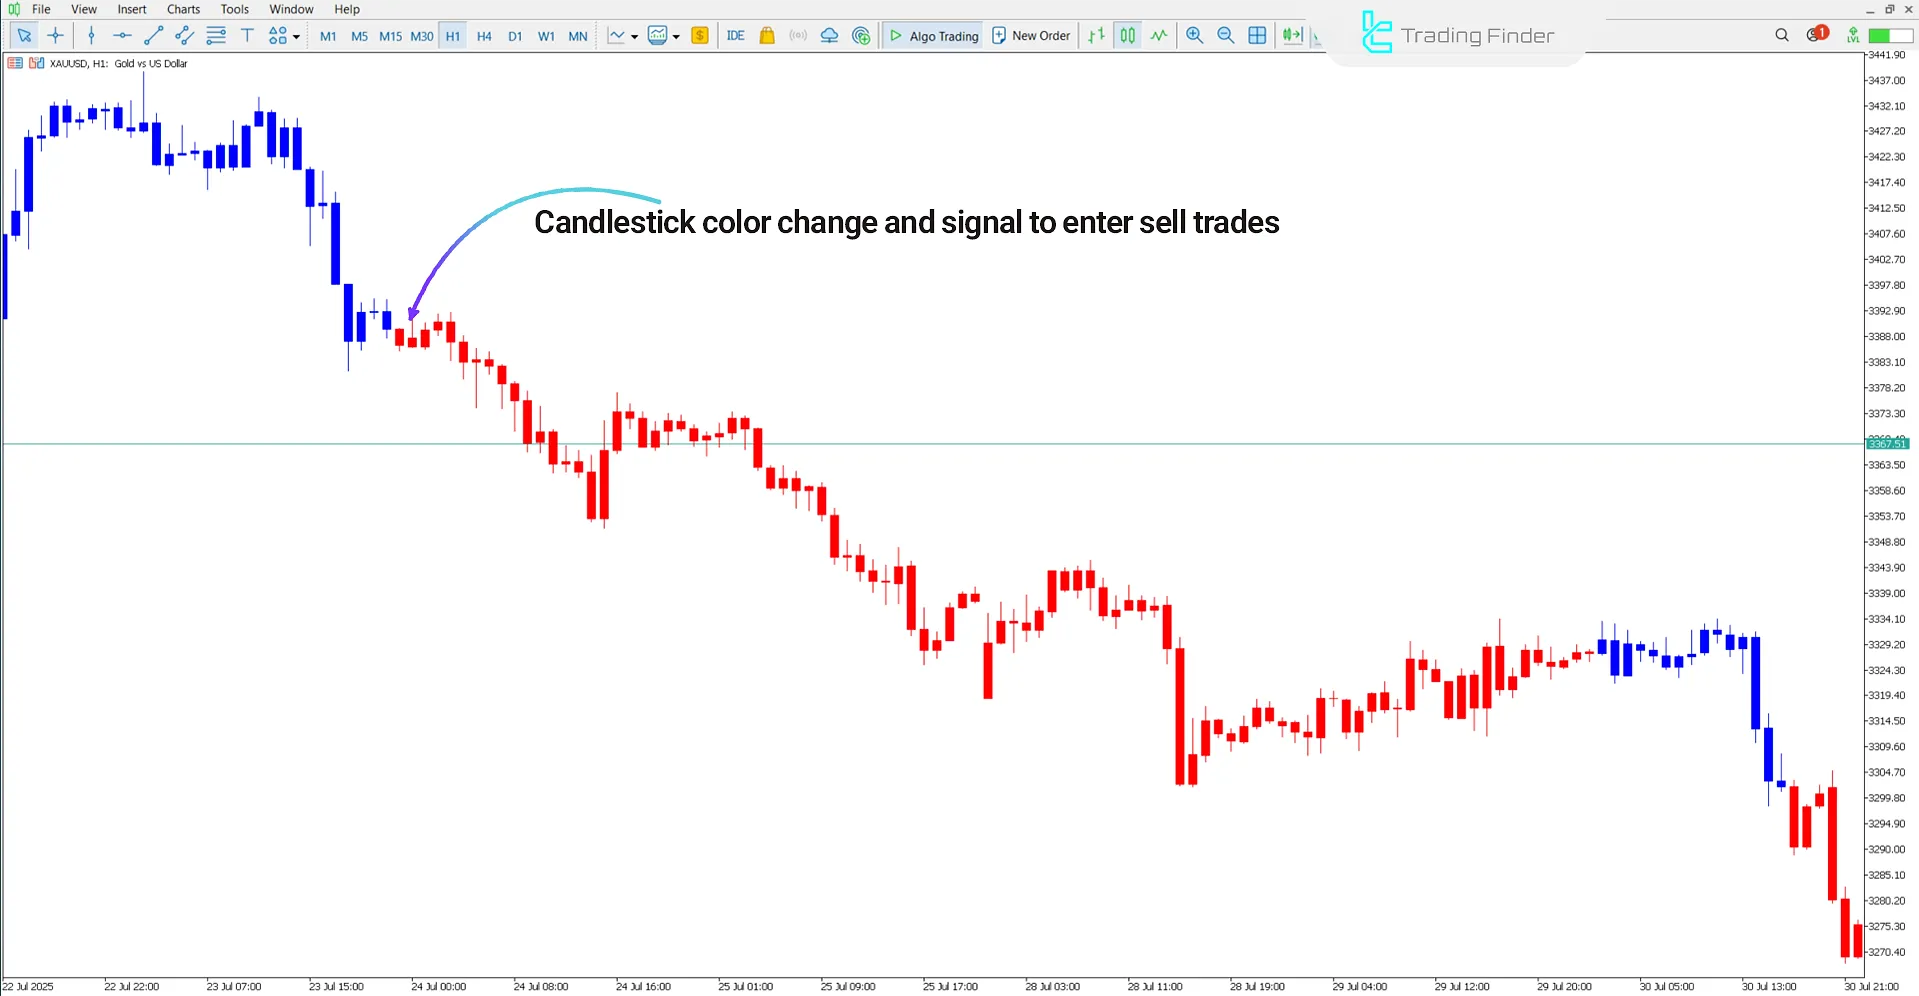
The image below shows the global gold ounce index with symbol (XAU/USD) on the one-hour timeframe.
When candle colors change from blue to red, it signals the beginning of downward pressure in the market. In such conditions, this color change is considered as a Sell signal.

MACD Double Settings
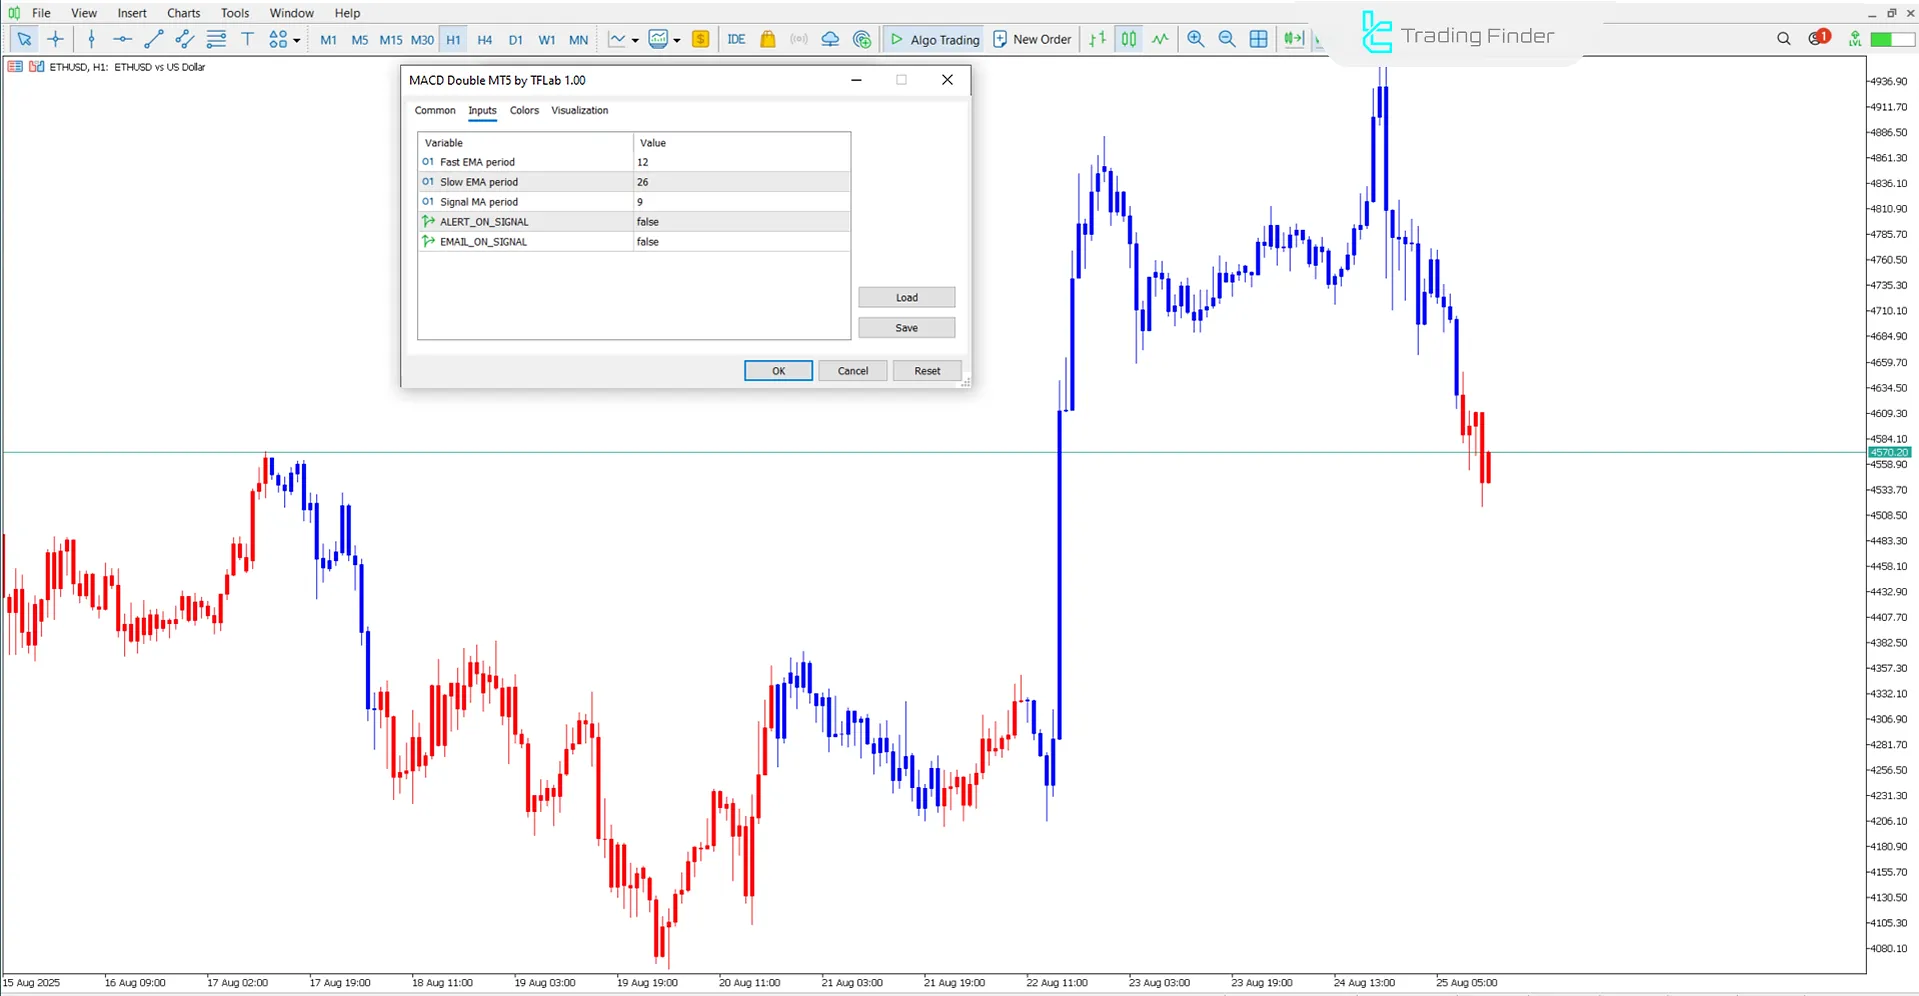
The image below shows the settings panel of the MACD Double Indicator:

- Fast EMA period: Period of fast Exponential Moving Average
- Slow EMA period: Period of slow Exponential Moving Average
- Signal MA period: Period of signal Moving Average
- ALERT_ON_SIGNAL: Enable signal alert alarm
- EMAIL_ON_SIGNAL: Send signal via email
Conclusion
The MACD Double Indicator (MACD Double) is one of the suitable tools in technical analysis for identifying market direction changes in bullish and bearish trends.
In this indicator, blue candles represent upward movement and red candles represent downward movement.
MACD Double Indicator for MetaTrader 4 PDF
MACD Double Indicator for MetaTrader 4 PDF
Click to download MACD Double Indicator for MetaTrader 4 PDFWhen does the Sell signal appear in the MACD Double Indicator?
In this indicator, the color change of candles from blue to red issues the Sell trade entry signal.
What is the best market to use the MACD Double?
This indicator is applicable in Forex, stocks, cryptocurrency, and commodities markets.


