![Machine Learning Regression Trend Indicator MT5 - Free Download [TradingFinder]](https://cdn.tradingfinder.com/image/628331/2-173-en-machine-learning-regression-trend-mt5-1.webp)
![Machine Learning Regression Trend Indicator MT5 - Free Download [TradingFinder] 0](https://cdn.tradingfinder.com/image/628331/2-173-en-machine-learning-regression-trend-mt5-1.webp)
![Machine Learning Regression Trend Indicator MT5 - Free Download [TradingFinder] 1](https://cdn.tradingfinder.com/image/628330/2-173-en-machine-learning-regression-trend-mt5-2.webp)
![Machine Learning Regression Trend Indicator MT5 - Free Download [TradingFinder] 2](https://cdn.tradingfinder.com/image/628329/2-173-en-machine-learning-regression-trend-mt5-3.webp)
![Machine Learning Regression Trend Indicator MT5 - Free Download [TradingFinder] 3](https://cdn.tradingfinder.com/image/628333/2-173-en-machine-learning-regression-trend-mt5-4.webp)
The Machine Learning Regression Trend Indicator analyzes the market trend using the Random Sample Consensus (RANSAC) algorithm.
This algorithm removes outlier data and displays a clearer linear pattern of price changes. The use of this method identifies the linear structure of price with high accuracy.
Machine Learning Regression Trend Indicator Table
The general specifications of the Machine Learning Regression Trend Indicator are presented in the table below.
Indicator Categories: | Trading Assist MT5 Indicators Bands & Channels MT5 Indicators |
Platforms: | MetaTrader 5 Indicators |
Trading Skills: | Intermediate |
Indicator Types: | Reversal MT5 Indicators |
Timeframe: | Multi-Timeframe MT5 Indicators |
Trading Style: | Intraday MT5 Indicators |
Trading Instruments: | Forex MT5 Indicators Crypto MT5 Indicators Stock MT5 Indicators |
Machine Learning Regression Trend Indicator at a Glance
The Machine Learning Regression Trend Indicator acts as a multi-purpose tool in the MetaTrader 5 platform.
Similar to a Linear Regression Channel, this indicator displays support and resistance lines, while also providing the ability to forecast the future market direction.
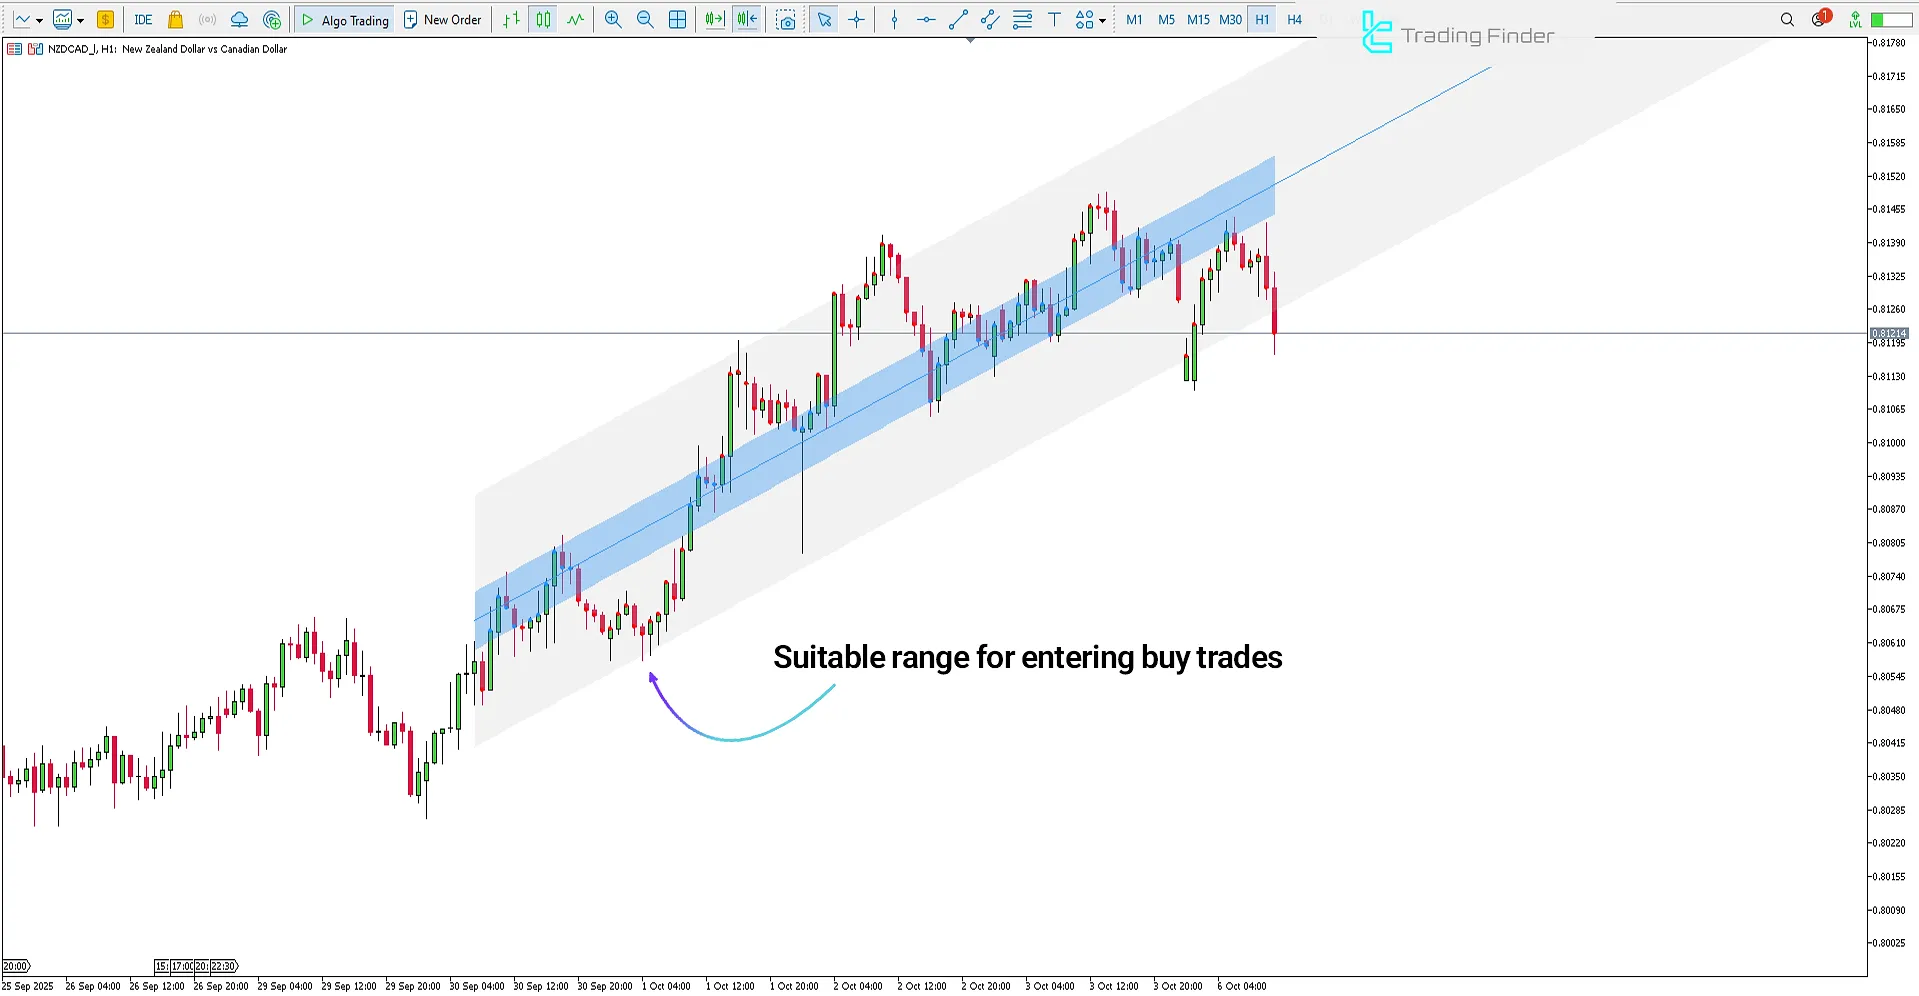
To illustrate the trend, linear regression lines are drawn on the chart with an error margin; in this tool, the blue area indicates the acceptable error range.
Indicator in an Uptrend
In an uptrend, the indicator defines the blue channel as the main path of price.
The consolidation of candles above the central line generates a buy signal, while the reaction to the lower band acts as dynamic support.
The increased distance of candles from the central line and their movement toward the upper band reflect the strength of the bullish wave.

Indicator in a Downtrend
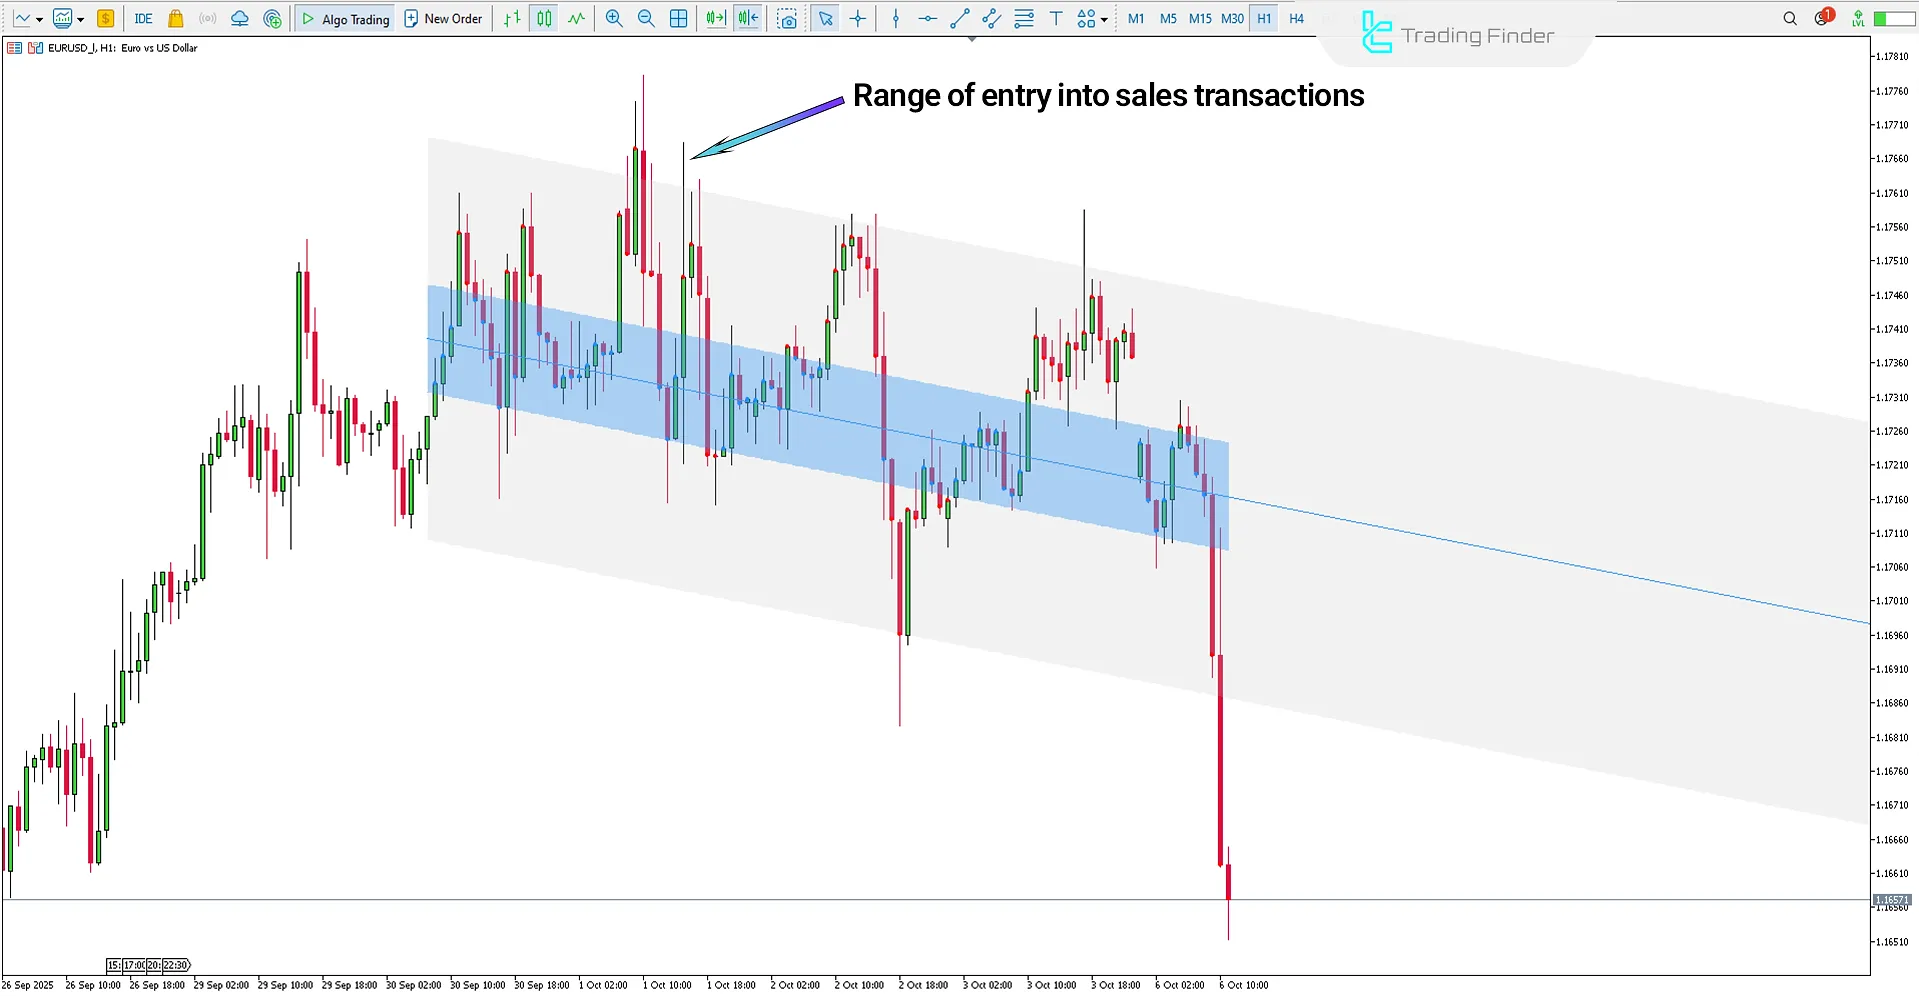
In a downtrend, the Machine Learning Regression Trend Indicator depicts the overall market direction with a negative slope.
The consolidation of candles below the mid-band highlights selling pressure and confirms the continuation of the bearish flow. Moreover, the price reaction to the top of the regression channel acts as resistance, outlining the sell entry zone.

Machine Learning Regression Trend Settings
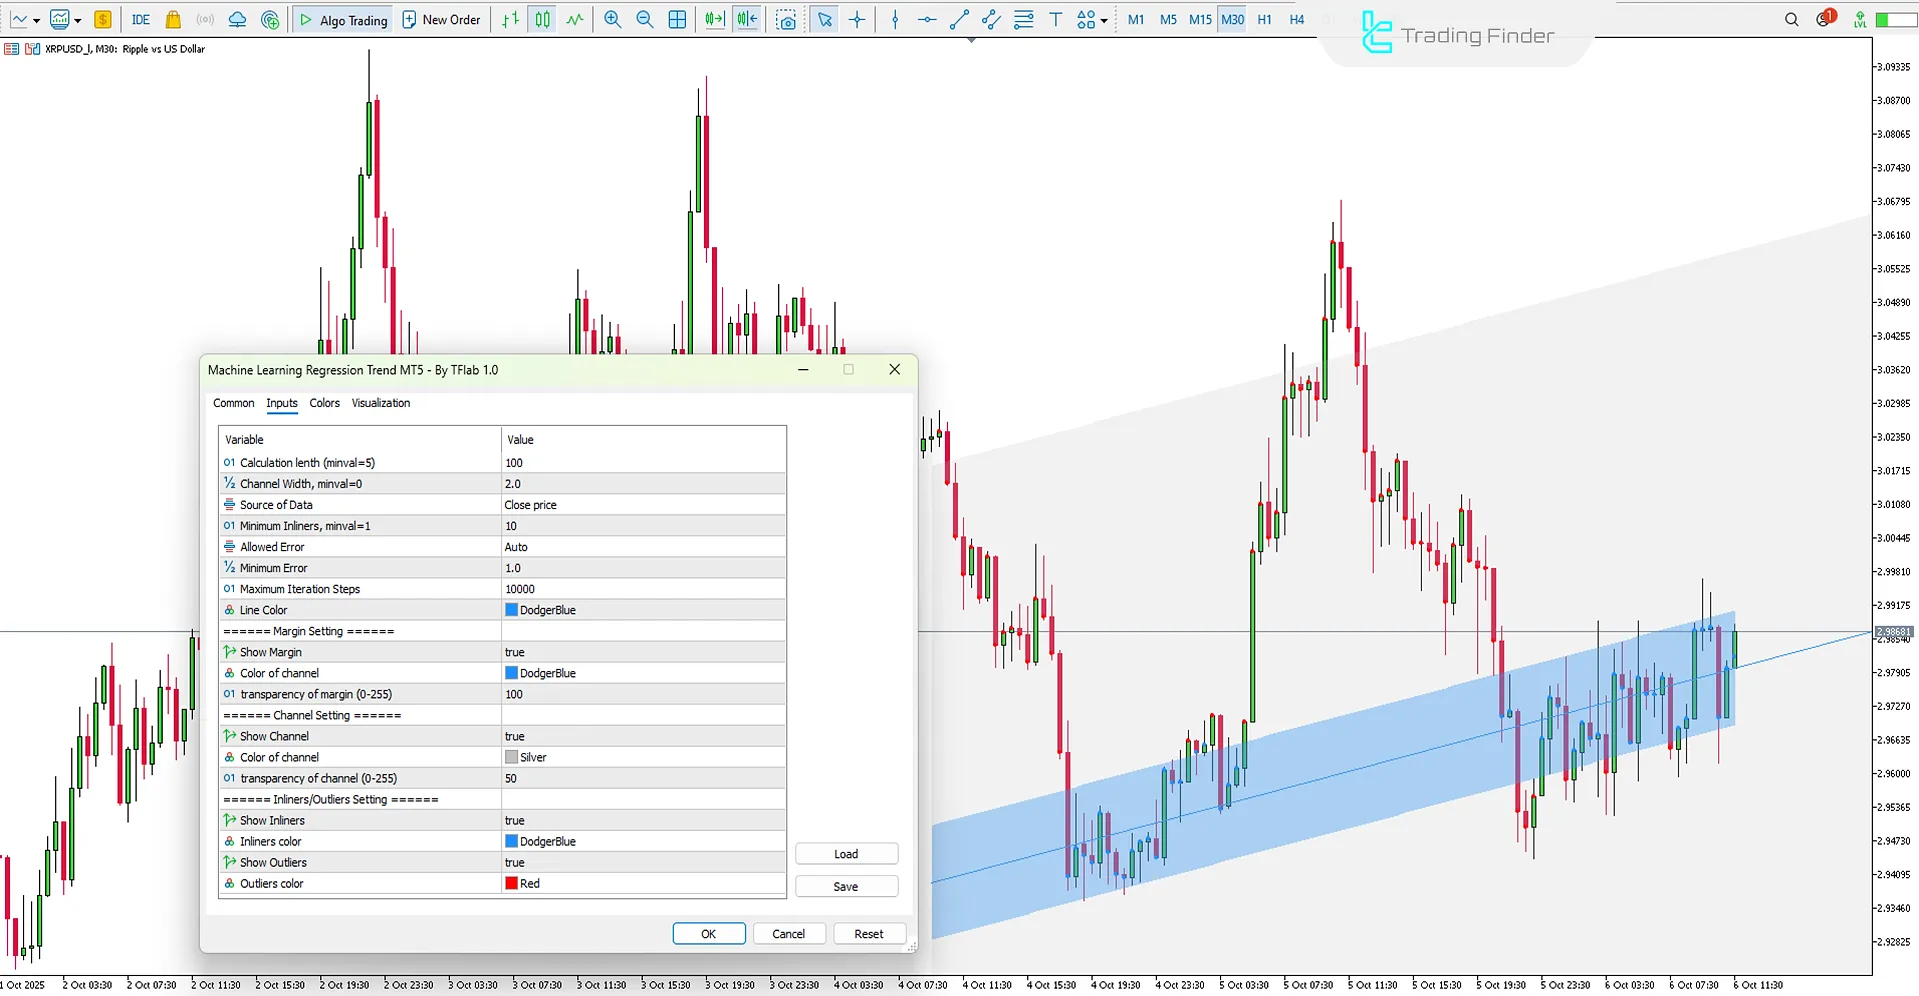
The image below shows the settings panel of the Machine Learning Regression Trend Indicator:

- Channel length (minval=5): Displays channel length (minimum value = 5)
- Channel Width, minval=0: Channel width (minimum value = 0)
- Source of Data: Source of data for calculations
- Minimum Inliers, minval=1: Minimum number of inlier data (Inliers) with a minimum value of 1
- Allowed Error: Tolerance threshold for detection
- minval=0, step=0.5: Minimum value = 0, with change step = 0.5
- Maximum Iteration Steps: Maximum number of algorithm iteration steps
- Line Color: Show line color
- Show Margin: Display channel margin
- Color of channel: Display channel color
- Transparency of margin (0-255): Margin transparency (from 0 to 255)
- Show Channel: Display channel
- Color of channel: Show channel color
- Transparency of channel (0-255): Channel transparency (from 0 to 255)
- Show Inliers: Display inlier data
- Inliers color: Show Inliers color
- Show Outliers: Display outliers
- Outliers color: Display outliers color
Conclusion
The Machine Learning Regression Trend Indicator, using the RANSAC algorithm, removes outliers and provides a clearer picture of the real market trend.
This trading tool identifies dynamic support in bullish phases and resistance/selling pressure in bearish phases.
Machine Learning Regression Trend Indicator MT5 PDF
Machine Learning Regression Trend Indicator MT5 PDF
Click to download Machine Learning Regression Trend Indicator MT5 PDFIn which timeframes is the Machine Learning Regression Trend Indicator effective?
This indicator is effective in short-term timeframes for scalping and in long-term intervals for analyzing main trends.
What is the importance of the RANSAC algorithm in the Machine Learning Regression Trend Indicator?
In this indicator, the RANSAC algorithm selects valid data samples and removes outliers in order to form a stable linear model.


