![Money Flow Index Levels Indicator for MT5 Download - Free - [TradingFinder]](https://cdn.tradingfinder.com/image/319044/13-94-en-mfi-levels-mt5-01.webp)
![Money Flow Index Levels Indicator for MT5 Download - Free - [TradingFinder] 0](https://cdn.tradingfinder.com/image/319044/13-94-en-mfi-levels-mt5-01.webp)
![Money Flow Index Levels Indicator for MT5 Download - Free - [TradingFinder] 1](https://cdn.tradingfinder.com/image/319046/13-94-en-mfi-levels-mt5-02.webp)
![Money Flow Index Levels Indicator for MT5 Download - Free - [TradingFinder] 2](https://cdn.tradingfinder.com/image/319047/13-94-en-mfi-levels-mt5-03.webp)
![Money Flow Index Levels Indicator for MT5 Download - Free - [TradingFinder] 3](https://cdn.tradingfinder.com/image/319045/13-94-en-mfi-levels-mt5-04.webp)
The Money Flow Index Levels Indicator (MFI Levels) is one of the MT5 level indicators. It can plot three support levels and three resistance levels.
This indicator is built upon the Money Flow Index (MFI), and its levels are updated every four hours by default. This tool is designed to align well with various trading strategies and adapt to different trading approaches.
Specification Table of the MFI Levels Indicator
The features of the Money Flow Index Levels Indicator are as follows.
Indicator Categories: | Pivot Points & Fractals MT5 Indicators Support & Resistance MT5 Indicators Levels MT5 Indicators |
Platforms: | MetaTrader 5 Indicators |
Trading Skills: | Intermediate |
Indicator Types: | Breakout MT5 Indicators Reversal MT5 Indicators |
Timeframe: | Multi-Timeframe MT5 Indicators |
Trading Style: | Scalper MT5 Indicators Day Trading MT5 Indicators Fast Scalper MT5 Indicators |
Trading Instruments: | Forex MT5 Indicators Crypto MT5 Indicators Stock MT5 Indicators Forward MT5 Indicators |
Bullish Trend Conditions
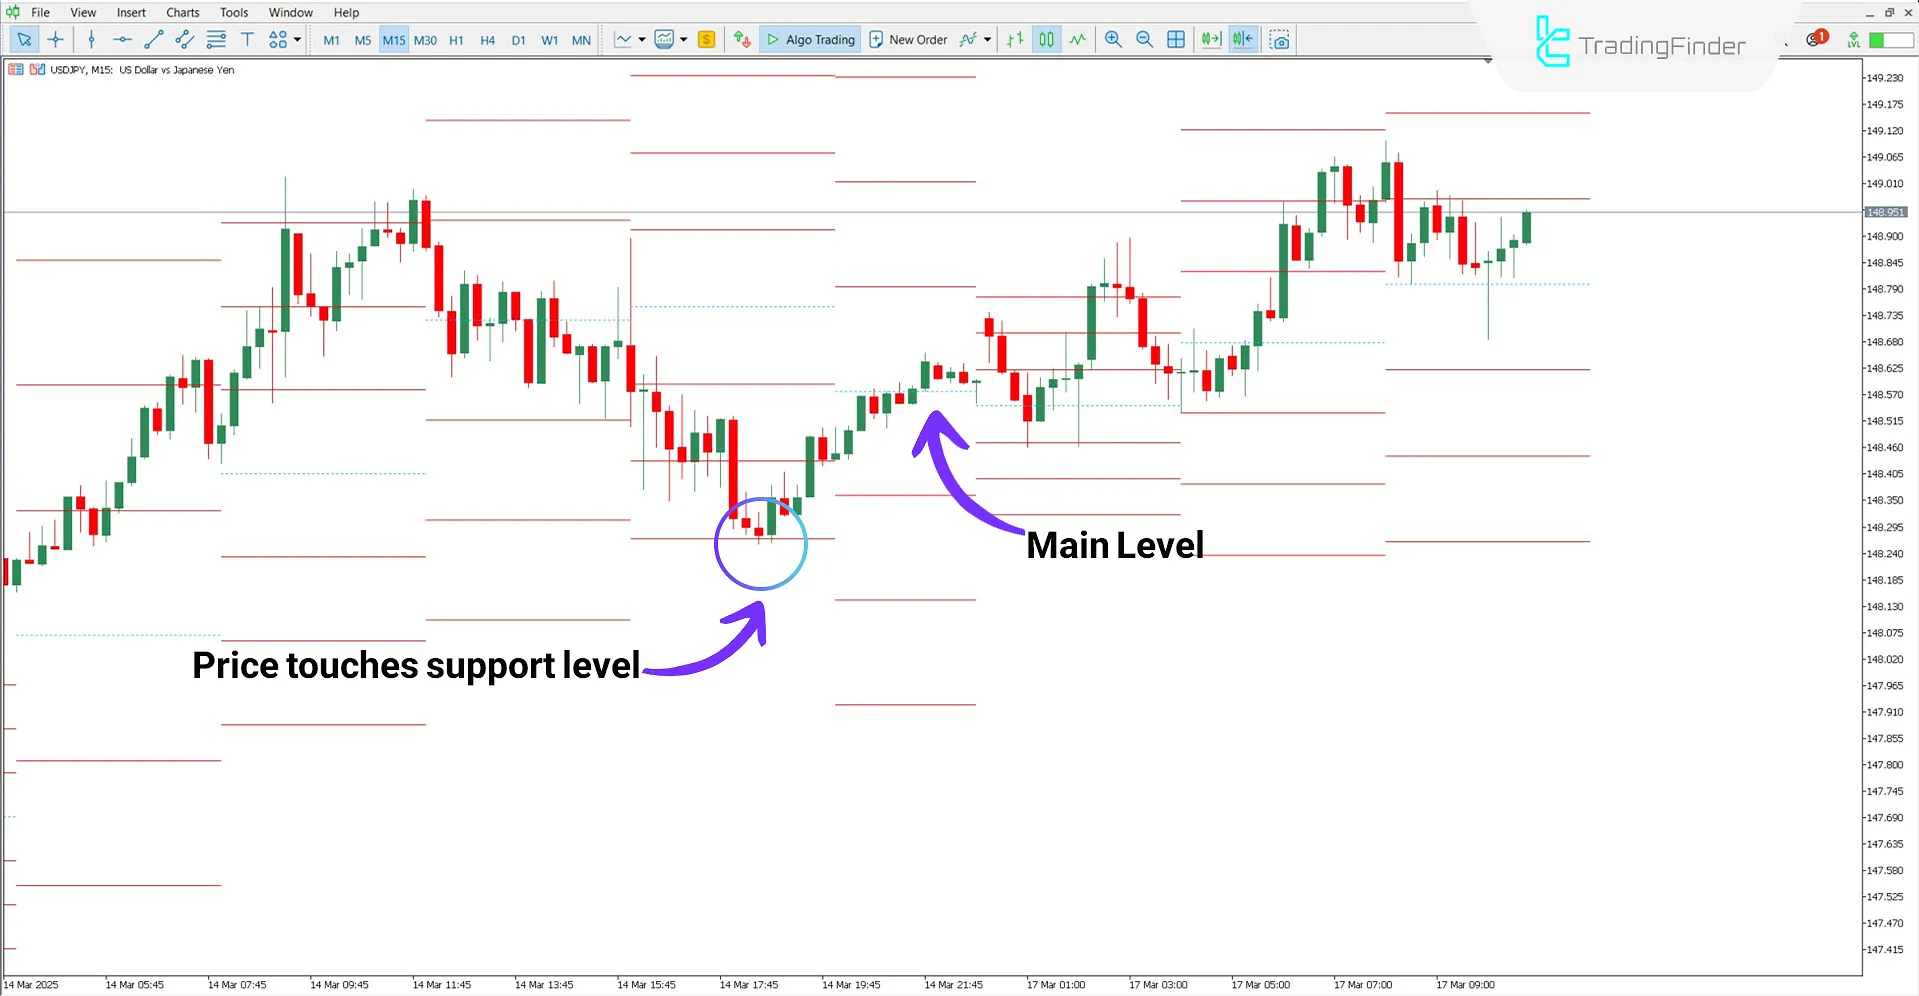
According to the USD/JPY currency pair's analysis of the 15-minute timeframe, a bearish trend reversed upon hitting a support level and began moving upward. Support levels are good reference points for placing stop-loss (SL) orders.

Bearish Trend Conditions
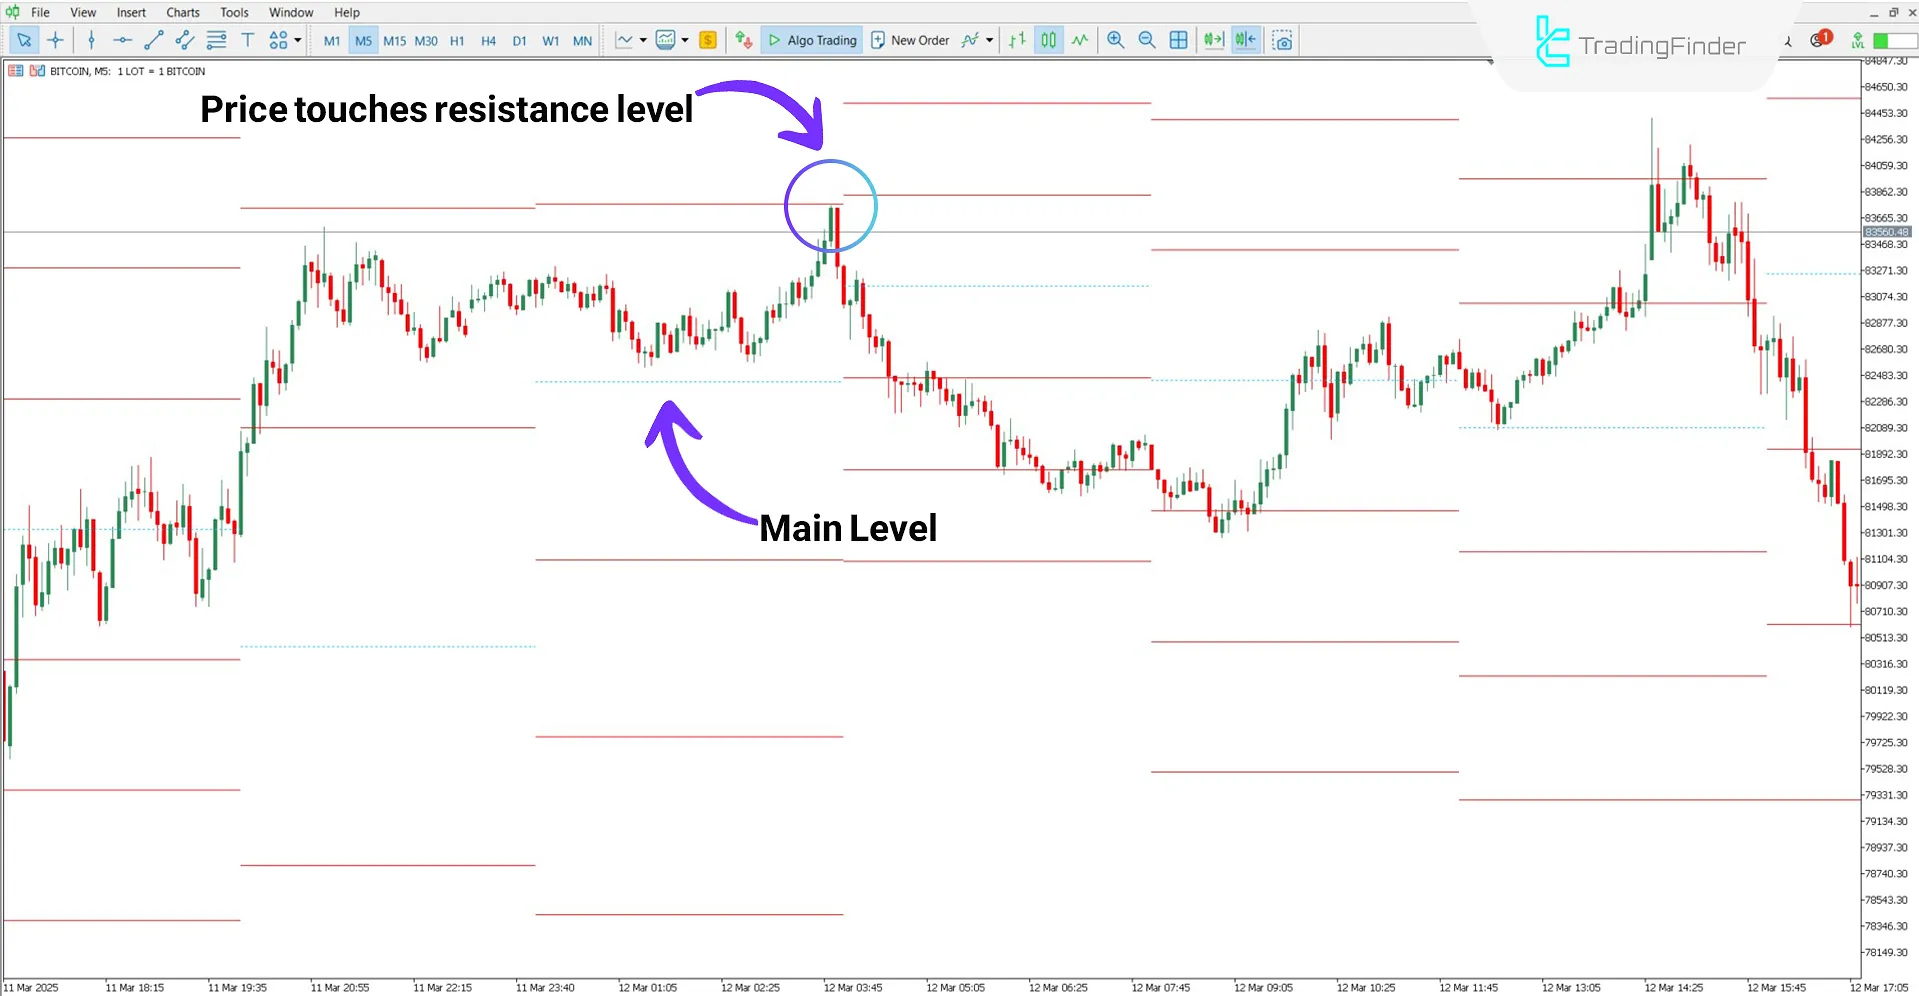
In the 5-minute Bitcoin (BTC) chart, the price dropped after touching a resistance level, breaking out of a range-bound zone. The breakdown of support levels signals seller strength and the dominance of the bearish trend.

MFI Levels Indicator Settings
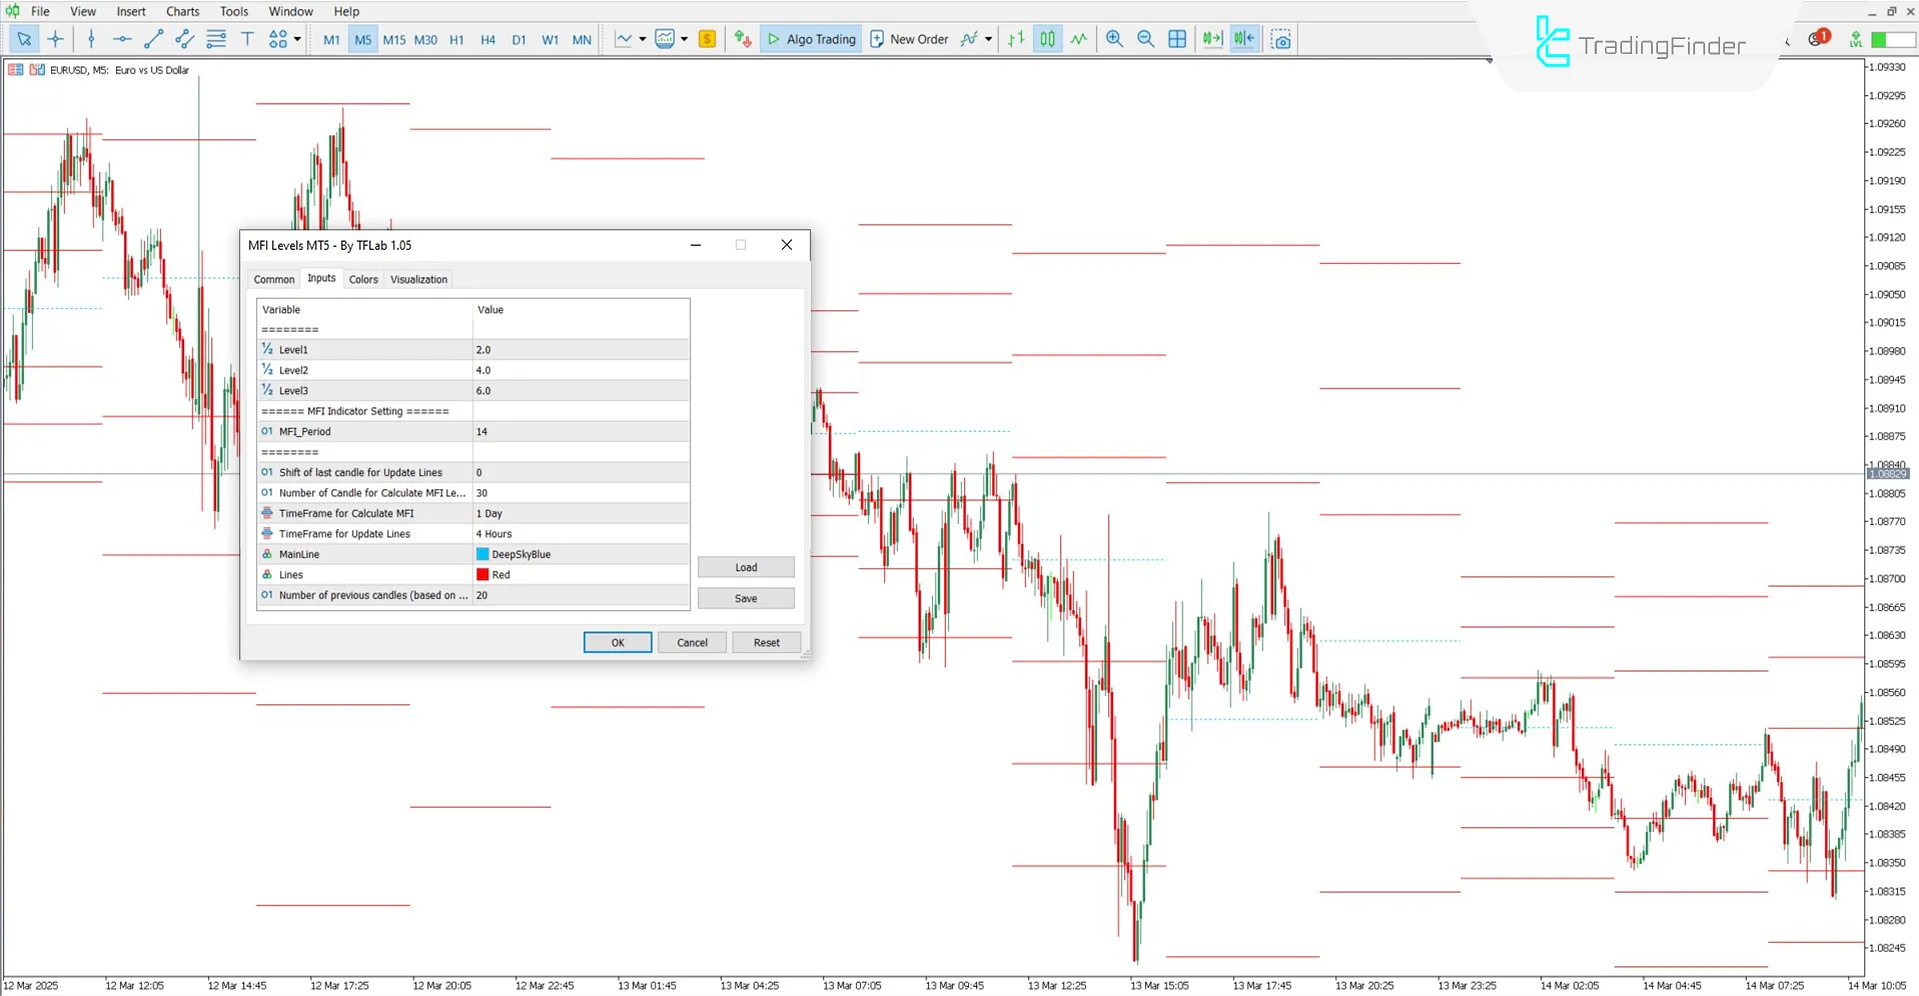
The adjustable settings of the MFI Levels Indicator are as follows:

- Level1: First level calculation
- Level2: Second level calculation
- Level3: Third level calculation
- Shift of last candle for Update Lines: Number of recent candles to skip when updating levels
- Number of Candles for Calculate MFI Levels: Number of candles used for level calculation
- Time Frame for Calculate MFI: The main timeframe for MFI calculation
- Time Frame for Update Lines: Interval for updating indicator levels
- Main Line: Color of the main level line
- Lines: Color of the three support and resistance levels
- Number of previous candles (based on calculation): Number of prior candles used for background calculations
- MFI Period: Period value used in MFI calculations
Conclusion
The MFI Levels Indicator (MFI Levels) is designed to draw support and resistance levels based on the Money Flow Index. As a MT5 pivot point indicator, it offers flexible customization options, including defining the update interval for its lines. This tool can be used across all markets, including Forex, cryptocurrency, and more.
Money Flow Index Levels MT5 PDF
Money Flow Index Levels MT5 PDF
Click to download Money Flow Index Levels MT5 PDFIs the MFI Levels Indicator applicable in the 1-minute timeframe?
Yes, it is a multi-timeframe indicator and works across all timeframes.
What is the function of the lines drawn by the MFI Levels Indicator?
The lines drawn by this indicator serve as support and resistance levels.
Is the MFI Levels Indicator applicable in the 1-minute timeframe?
Yes, it is a multi-timeframe indicator and works across all timeframes.
What is the function of the lines drawn by the MFI Levels Indicator?
The lines drawn by this indicator serve as support and resistance levels.


