![Mouteki Indicator for MT5 Download – Free – [TradingFinder]](https://cdn.tradingfinder.com/image/434736/13-145-en-mouteki-mt5-01.webp)
![Mouteki Indicator for MT5 Download – Free – [TradingFinder] 0](https://cdn.tradingfinder.com/image/434736/13-145-en-mouteki-mt5-01.webp)
![Mouteki Indicator for MT5 Download – Free – [TradingFinder] 1](https://cdn.tradingfinder.com/image/434714/13-145-en-mouteki-mt5-02.webp)
![Mouteki Indicator for MT5 Download – Free – [TradingFinder] 2](https://cdn.tradingfinder.com/image/434703/13-145-en-mouteki-mt5-03.webp)
![Mouteki Indicator for MT5 Download – Free – [TradingFinder] 3](https://cdn.tradingfinder.com/image/434715/13-145-en-mouteki-mt5-04.webp)
The Mouteki indicator is designed based on historical price movements, focusing on identifying trend reversals and dominant market trends.
This tool graphically illustrates price movement structures by drawing trendlines that connect historical highs and lows.
Additionally, two horizontal levels are marked on the chart as support and resistance, which are determined based on the market's past reactions.
Another feature of this indicator is the display of information, such as LTD and UTD, at the top left of the chart, under the "Comment" section.
Mouteki Indicator Specifications Table
The technical specifications of the indicator are as follows:
Indicator Categories: | Support & Resistance MT5 Indicators Trading Assist MT5 Indicators Levels MT5 Indicators |
Platforms: | MetaTrader 5 Indicators |
Trading Skills: | Elementary |
Indicator Types: | Breakout MT5 Indicators Reversal MT5 Indicators |
Timeframe: | Multi-Timeframe MT5 Indicators |
Trading Style: | Swing Trading MT5 Indicators Scalper MT5 Indicators Day Trading MT5 Indicators |
Trading Instruments: | Forex MT5 Indicators Crypto MT5 Indicators Stock MT5 Indicators Commodity MT5 Indicators Indices MT5 Indicators Share Stock MT5 Indicators |
Mouteki Indicator at a Glance
One of the key features of the Mouteki indicator is its visual representation of the "High" and "Low" price points. These points are shown using arrows in different colors:
- A blue arrow represents the highest price (High)
- A red arrow indicates the lowest price (Low)
Bullish Trend Conditions
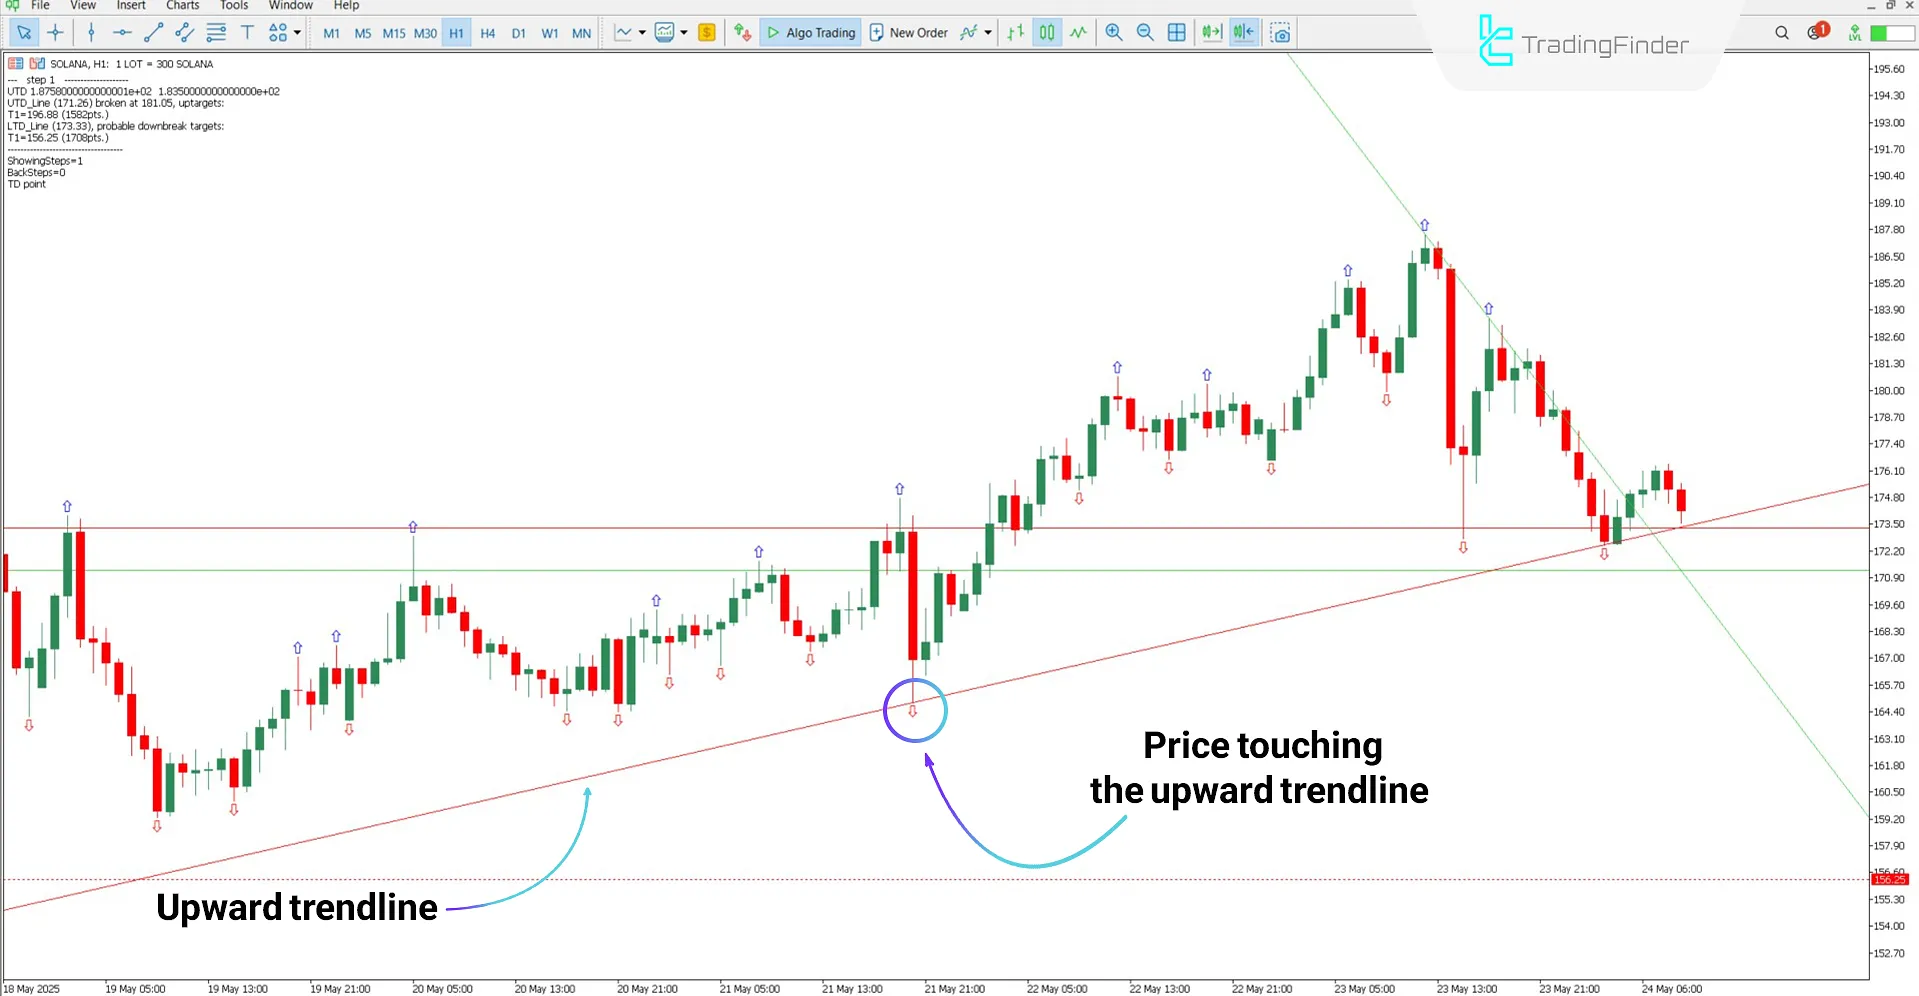
According to the Solana (SOL) 1-hour chart, the Mouteki indicator draws the uptrend line in red on the chart.
As the price approaches this line, it reacts accordingly, creating favorable conditions for entering a buy position.

Bearish Trend Conditions
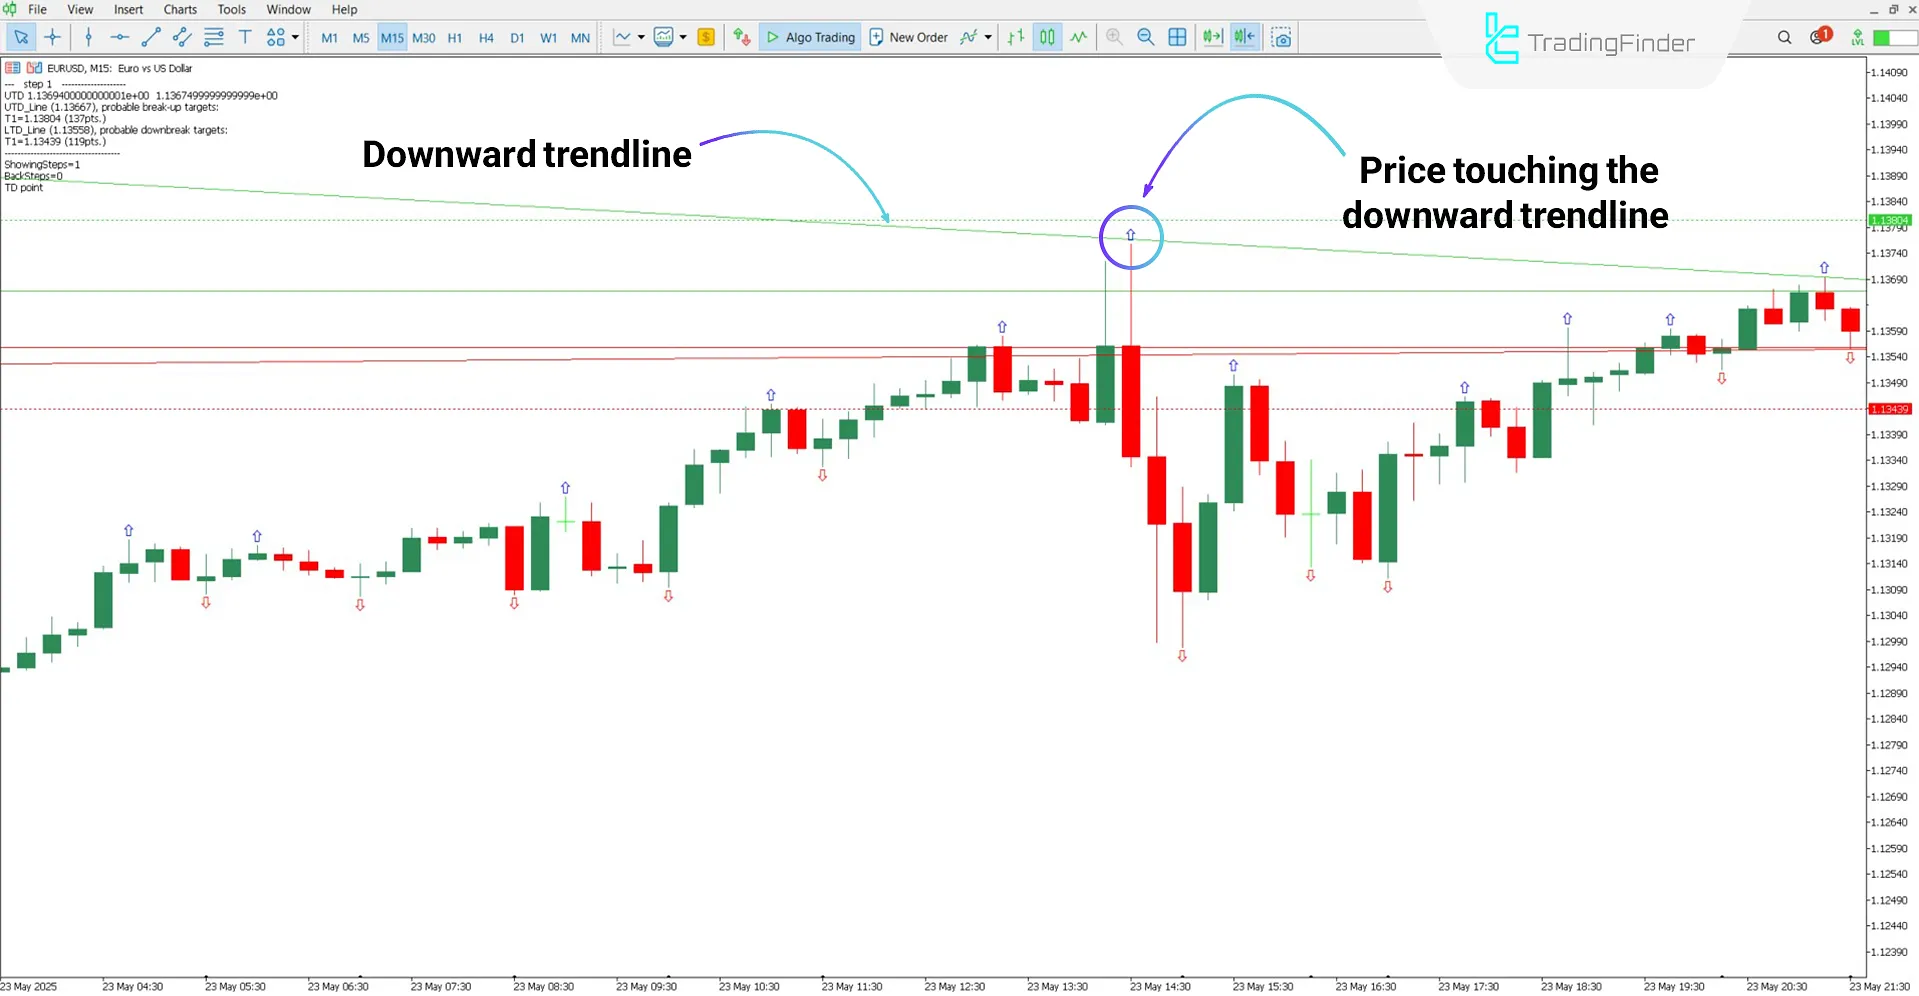
Based on the 15-minute chart of the EUR/USD currency pair, the downtrend line is drawn in green.
As shown in the image, the price touching the downtrend line can be interpreted as a signal to enter a sell trade.

Mouteki Indicator Settings
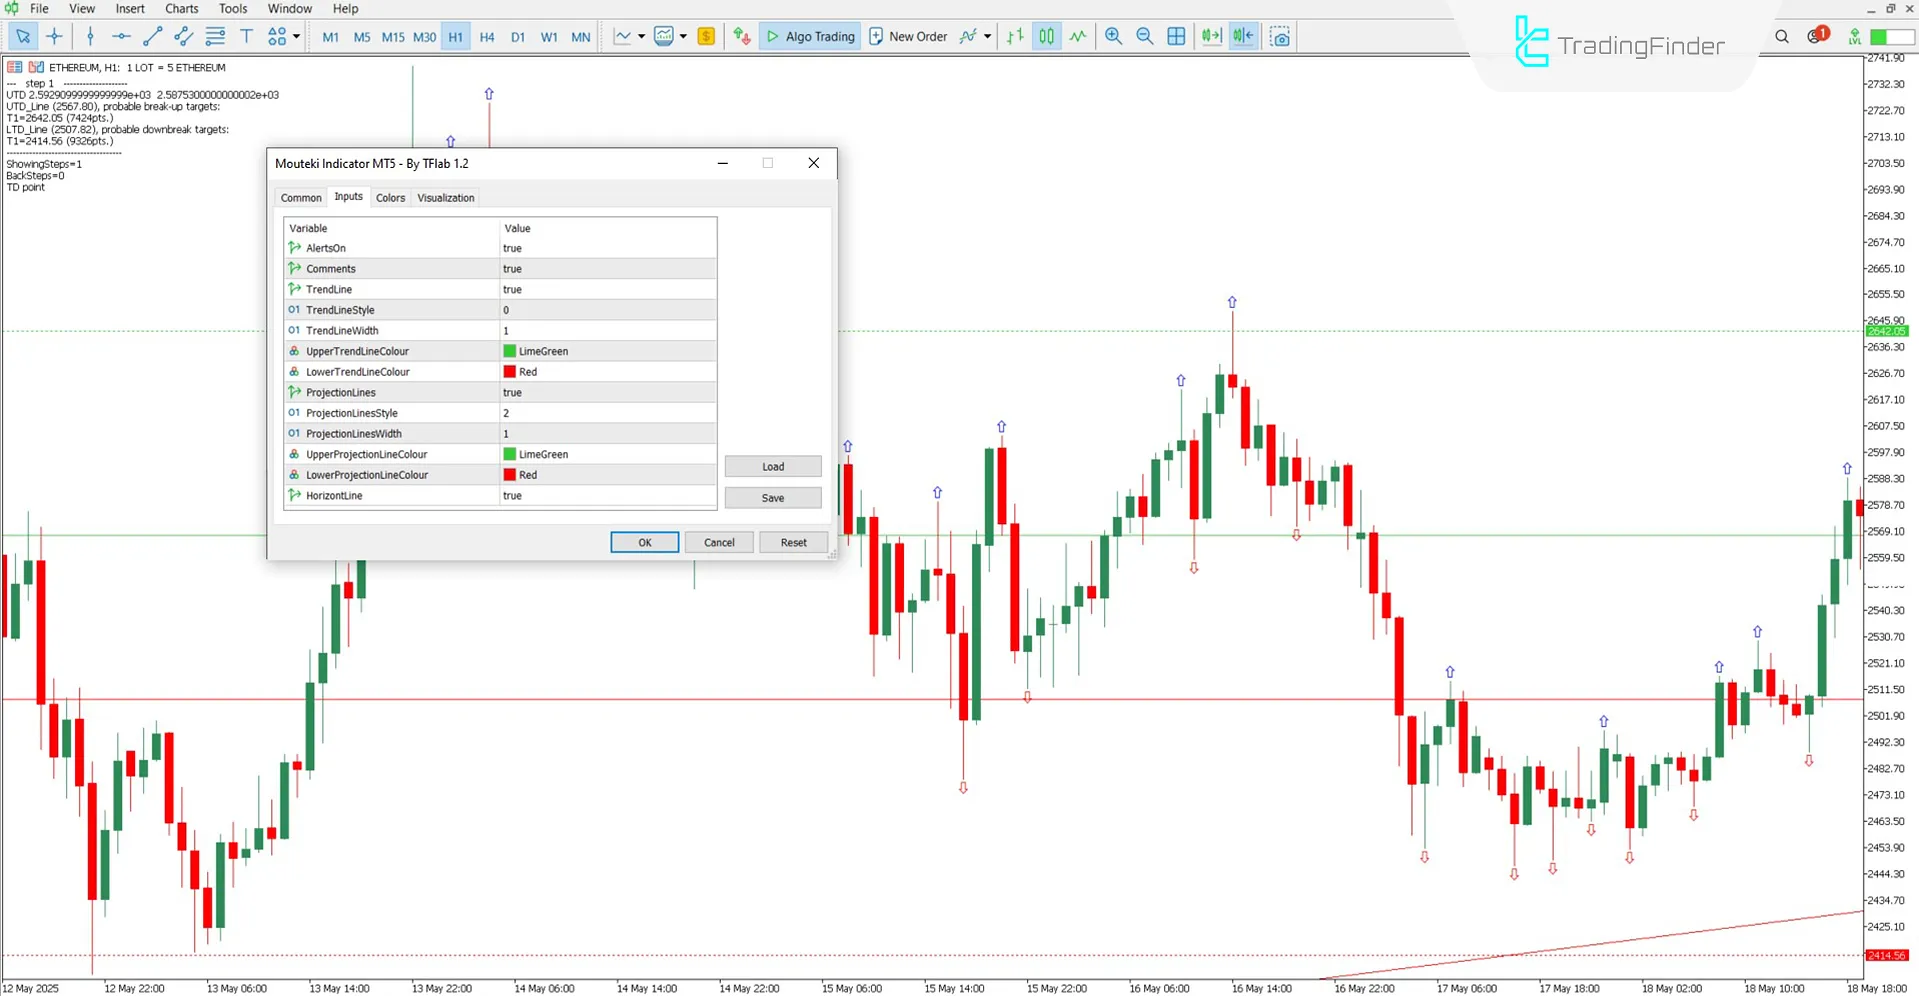
The image below displays the customizable settings for the Mouteki indicator:

- AlertsOn: Enable alerts
- Comments: Show comments
- TrendLine: Display main trendline
- TrendLineStyle: Style of the trendline
- TrendLineWidth: Set trendline thickness
- UpperTrendLineColour: The color of the upper trendline
- LowerTrendLineColour: The color of the lower trendline
- ProjectionLines: Enable projection lines
- ProjectionLineStyle: The style of the projection lines
- ProjectionLinesWidth: Thickness of the projection lines
- UpperProjectionLineColour: The color of the upper projection line
- LowerProjectionLineColour: The color of the lower projection line
- HorizontLine: Enable horizontal lines
Conclusion
The Mouteki indicator analyzes historical price data to automatically draw trendlines and key support and resistance levels on the chart. The primary function of this trading tool is to identify areas with a high probability of price reaction.
Additionally, by examining the current price position relative to these lines,the analyst can more accurately evaluate potential bullish or bearish movement scenarios.
Mouteki MT5 PDF
Mouteki MT5 PDF
Click to download Mouteki MT5 PDFAre the blue and red arrows indicators of buy/sell signals?
No; the blue arrow represents High points, and the red arrow marks Low points.
Is the Mouteki indicator usable on higher timeframes?
Yes, it supports multi-timeframe analysis and works on all timeframes.


