


The MACD Histogram Multi-Timeframe indicator is one of the
MetaTrader 5 indicators utilize color-coded bars to display the four MACD states, facilitating easier analysis.
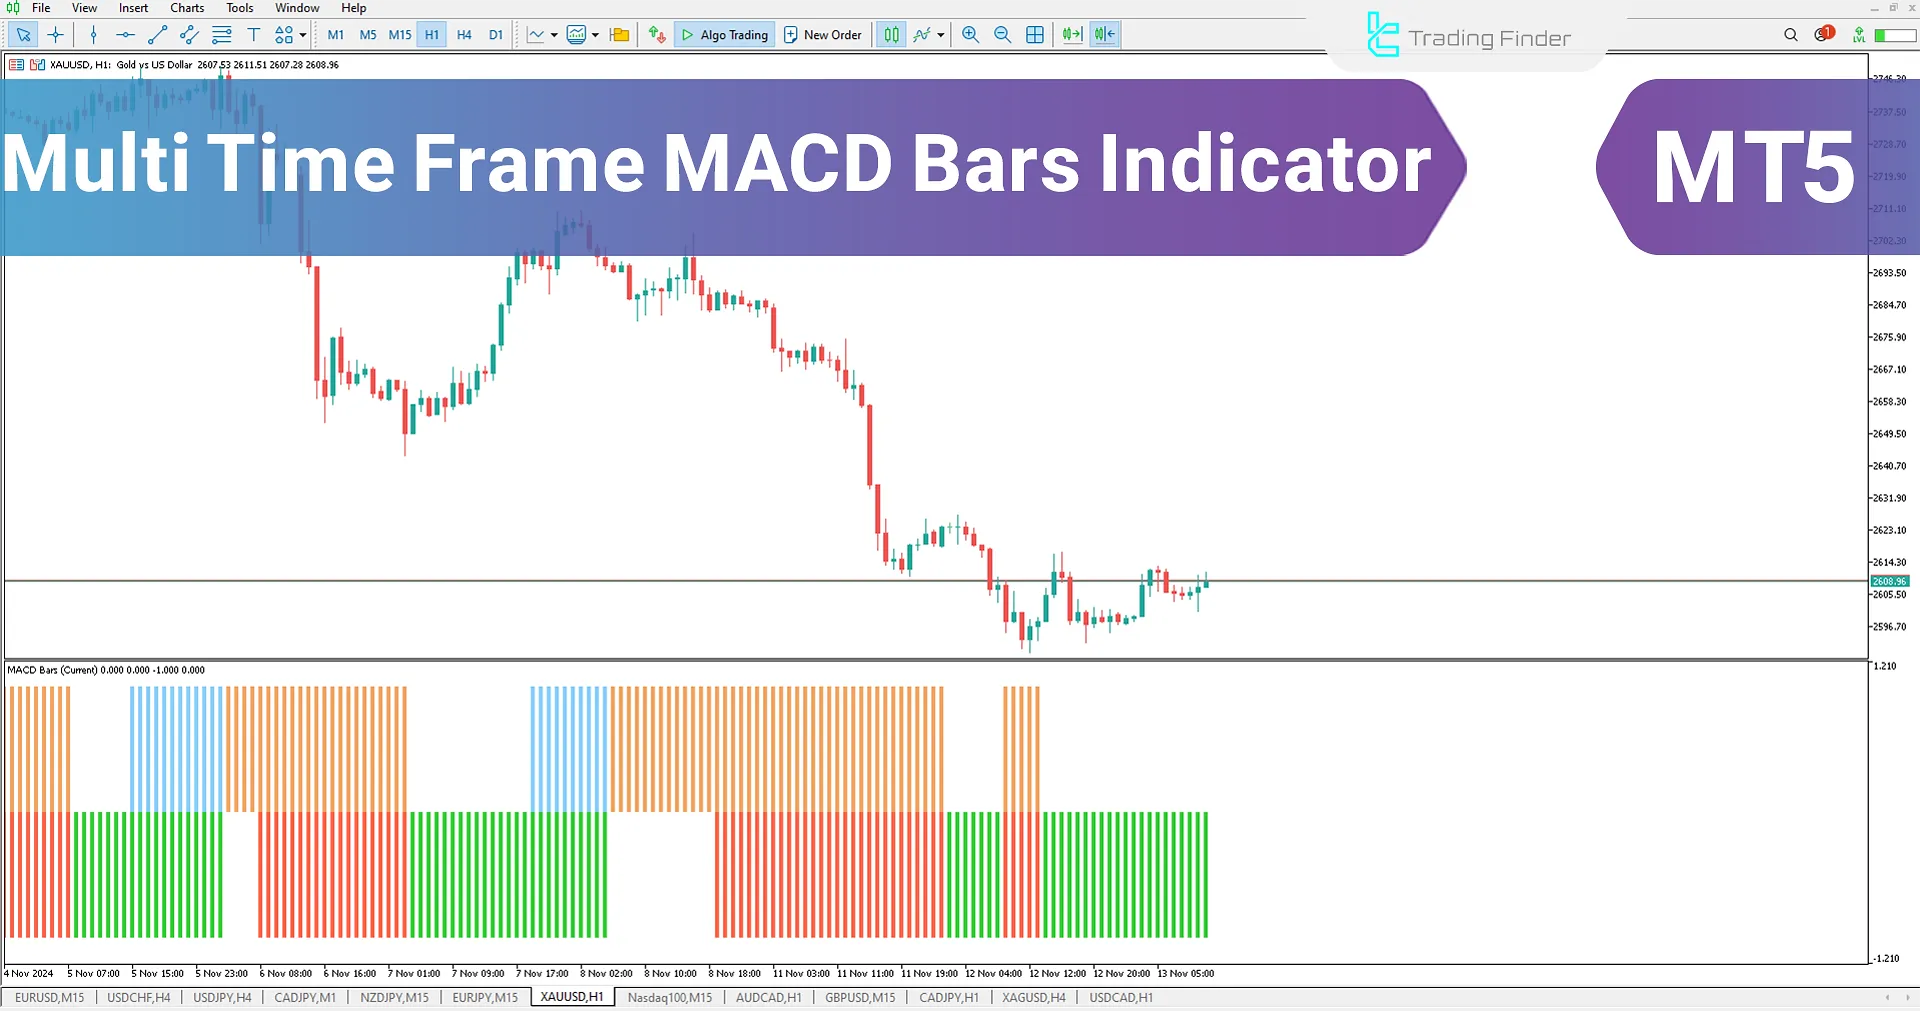
The color change of the histogram indicates the position of the MACD relative to the signal line and the zero level. This indicator allows for analysis across multiple timeframes.
Indicator Table
The specifications of the Multi-Timeframe MACD Bars Indicator are listed in the table below.
Indicator Categories: | Oscillators MT5 Indicators Signal & Forecast MT5 Indicators Trading Assist MT5 Indicators MACD Indicators for MetaTrader 5 |
Platforms: | MetaTrader 5 Indicators |
Trading Skills: | Elementary |
Indicator Types: | Lagging MT5 Indicators Entry & Exit MT5 Indicators |
Timeframe: | Multi-Timeframe MT5 Indicators |
Trading Style: | Intraday MT5 Indicators Scalper MT5 Indicators Day Trading MT5 Indicators |
Trading Instruments: | Forex MT5 Indicators Crypto MT5 Indicators Indices MT5 Indicators |
Indicator Overview
The Multi-Timeframe MACD Bars Indicator is a practical tool for traders who want to utilize MACD indicator analysis in their trading. This indicator is a trading tool that simplifies analysis and decision-making by displaying the four primary MACD states as distinct colors in the histogram. In this indicator, when the histogram is above the signal line, it is displayed in green. If the histogram moves above the zero level, its color changes to blue. When the histogram falls below the signal line, it turns red, and if it drops below the zero level, it changes to orange.
This tool also allows customization for any desired timeframe, enabling traders to easily view multi-timeframe analysis within the current timeframe and apply it to their trading strategies.
The uptrend in MACD Oscillator
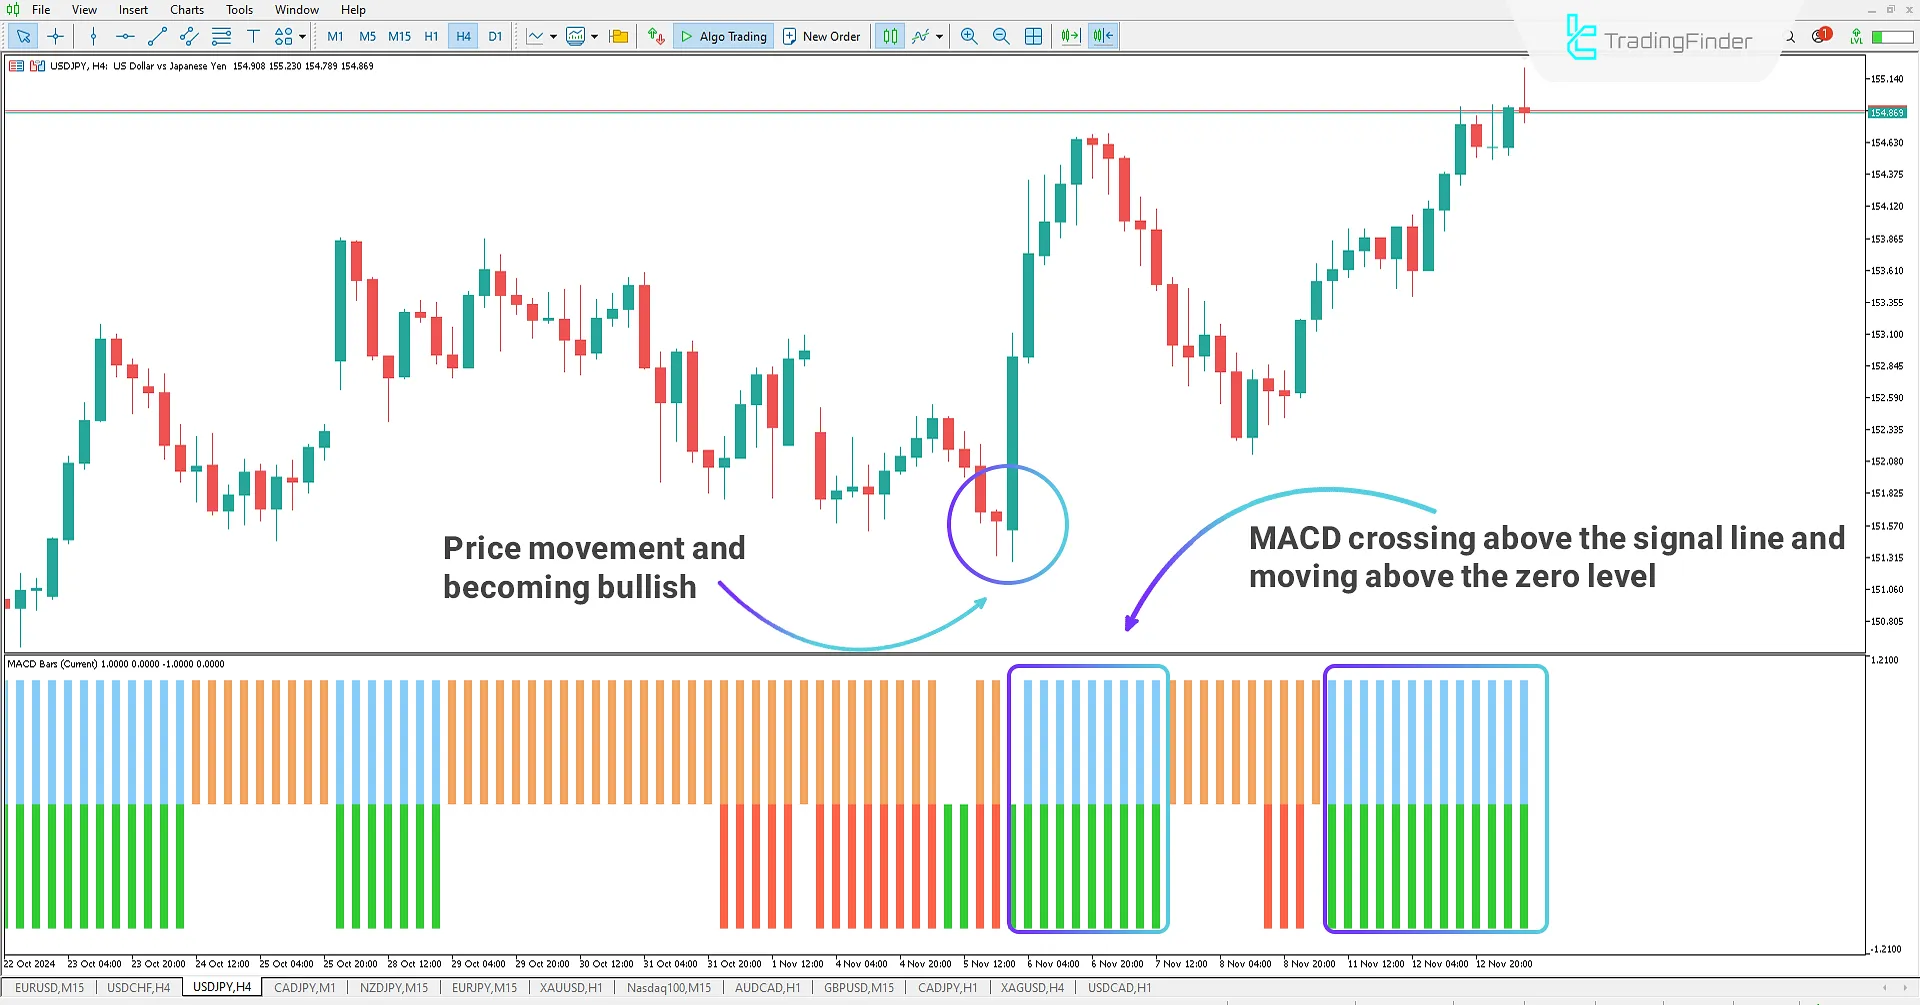
On the 4-hour chart of the USD/JPY currency pair, when the price is in a downtrend, the Multi-Timeframe MACD Bars Indicator helps traders identify potential reversal points by providing two key signals.
The green histogram indicates that the MACD line has crossed above the signal line, signaling a potential short-term uptrend.
On the other hand, the blue histogram appears when the MACD line crosses above the zero level, confirming that the price has entered a more positive phase.
Traders can use this indicator to detect trend reversals and identify reversal points. By adjusting the indicator's timeframe, they can analyze price movements across different timeframes and optimize their trading strategies.
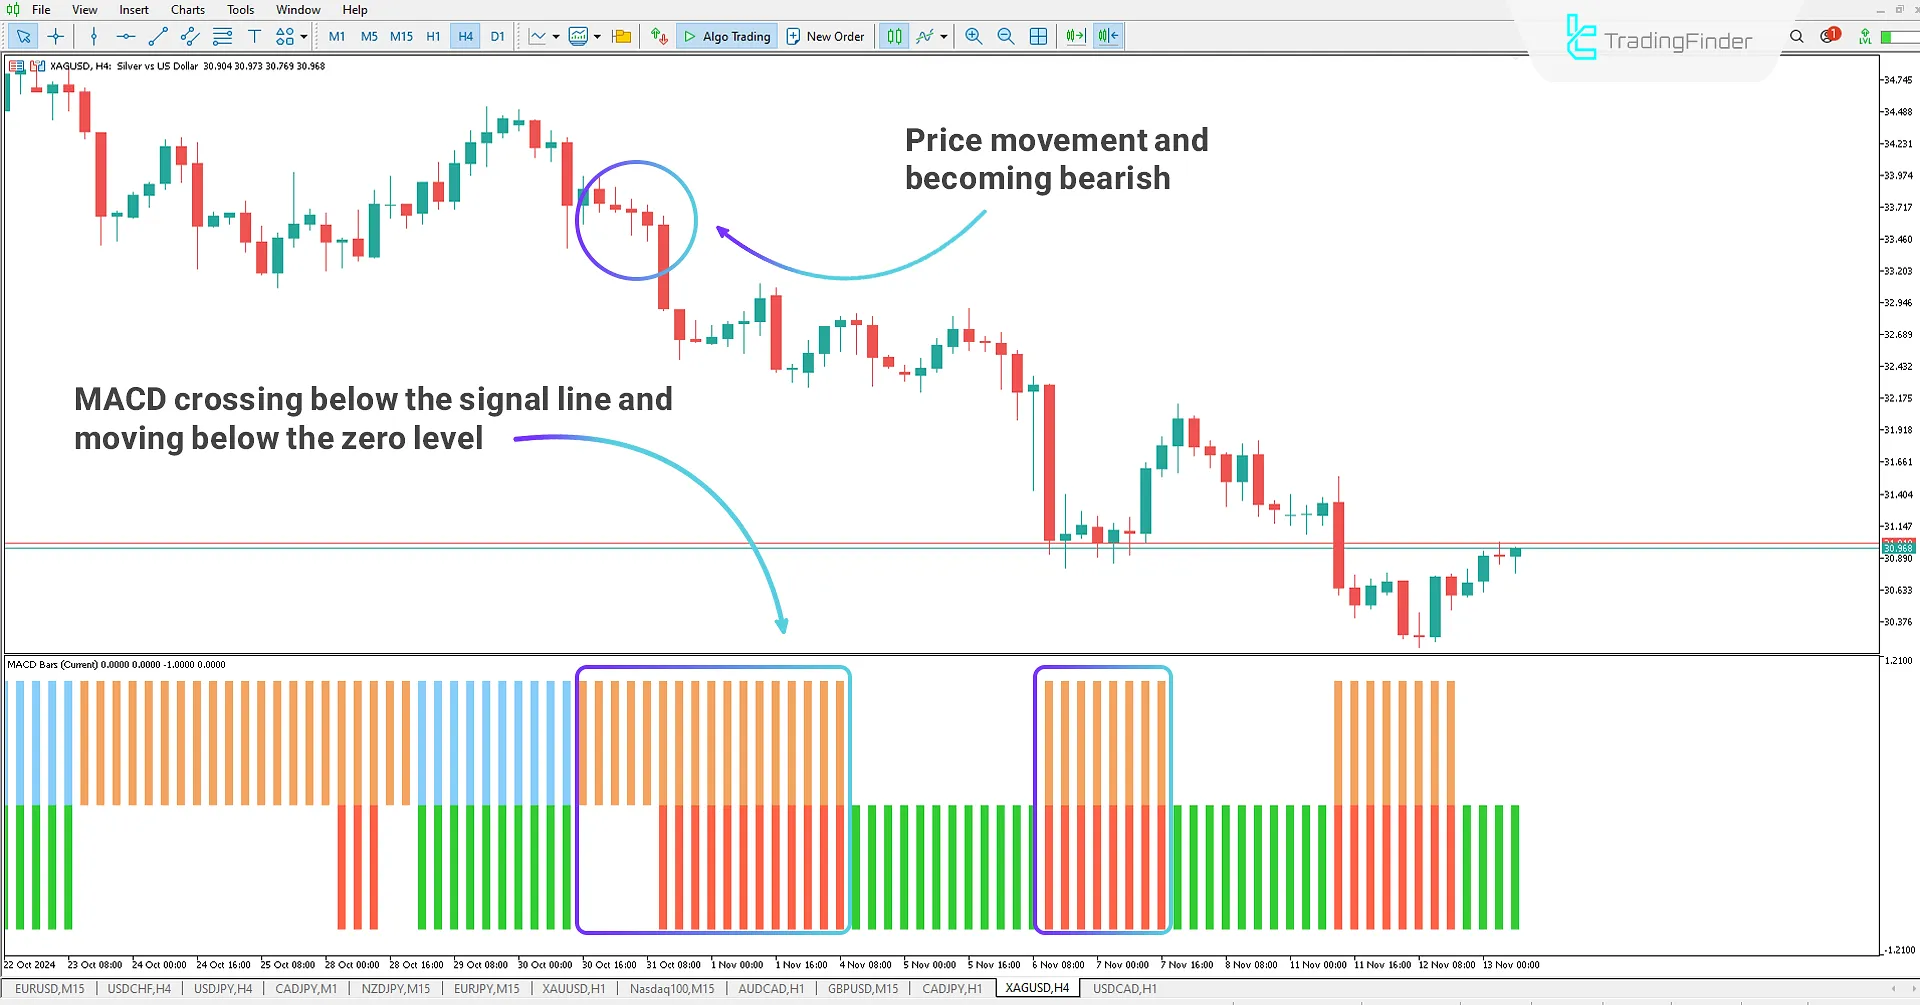
The downtrend in MACD Indicator
On the 4-hour chart of XAGUSD, the Multi-Timeframe MACD Bars Indicator assists traders with two key signals: the red histogram indicates that the MACD has moved below the signal line, suggesting the potential start of a downtrend, and the orange histogram confirms that the MACD has crossed below the zero level, signaling that the price has entered a bearish phase.
This tool helps identify trend changes and reversal points. By adjusting the timeframe, it enables more precise analysis and optimization of trading strategies.
MACD Indicator Settings
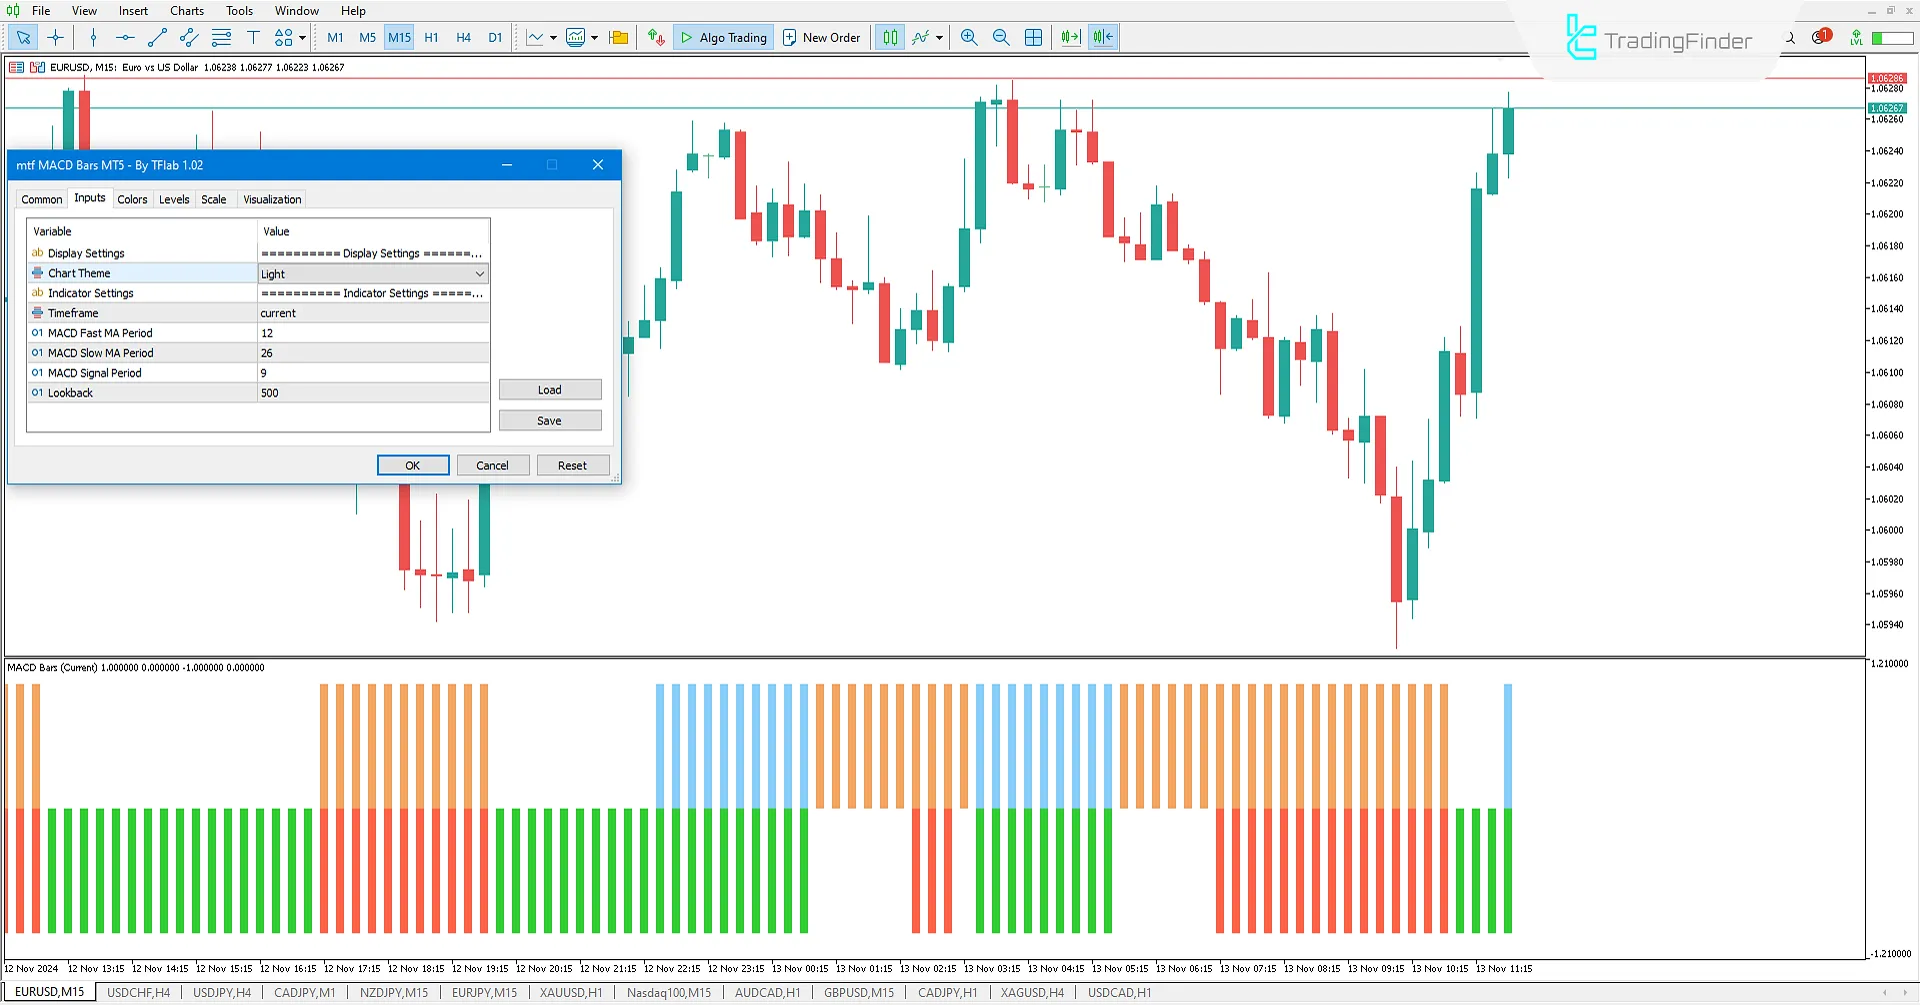
In the image below, the settings of the Multi-Timeframe MACD Bars Indicator are displayed:
Display Settings
- Chart Theme: Customize the indicator's theme
Indicator Settings
- Timeframe: Set the MACD timeframe
- MACD Fast MA Period: Set MACD fast moving average period
- MACD Slow MA Period: Set MACD slow-moving average period
- MACD Signal Period: Set MACD signal line period
- Lookback: Set the number of candles for calculation and display
Conclusion
The Multi-Timeframe MACD Bars Oscillator helps traders identify the MACD indicator state more accurately by displaying a colored histogram.
This indicator is a MetaTrader 5 trading tool that features four color-coded states: green (bullish above the signal line), blue (bullish confirmation above the zero level), red (potential bearish below the signal line), and orange (bearish warning below the zero level).
This tool is ideal for multi-timeframe analysis, providing more precise signals and optimized trading decisions.
Multi Time Frame MACD MT5 PDF
Multi Time Frame MACD MT5 PDF
Click to download Multi Time Frame MACD MT5 PDFIs this indicator only applicable to specific timeframes?
No, the Multi Time Frame MACD Bars indicator is designed to analyze multiple timeframes. Traders can set it for any timeframe to receive more accurate trading signals.
Who is this indicator suitable for?
This indicator suits traders interested in advanced technical and multi-timeframe analyses, especially those seeking more precise buy and sell signals from the MACD indicator across different timeframes.


