


![Nen Star Harmonic Pattern Indicator for MT5 Download - [TradingFinder]](https://cdn.tradingfinder.com/image/361178/4-85-en-nen-star-harmonic-pattern-mt5-1.webp)
![Nen Star Harmonic Pattern Indicator for MT5 Download - [TradingFinder] 1](https://cdn.tradingfinder.com/image/361177/4-85-en-nen-star-harmonic-pattern-mt5-2.webp)
![Nen Star Harmonic Pattern Indicator for MT5 Download - [TradingFinder] 2](https://cdn.tradingfinder.com/image/361175/4-85-en-nen-star-harmonic-pattern-mt5-3.webp)
![Nen Star Harmonic Pattern Indicator for MT5 Download - [TradingFinder] 3](https://cdn.tradingfinder.com/image/361176/4-85-en-nen-star-harmonic-pattern-mt5-4.webp)
On July 1, 2025, in version 2, alert/notification and signal functionality was added to this indicator
The Nen Star Harmonic Pattern Indicator is designed for MetaTrader 5 and is used as an advanced tool for identifying price reversal zones with high accuracy.
Unlike simpler tools, this indicator is based on a combination of precise wave structure and extended Fibonacci ratios.
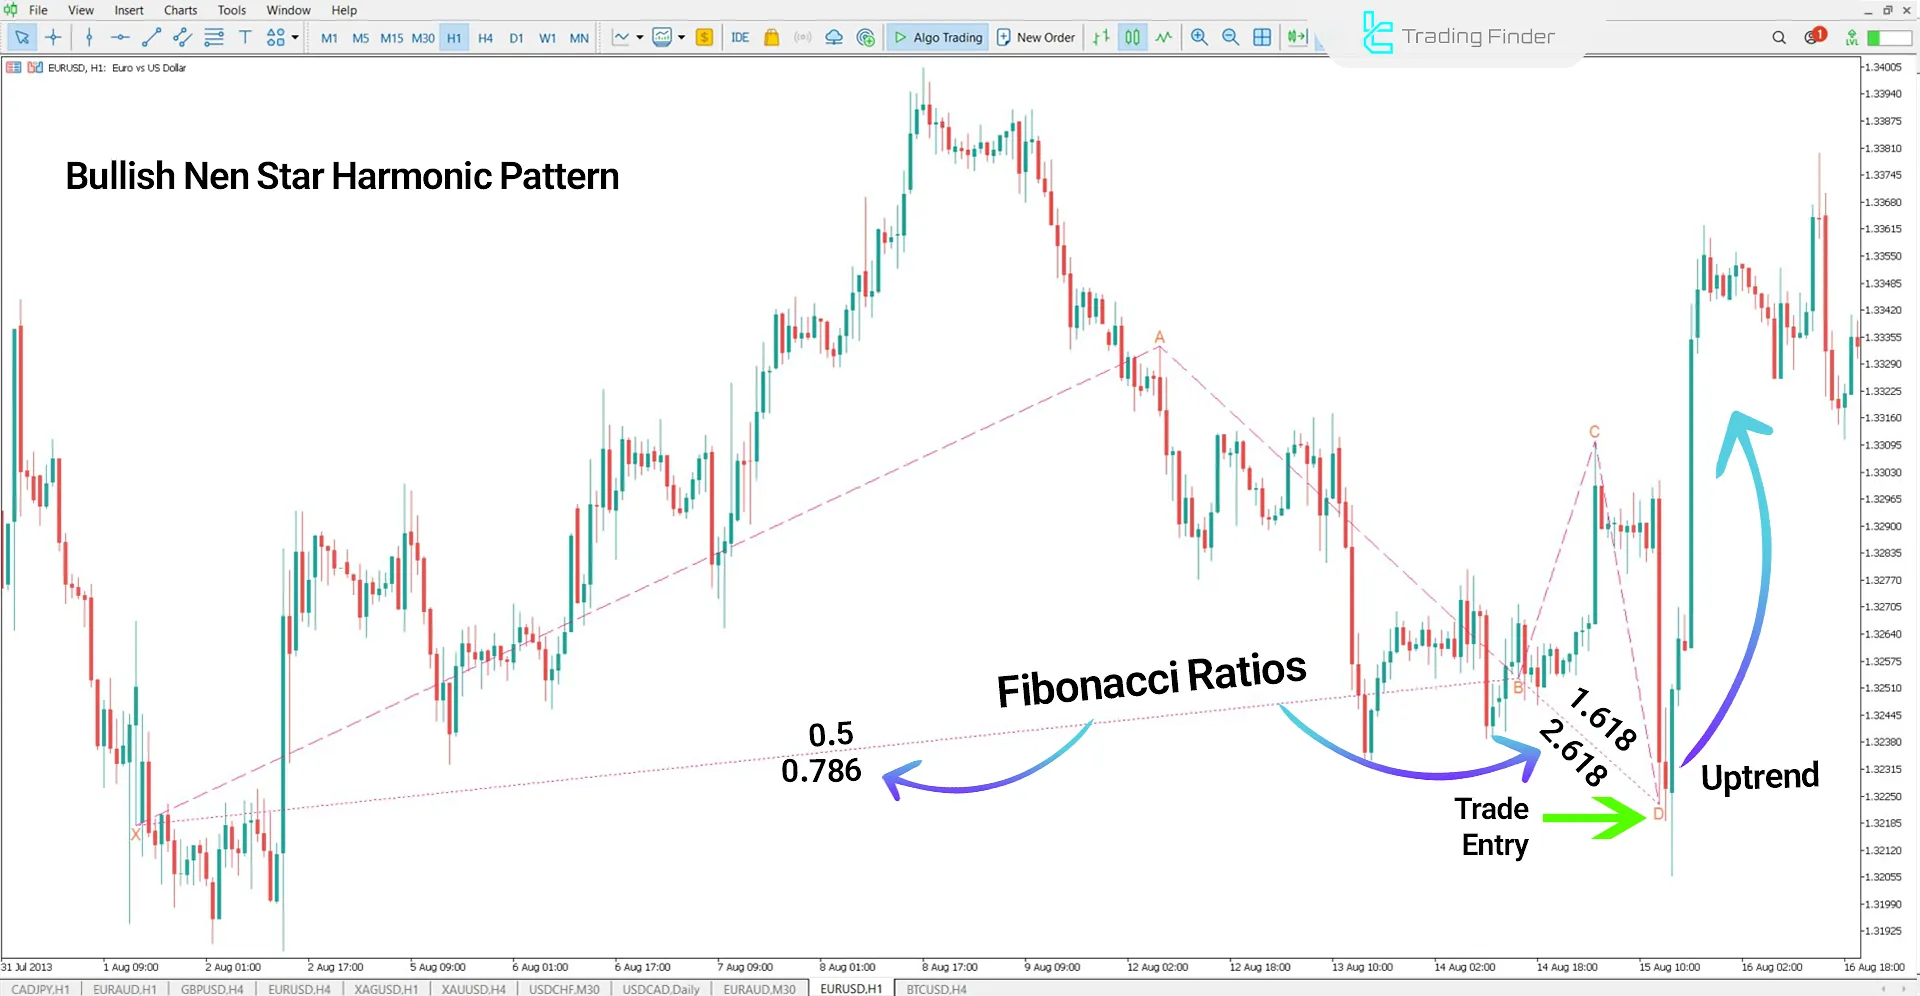
The Nen Star Pattern consists of five key points: X, A, B, C, and D, and can appear in either bullish (resembling "M") or bearish (resembling "W") patterns.
Nen Star Harmonic Pattern Indicator Features Table
The specifications of the Nen Star Harmonic Pattern Indicator are summarized in the table below.
Indicator Categories: | Support & Resistance MT5 Indicators Chart & Classic MT5 Indicators Harmonic MT5 Indicators |
Platforms: | MetaTrader 5 Indicators |
Trading Skills: | Intermediate |
Indicator Types: | Reversal MT5 Indicators |
Timeframe: | Multi-Timeframe MT5 Indicators |
Trading Style: | Intraday MT5 Indicators |
Trading Instruments: | Forex MT5 Indicators Crypto MT5 Indicators Stock MT5 Indicators Forward MT5 Indicators |
Indicator Overview
The Nen Star Harmonic Pattern structure consists of five price waves defined by Fibonacci ratios:
- XA: Initial price move from point X to A
- AB: Price retracement toward point B
- BC: Price extension between 113% and 141.4% of AB
- CD: Price reversal between 127.2% and 200% of AB
- D (PRZ): Potential Reversal Zone (PRZ) – The area where price reversal is likely to occur, and where traders can assess entry or exit signals.
Indicator in Bullish Trend
On the EUR/USD 1-hour chart, the bullish Nen Star pattern forms after the XA, AB waves, and an extension of C to about 138% of AB, followed by the CD bearish phase.
Then, point D falls near 161.8%, acting as the Potential Reversal Zone (PRZ).
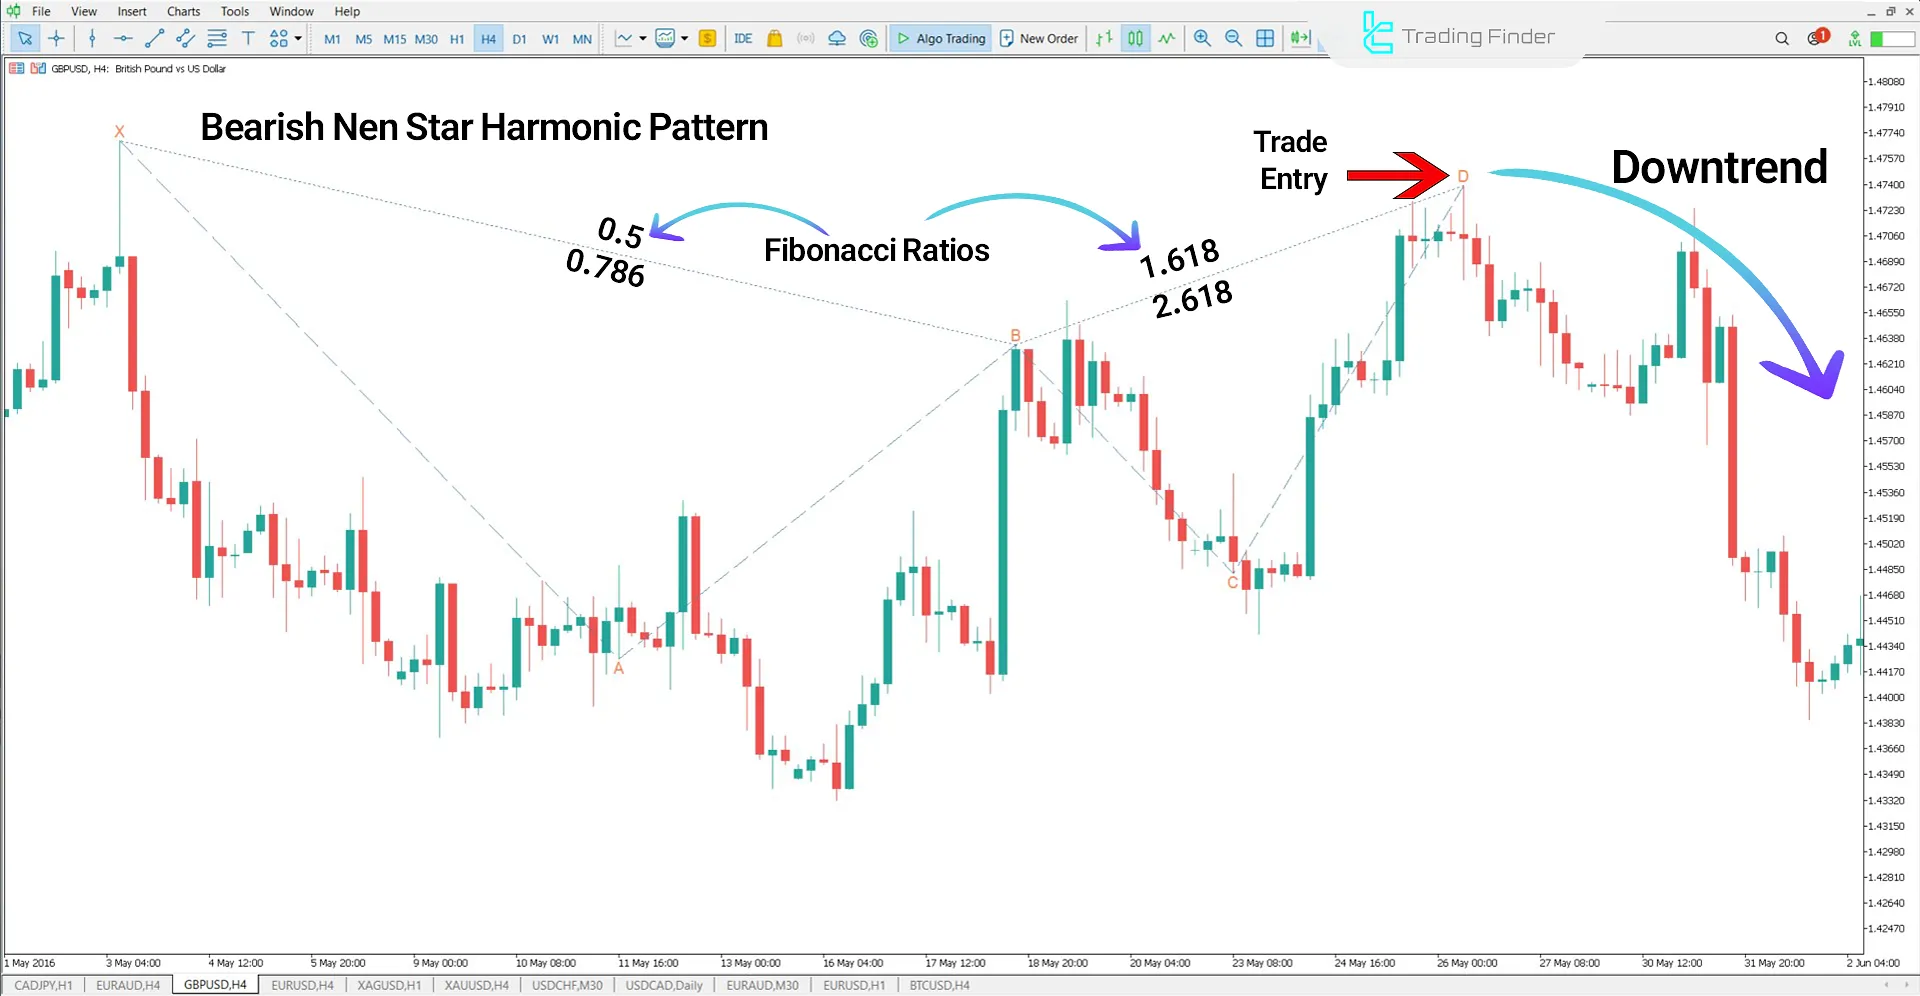
Indicator in Bearish Trend
On the GBP/USD 4-hour chart, the bearish Nen Star pattern completes with waves XA, AB, and C extending to 141.4% of AB, followed by price reaching D, near 200%, where the reversal (PRZ) happens, signaling the beginning of a bearish trend.
Indicator Settings
The settings for the Nen Star Harmonic Pattern Indicator are shown below:
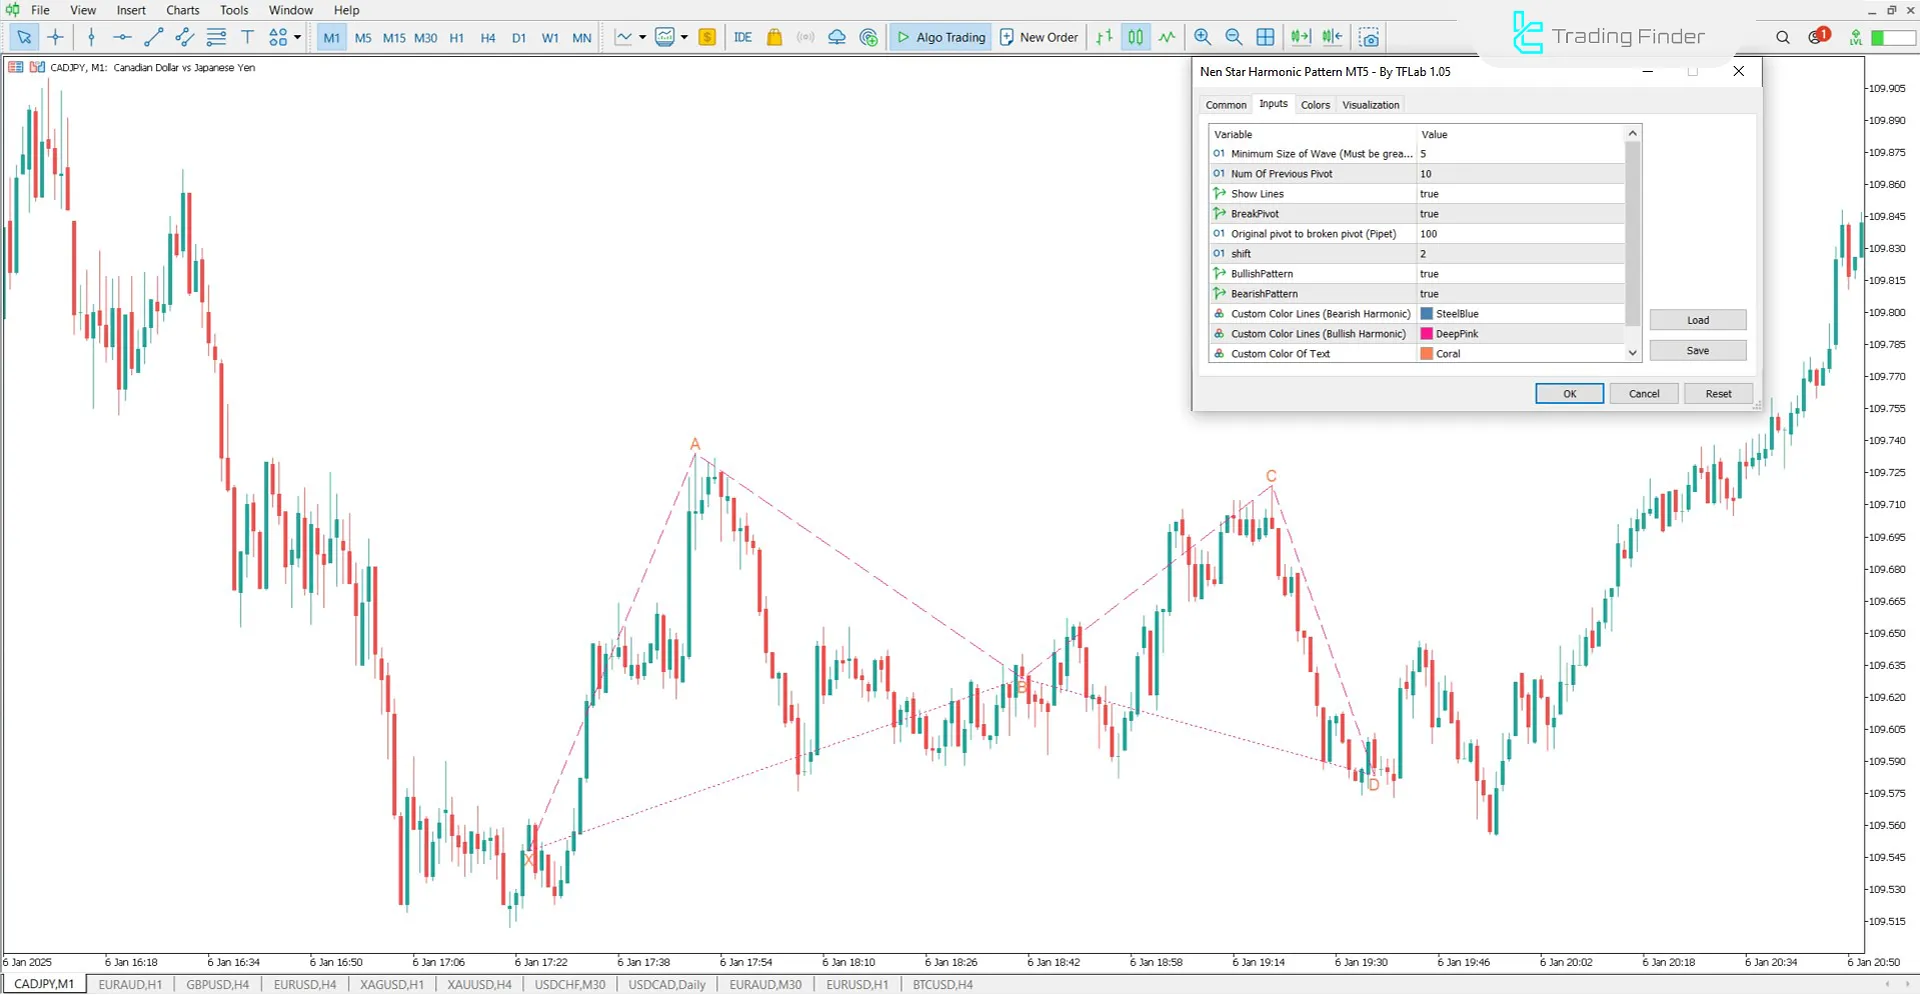
- Minimum Length Of Wave (candle): Minimum number of candles for wave detection
- Num Of Previous Candle: Number of past candles used in calculations
- Show Lines: Show or hide pattern lines
- BreakPivot: Check for pivot breaks
- Original pivot to broken pivot (Pipet): Distance in pipets between original and broken pivot
- Shift: Data offset in the chart
- BullishPattern: Enable bullish pattern detection
- BearishPattern: Enable bearish pattern detection
- Style Of Line: Line style selector
- Width Of Line: Thickness of displayed lines
- Custom Color Lines (Bearish Harmonic): Color for bearish pattern lines
- Custom Color Lines (Bullish Harmonic): Color for bullish pattern lines
- Custom Color Of Text: Text color setting
Conclusion
The Nen Star Harmonic Pattern Indicator is a specialized tool for identifying reversal points in market technical analysis based on wave structure and Fibonacci extension ratios.
This indicator precisely breaks down the waves from XA to CD, defining the PRZ as the potential reversal zone.
With its ability to analyze in multiple time frames and display the pattern graphically, this indicator increases the accuracy of trading decisions.
Nen Star Harmonic Pattern MT5 PDF
Nen Star Harmonic Pattern MT5 PDF
Click to download Nen Star Harmonic Pattern MT5 PDFWhat is the Nen Star Harmonic Pattern Indicator used for?
The Nen Star Harmonic Pattern Indicator identifies price reversal points in the market using Fibonacci ratios and wave structures.
What makes the Nen Star Pattern different from other harmonic patterns?
The main difference is the use of specific extension ratios of the AB wave to define points C and D in the pattern.


