![Neuro Trend Indicator MetaTrader 5 Download - [TradingFinder]](https://cdn.tradingfinder.com/image/423787/2-81-en-neuro-trend-mt5-1.webp)
![Neuro Trend Indicator MetaTrader 5 Download - [TradingFinder] 0](https://cdn.tradingfinder.com/image/423787/2-81-en-neuro-trend-mt5-1.webp)
![Neuro Trend Indicator MetaTrader 5 Download - [TradingFinder] 1](https://cdn.tradingfinder.com/image/423786/2-81-en-neuro-trend-mt5-2.webp)
![Neuro Trend Indicator MetaTrader 5 Download - [TradingFinder] 2](https://cdn.tradingfinder.com/image/423785/2-81-en-neuro-trend-mt5-3.webp)
![Neuro Trend Indicator MetaTrader 5 Download - [TradingFinder] 3](https://cdn.tradingfinder.com/image/423788/2-81-en-neuro-trend-mt5-4.webp)
The Neuro Trend Indicator, using artificial neural networks, analyzes market trends and predicts probable price movements.
This trading tool displays buy and sell signals through colored dots (blue and red) and trend lines (the blue line indicates buyer strength and the red line indicates seller dominance).
Neuro Trend Indicator Table
The general specifications of the Neuro Trend Indicator are presented in the table below.
Indicator Categories: | Price Action MT5 Indicators Trading Assist MT5 Indicators Bands & Channels MT5 Indicators |
Platforms: | MetaTrader 5 Indicators |
Trading Skills: | Intermediate |
Indicator Types: | Reversal MT5 Indicators |
Timeframe: | Multi-Timeframe MT5 Indicators |
Trading Style: | Intraday MT5 Indicators |
Trading Instruments: | Forex MT5 Indicators Crypto MT5 Indicators Stock MT5 Indicators |
Overview of the Neuro Trend Indicator
The Neuro Trend Indicator is one of the technical analysis tools on the MetaTrader 5 platform, built upon a set of intelligent algorithms. By analyzing historical data and aligning it with the current market conditions, it forecasts potential future trends.
The output of this analysis is displayed as colored dots on the chart, which highlight essential zones for trend reversal or continuation.
Uptrend Conditions
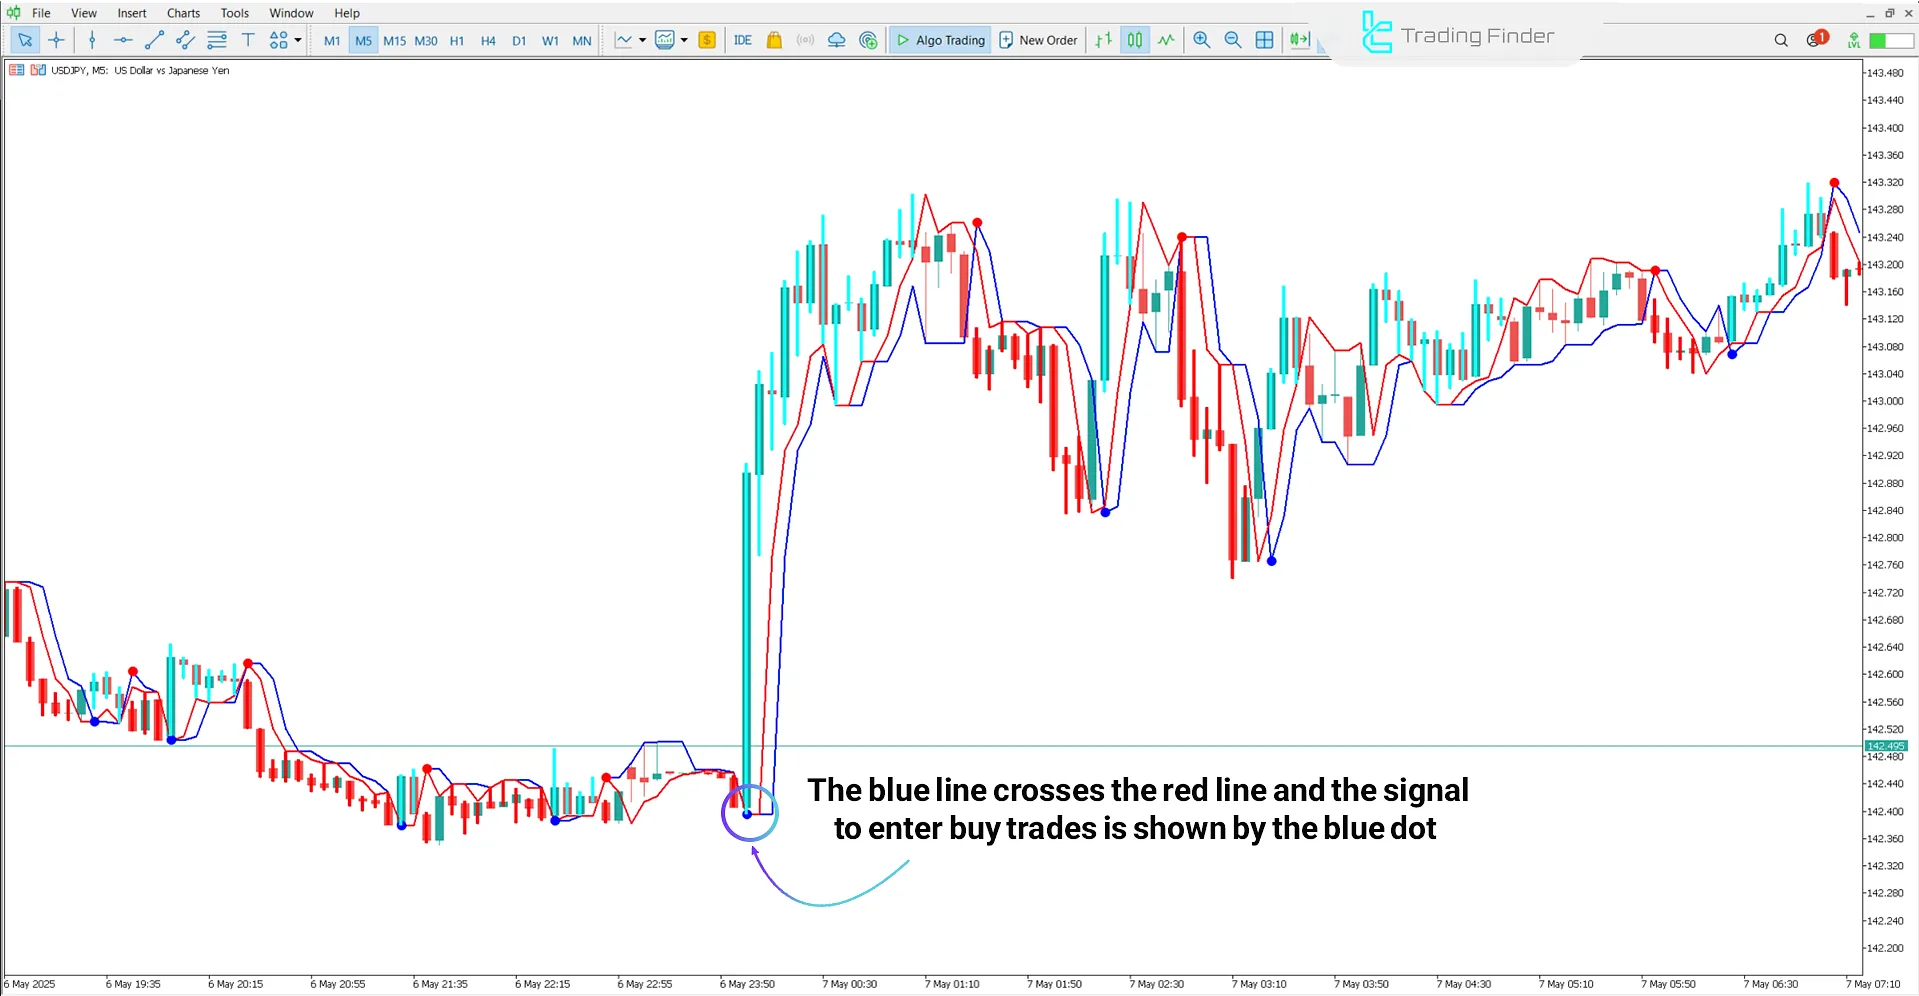
The chart below shows the USD/JPY currency pair in the 5-minute timeframe. When the blue line of the indicator displays an upward curve, it signifies the beginning of an uptrend and growing buying pressure, forming a Buy entry zone. The blue signal dot confirms the bullish strength of the trend.

Downtrend Conditions
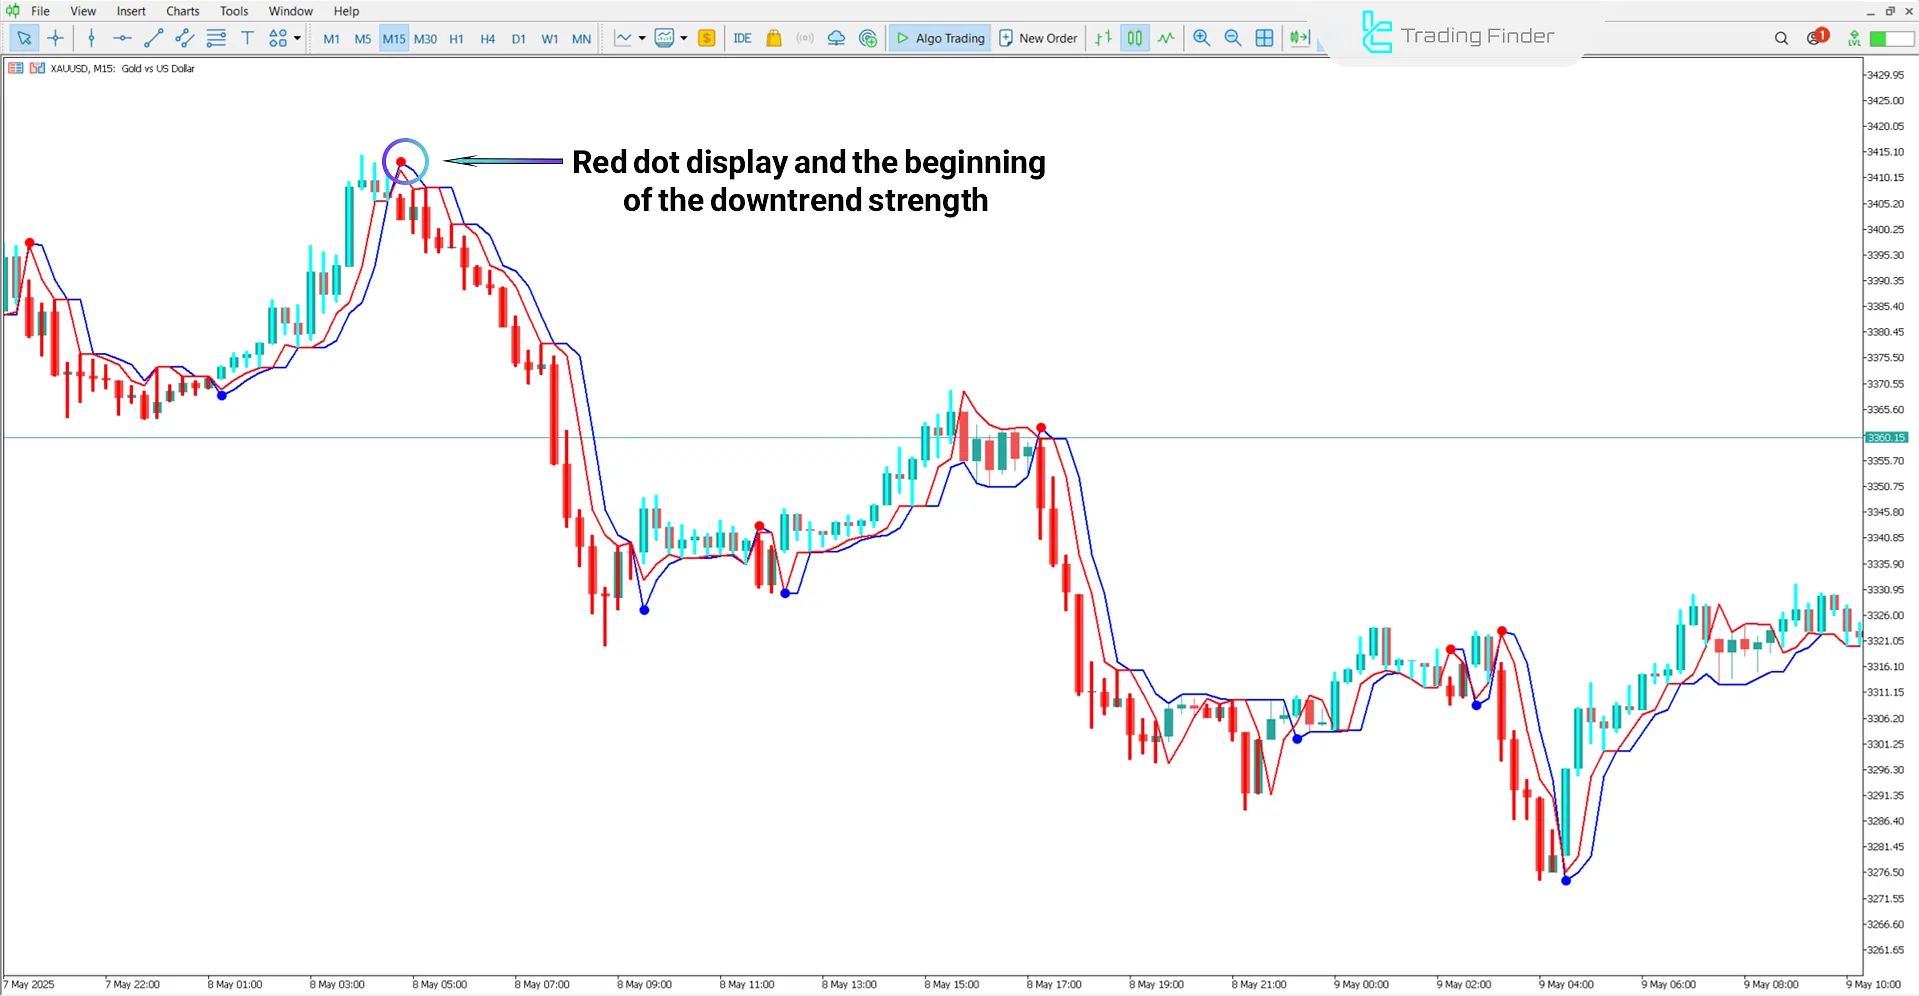
The price chart below shows gold (XAU/USD) in the 15-minute timeframe. In this indicator, a red dot at the end of a trend, combined with a downward curvature of the blue line that crosses from top to bottom, signals the beginning of a new downtrend and increasing selling pressure.
This signal indicates either an exit from buy positions or an entry into sell trades.

Neuro Trend Indicator Settings
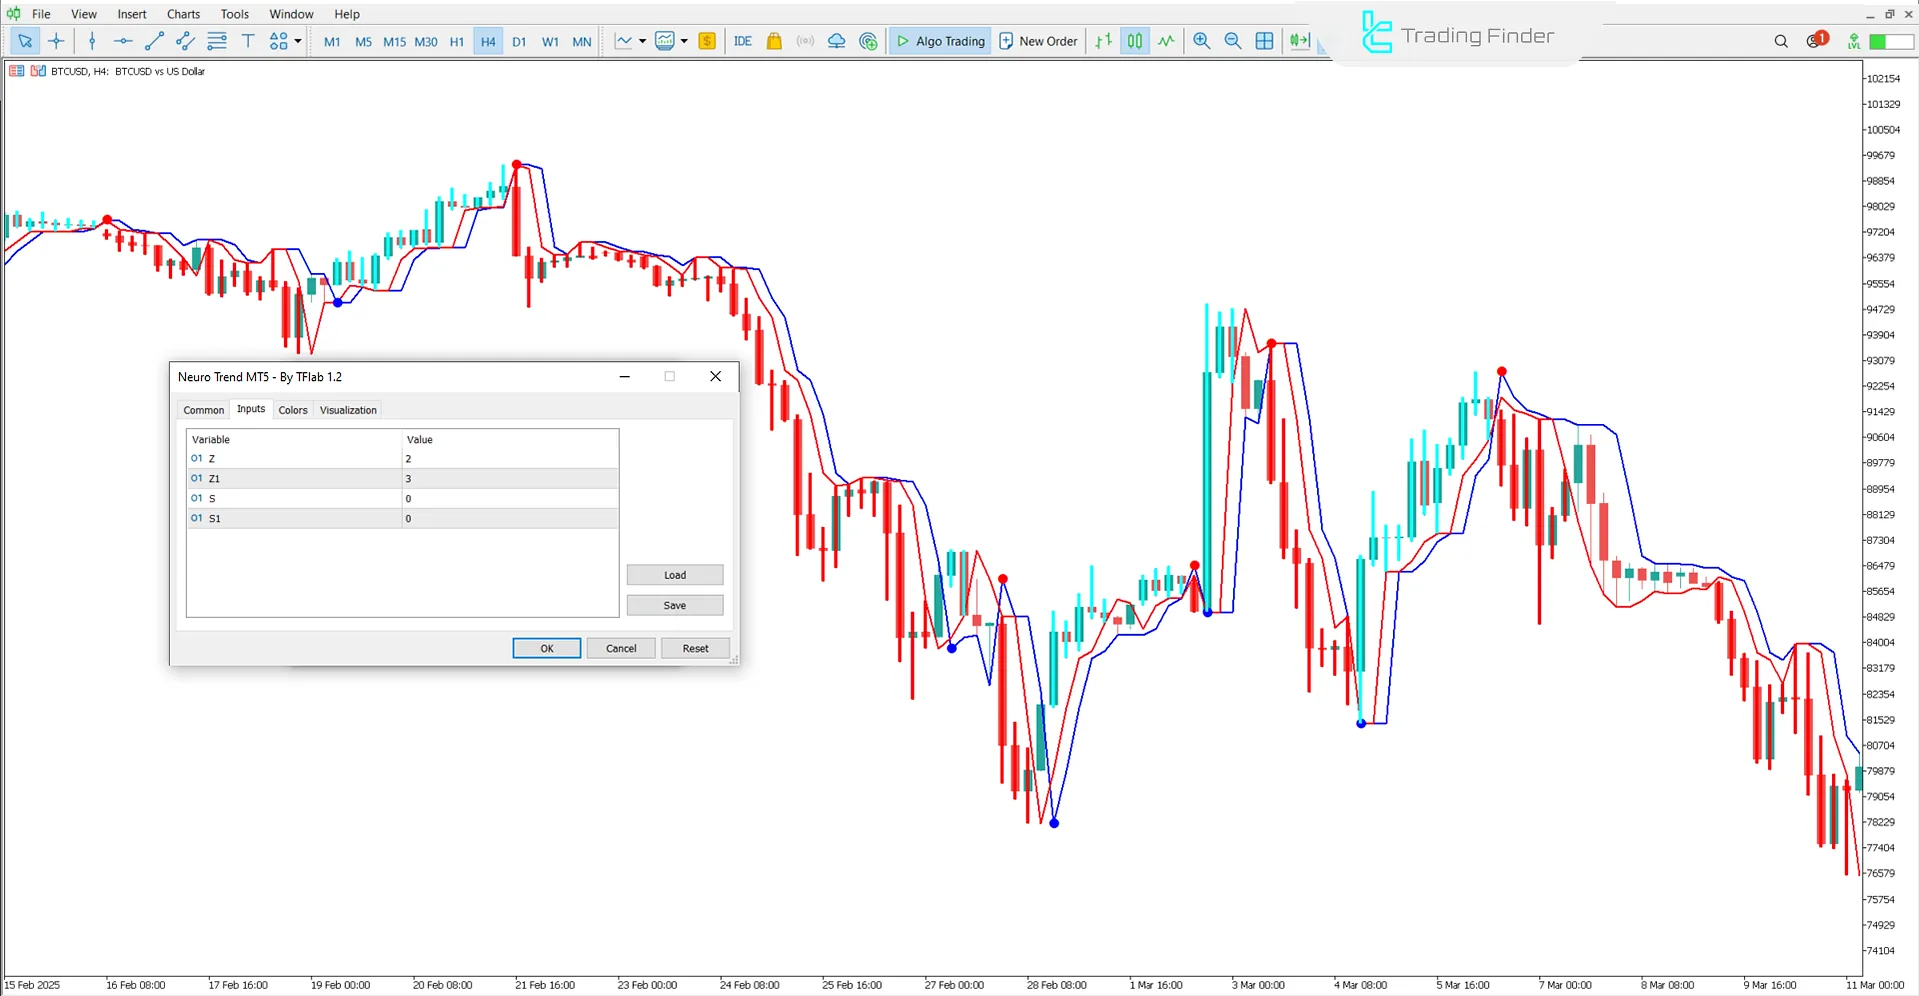
The image below shows the settings panel of the Neuro Trend Indicator, which allows customization of its parameters to suit trading strategies:

- Z: Smoothing Coefficient Z;
- Z1: Smoothing Coefficient Z1;
- S: Signal Sensitivity S;
- S1: Signal Sensitivity S1.
Conclusion
The Neuro Trend Indicator is an analytical tool based on artificial neural networks that process price data and identify patterns to predict potential market turning points. By analyzing the behavior of signal lines (blue and red) and confirmation markers on the chart, it highlights ideal zones for entering buy or sell trades.
Is the Neuro Trend Indicator applicable to all financial markets?
Yes, this indicator can be used across various markets, including Forex, stocks, cryptocurrencies, and indices.
Which timeframes are suitable for using the Neuro Trend Indicator?
This trading tool is compatible with all timeframes.


