![New Murrey Math Levels Indicator on MT5 - Free Download [TFlab]](https://cdn.tradingfinder.com/image/492845/2-120-en-new-murrey-math-levels-mt5-1.webp)
![New Murrey Math Levels Indicator on MT5 - Free Download [TFlab] 0](https://cdn.tradingfinder.com/image/492845/2-120-en-new-murrey-math-levels-mt5-1.webp)
![New Murrey Math Levels Indicator on MT5 - Free Download [TFlab] 1](https://cdn.tradingfinder.com/image/492844/2-120-en-new-murrey-math-levels-mt5-2.webp)
![New Murrey Math Levels Indicator on MT5 - Free Download [TFlab] 2](https://cdn.tradingfinder.com/image/492835/2-120-en-new-murrey-math-levels-mt5-3.webp)
![New Murrey Math Levels Indicator on MT5 - Free Download [TFlab] 3](https://cdn.tradingfinder.com/image/492843/2-120-en-new-murrey-math-levels-mt5-4.webp)
The New Murrey Math Levels Indicator, using mathematical concepts, draws numeric technical analysis ranges as boundaries of price equilibrium on the MetaTrader 5 platform.
These levels are plotted from +2/8 to -2/8, each playing a specific role in market structure, such as:
- Dynamic support and resistance
- Potential reversal zones
- Overbought or oversold areas
New Murrey Math Levels Indicator Table
The following table presents the general specifications of the New Murrey Math Levels Indicator on the MetaTrader 5 platform:
Indicator Categories: | Support & Resistance MT5 Indicators Trading Assist MT5 Indicators Levels MT5 Indicators |
Platforms: | MetaTrader 5 Indicators |
Trading Skills: | Intermediate |
Indicator Types: | Breakout MT5 Indicators Reversal MT5 Indicators |
Timeframe: | Multi-Timeframe MT5 Indicators |
Trading Style: | Intraday MT5 Indicators |
Trading Instruments: | Forex MT5 Indicators Crypto MT5 Indicators Stock MT5 Indicators Commodity MT5 Indicators Indices MT5 Indicators Share Stock MT5 Indicators |
Overview of the New Murrey Math Levels Indicator
The New Murrey Math Levels Indicator plots 13 levels, creating a numerical framework to analyze price behavior within market structure. Among these, the following levels hold greater significance:
- Level 4/8: The central and balanced zone of the market; an area where price often fluctuates or changes direction;
- Levels 8/8 and 0/8: Overbought and oversold boundaries, typically acting as price reversal zones;
- Levels +2/8 and -2/8: Zones outside the normal price fluctuation range; crossing these levels requires strong momentum and confirmed trading volume.
Indicator in an Uptrend
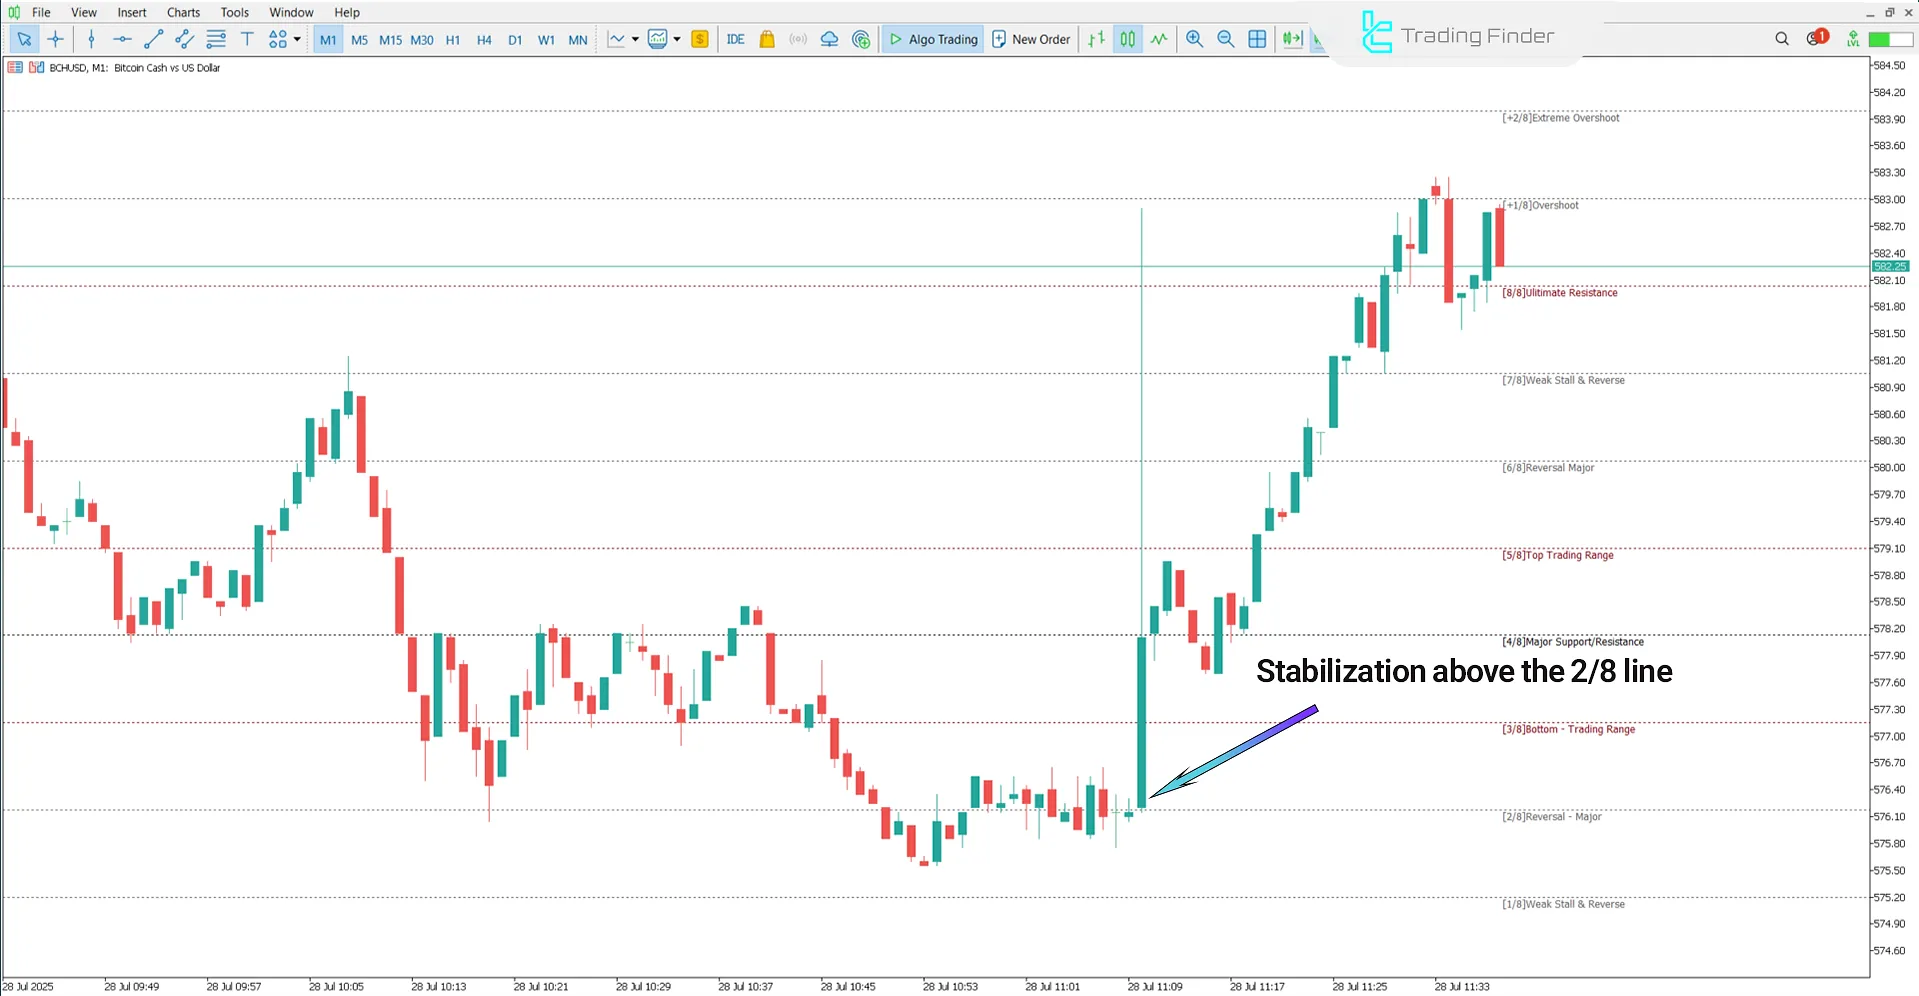
The following chart displays the price movement of Bitcoin Cash (BCH/USD) on the 1-minute timeframe. In bullish structures, price stabilization above level 2/8 indicates buyer pressure in the market.
Under such conditions, the market tends to move toward higher levels, like 1/8, reflecting the strength and continuity of the uptrend.

Indicator in a Downtrend
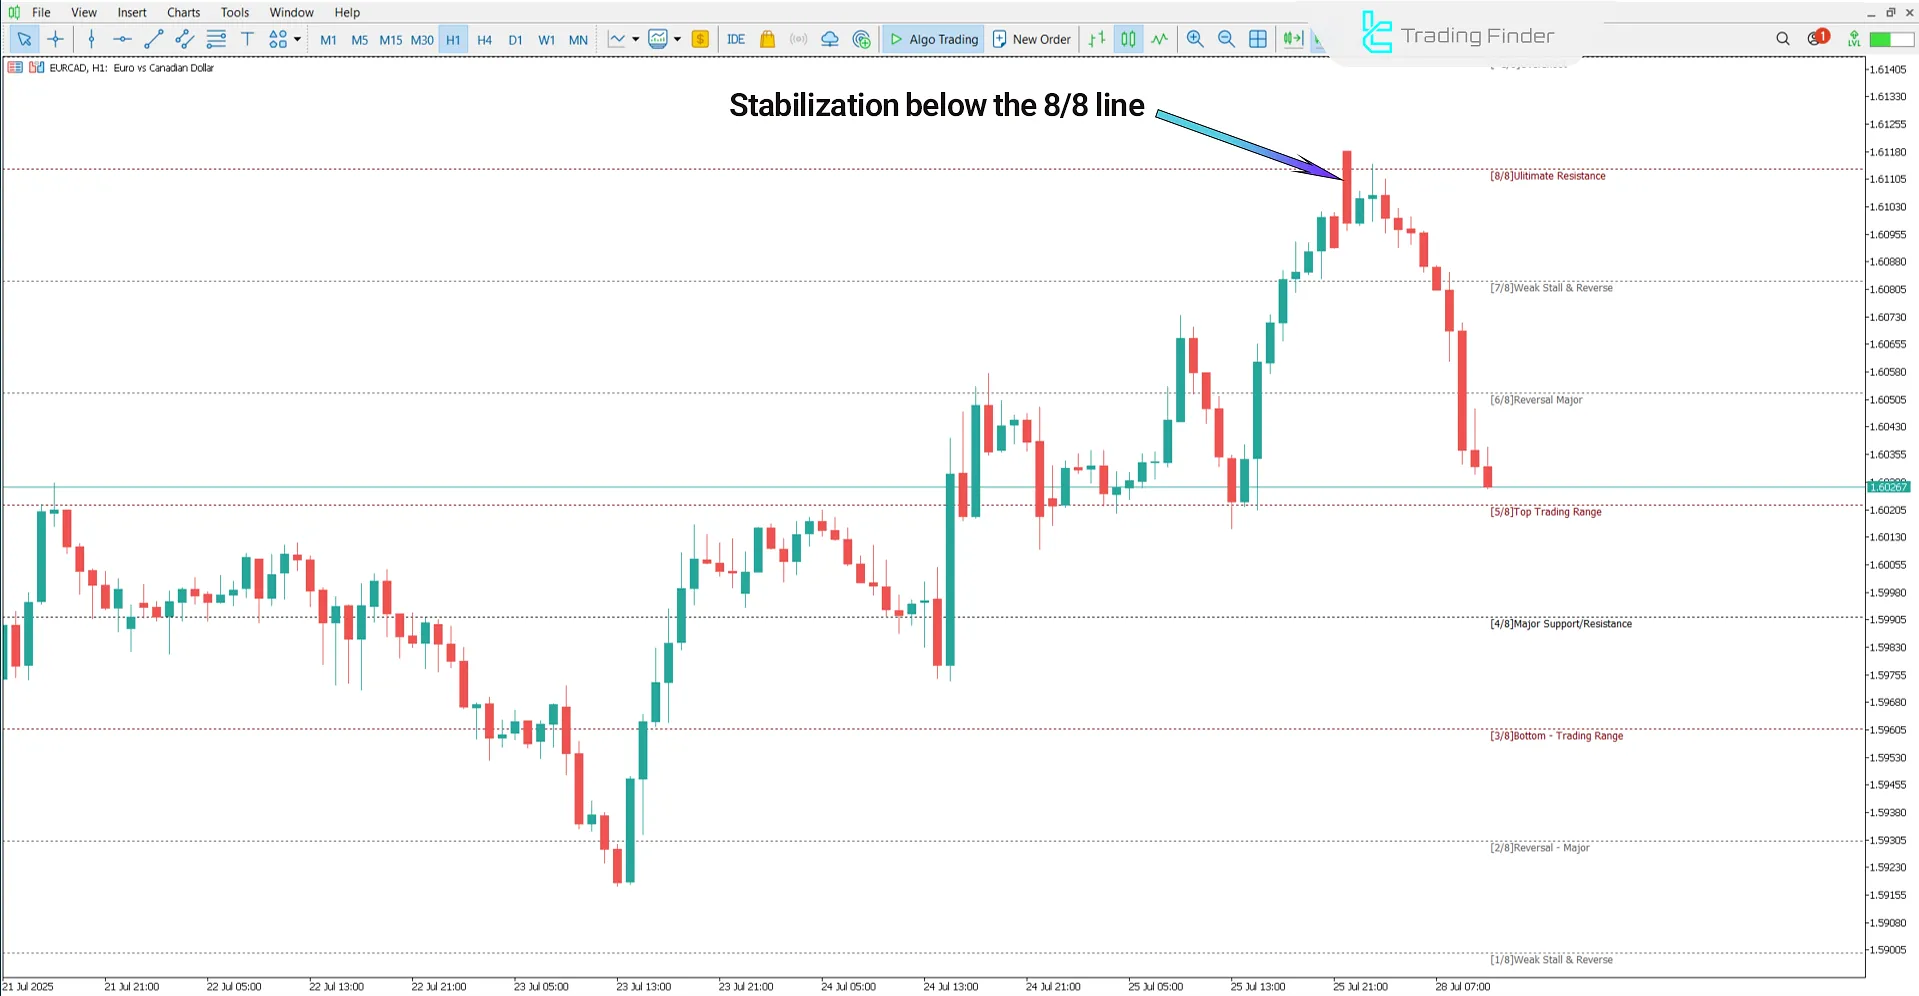
The image below shows the price chart of EUR/CAD on the 1-hour timeframe. In a downtrend, breaking below the 8/8 level and stabilizing underneath it shows increasing selling pressure.
In such a case, the price typically moves toward lower levels like 2/8 and 0/8, signaling strong bearish momentum.

New Murrey Math Levels Indicator Settings
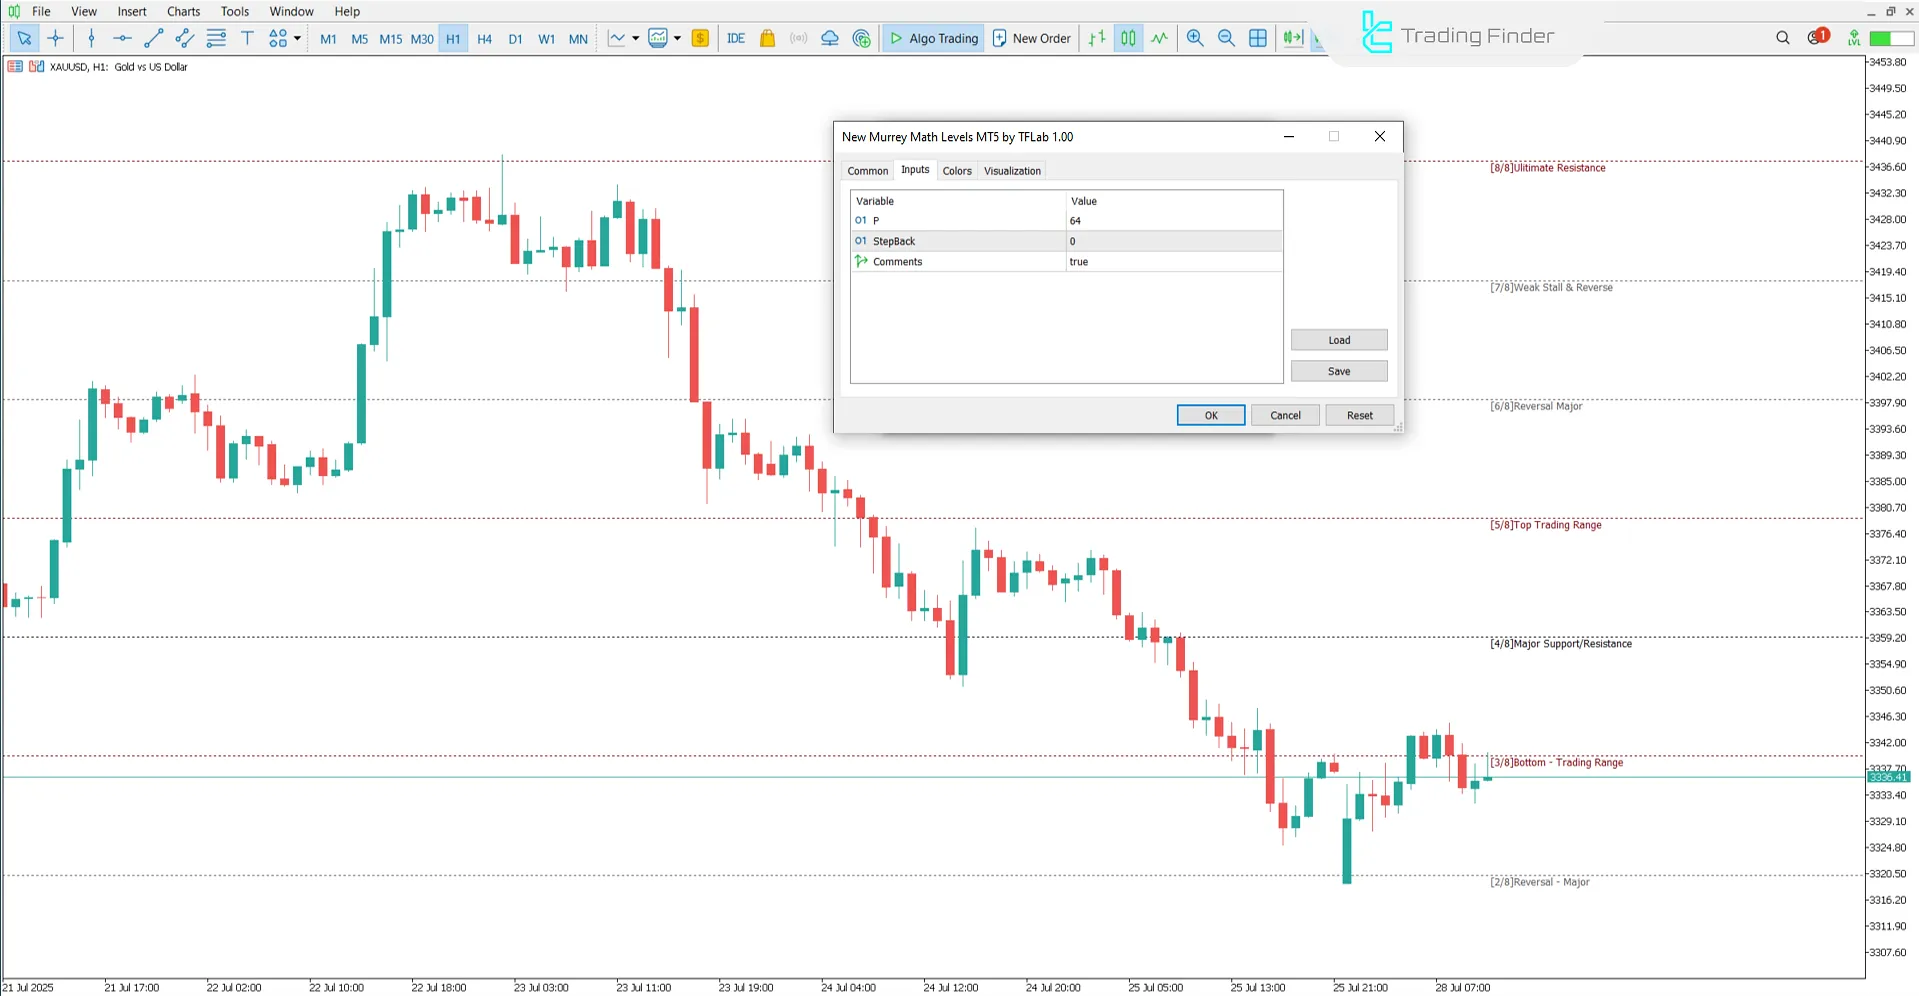
The image below shows the settings panel of the New Murrey Math Levels Indicator on MetaTrader 5:

- P: Main calculation parameter;
- StepBack: Number of candles the indicator looks back;
- Comments: Displays messages on the chart.
Conclusion
The New Murrey Math Levels Indicator, by drawing fixed numeric levels, offers a structured framework for precisely identifying support resistance, and price reversal zones.
In this trading tool, mid-levels such as 4/8 reflect market equilibrium, while levels 0/8 and 8/8 are commonly regarded as zones of technical reversal.
New Murrey Math Levels Indicator on MT5 PDF
New Murrey Math Levels Indicator on MT5 PDF
Click to download New Murrey Math Levels Indicator on MT5 PDFCan the New Murrey Math Levels Indicator be combined with other tools?
Yes, combining this indicator with tools like RSI, MACD, or candlestick patterns can significantly increase the reliability of the signals.
What is the best timeframe to use the New Murrey Math Levels Indicator?
This trading tool performs effectively on all timeframes, from 1-minute charts to daily charts.


