![Omega Trend Indicator for MT5 Download – Free – [TradingFinder]](https://cdn.tradingfinder.com/image/525028/13-201-en-omega-trend-mt5-01.webp)
![Omega Trend Indicator for MT5 Download – Free – [TradingFinder] 0](https://cdn.tradingfinder.com/image/525028/13-201-en-omega-trend-mt5-01.webp)
![Omega Trend Indicator for MT5 Download – Free – [TradingFinder] 1](https://cdn.tradingfinder.com/image/525027/13-201-en-omega-trend-mt5-02.webp)
![Omega Trend Indicator for MT5 Download – Free – [TradingFinder] 2](https://cdn.tradingfinder.com/image/525030/13-201-en-omega-trend-mt5-03.webp)
![Omega Trend Indicator for MT5 Download – Free – [TradingFinder] 3](https://cdn.tradingfinder.com/image/525029/13-201-en-omega-trend-mt5-04.webp)
The Omega Trend Indicator is one of the technical analysis tools responsible for identifying the prevailing market trend.
This indicator, by using two lines in blue and magenta, creates a dynamic zone on the chart and visually illustrates the bullish or bearish price movement.
Specifications Table of the Omega Trend Indicator
The specifications of the Omega Trend Indicator are as follows.
Indicator Categories: | Signal & Forecast MT5 Indicators Trading Assist MT5 Indicators Bands & Channels MT5 Indicators |
Platforms: | MetaTrader 5 Indicators |
Trading Skills: | Elementary |
Indicator Types: | Reversal MT5 Indicators |
Timeframe: | Multi-Timeframe MT5 Indicators |
Trading Style: | Swing Trading MT5 Indicators Scalper MT5 Indicators Day Trading MT5 Indicators |
Trading Instruments: | Forex MT5 Indicators Crypto MT5 Indicators Stock MT5 Indicators |
Omega Trend Indicator at a Glance
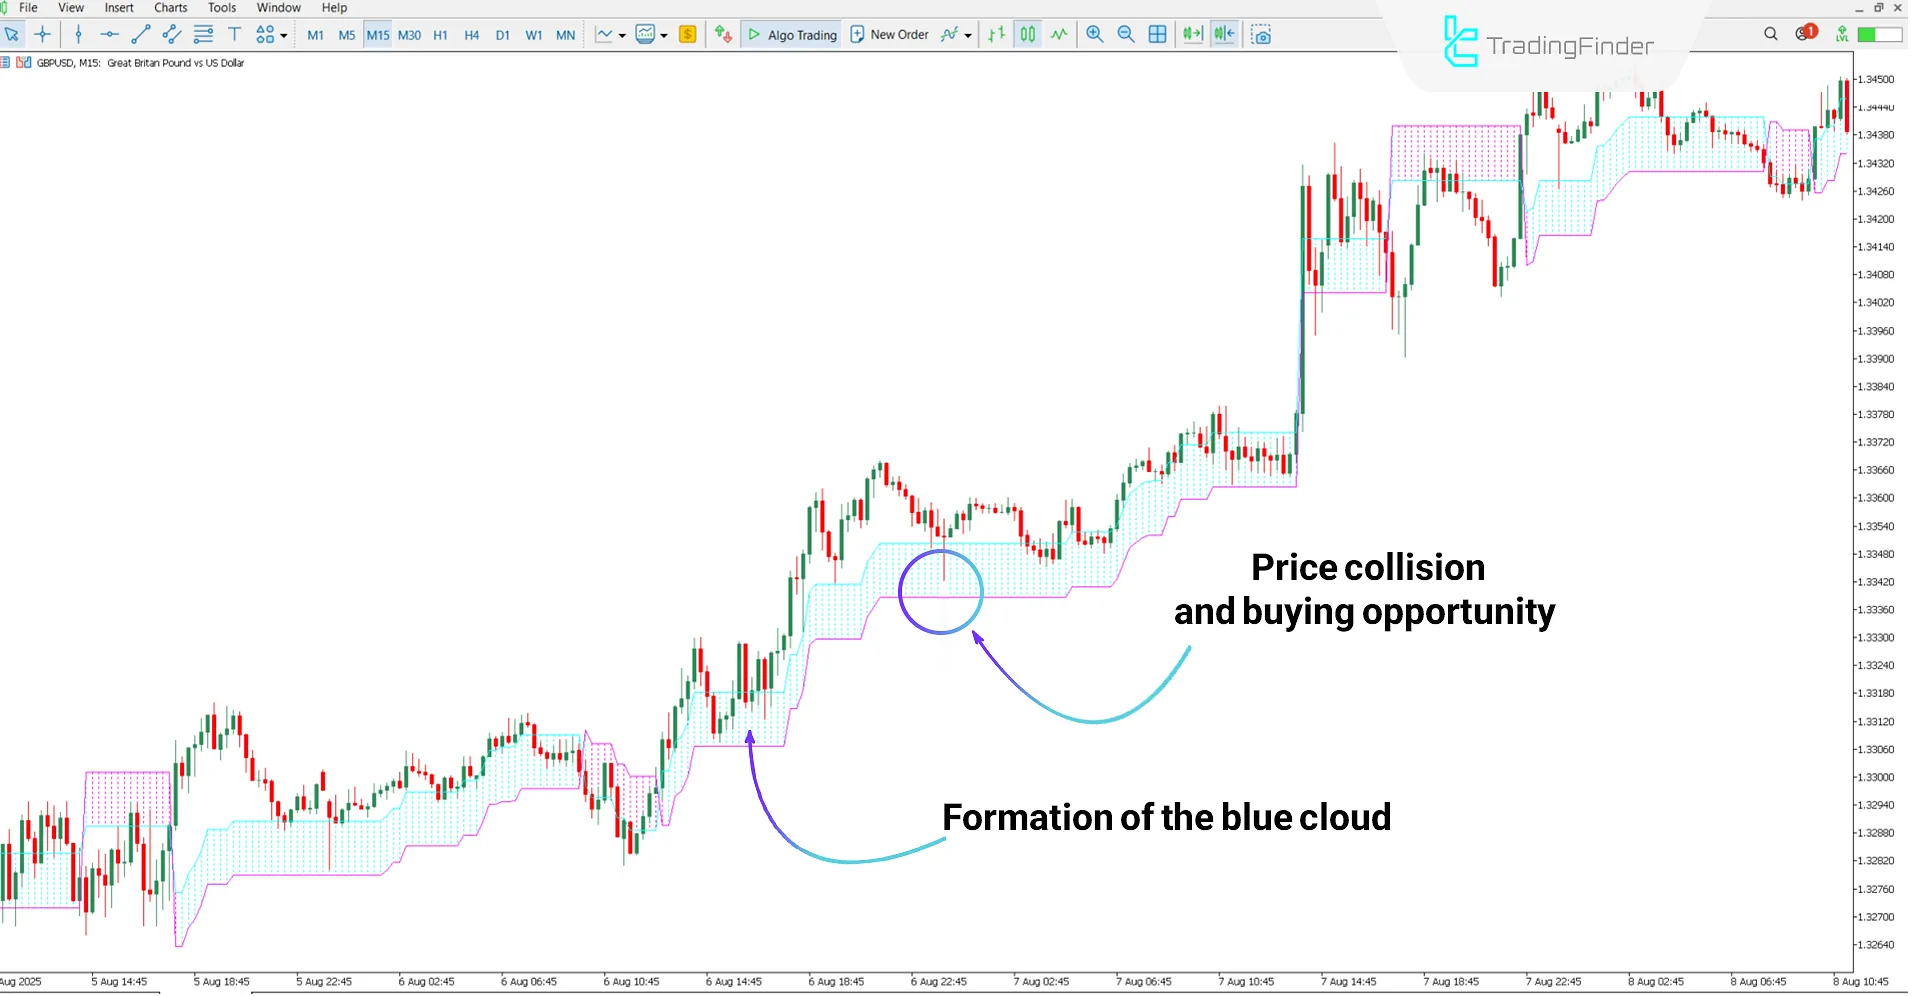
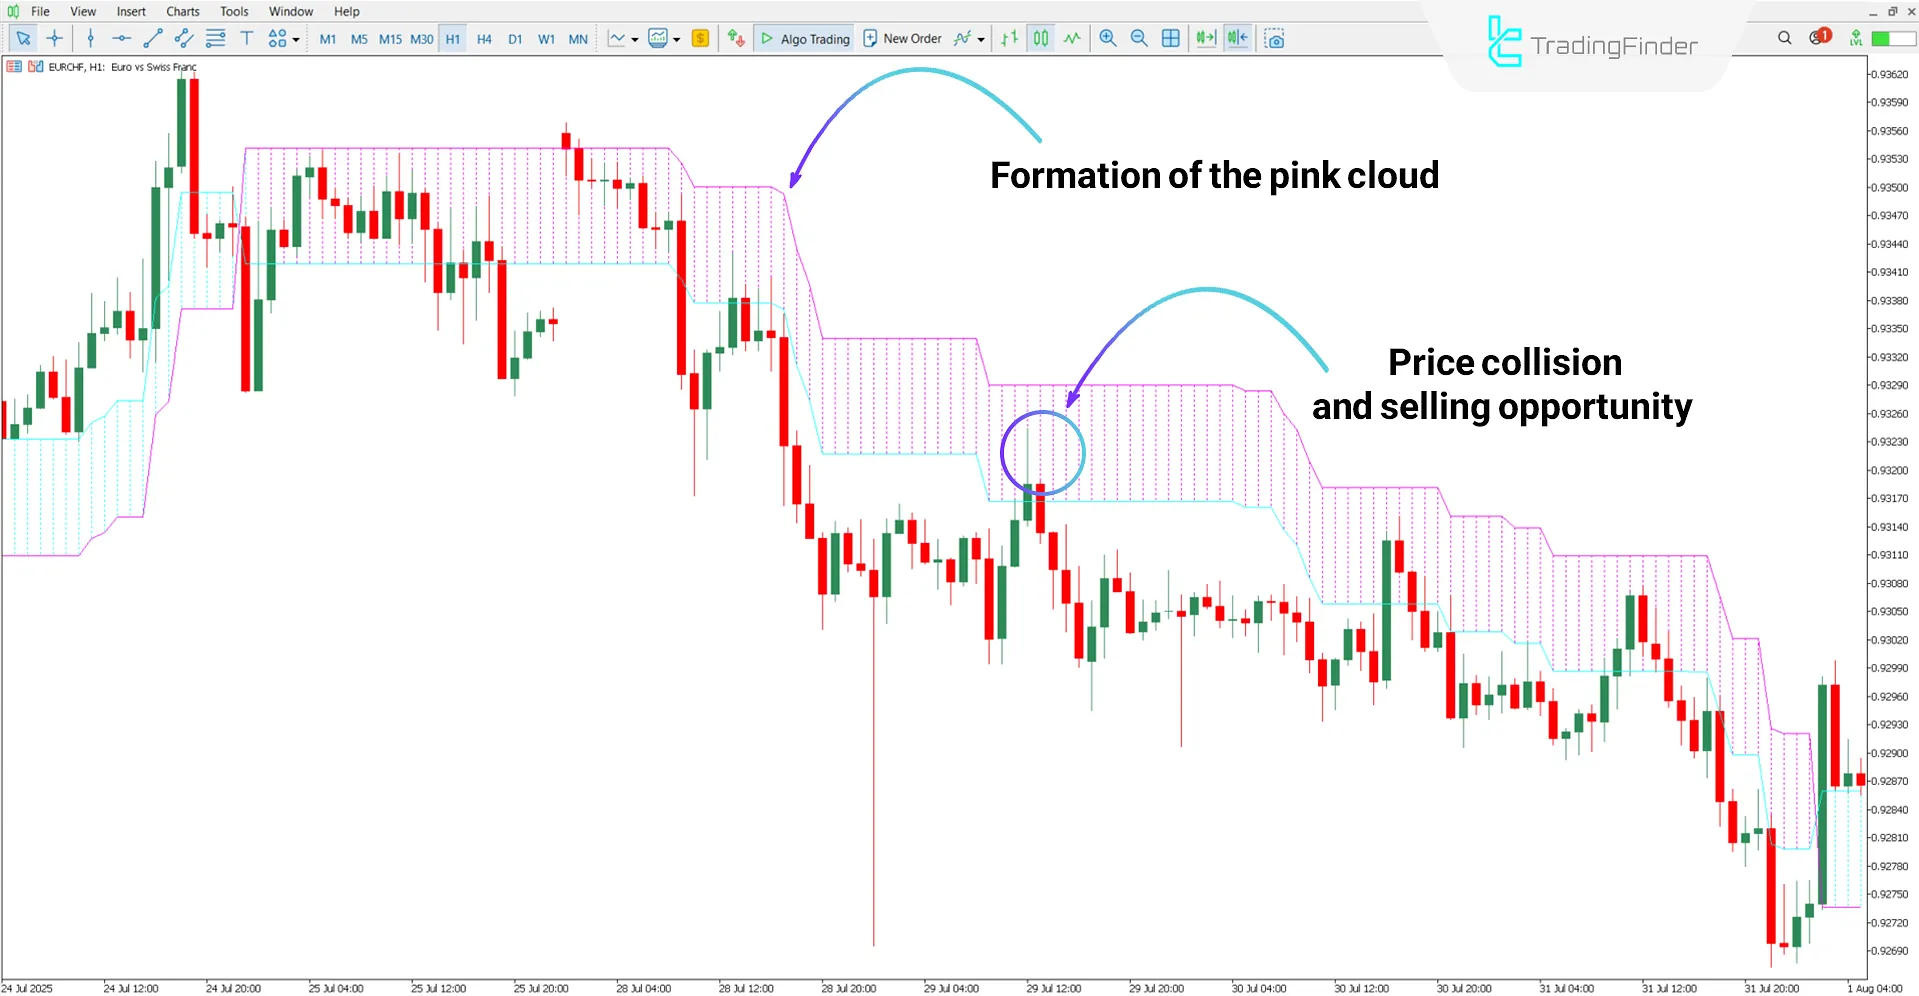
In the Omega Trend Indicator, the formation of a blue cloud means an uptrend, while the appearance of a pink cloud indicates the beginning or continuation of a downtrend.
Traders can consider the price touching or reacting to the boundaries of this dynamic channel as suitable opportunities to enter trades.
Bullish Conditions
According to the GBP/USD pair on the 15-minute timeframe, the formation of a blue cloud indicates dominance of the bullish trend in the market.
In such a condition, the price approaching or entering the cloud areas can be considered as a proper opportunity for buy trades.

Bearish Conditions
Based on the EUR/CHF chart on the 1-hour timeframe, the consecutive creation of pink clouds by the indicator indicates the dominance of the bearish trend in the market.
According to the chart, the price touching the pink cloud area is considered a suitable opportunity for sell trades.

Omega Trend Indicator Settings
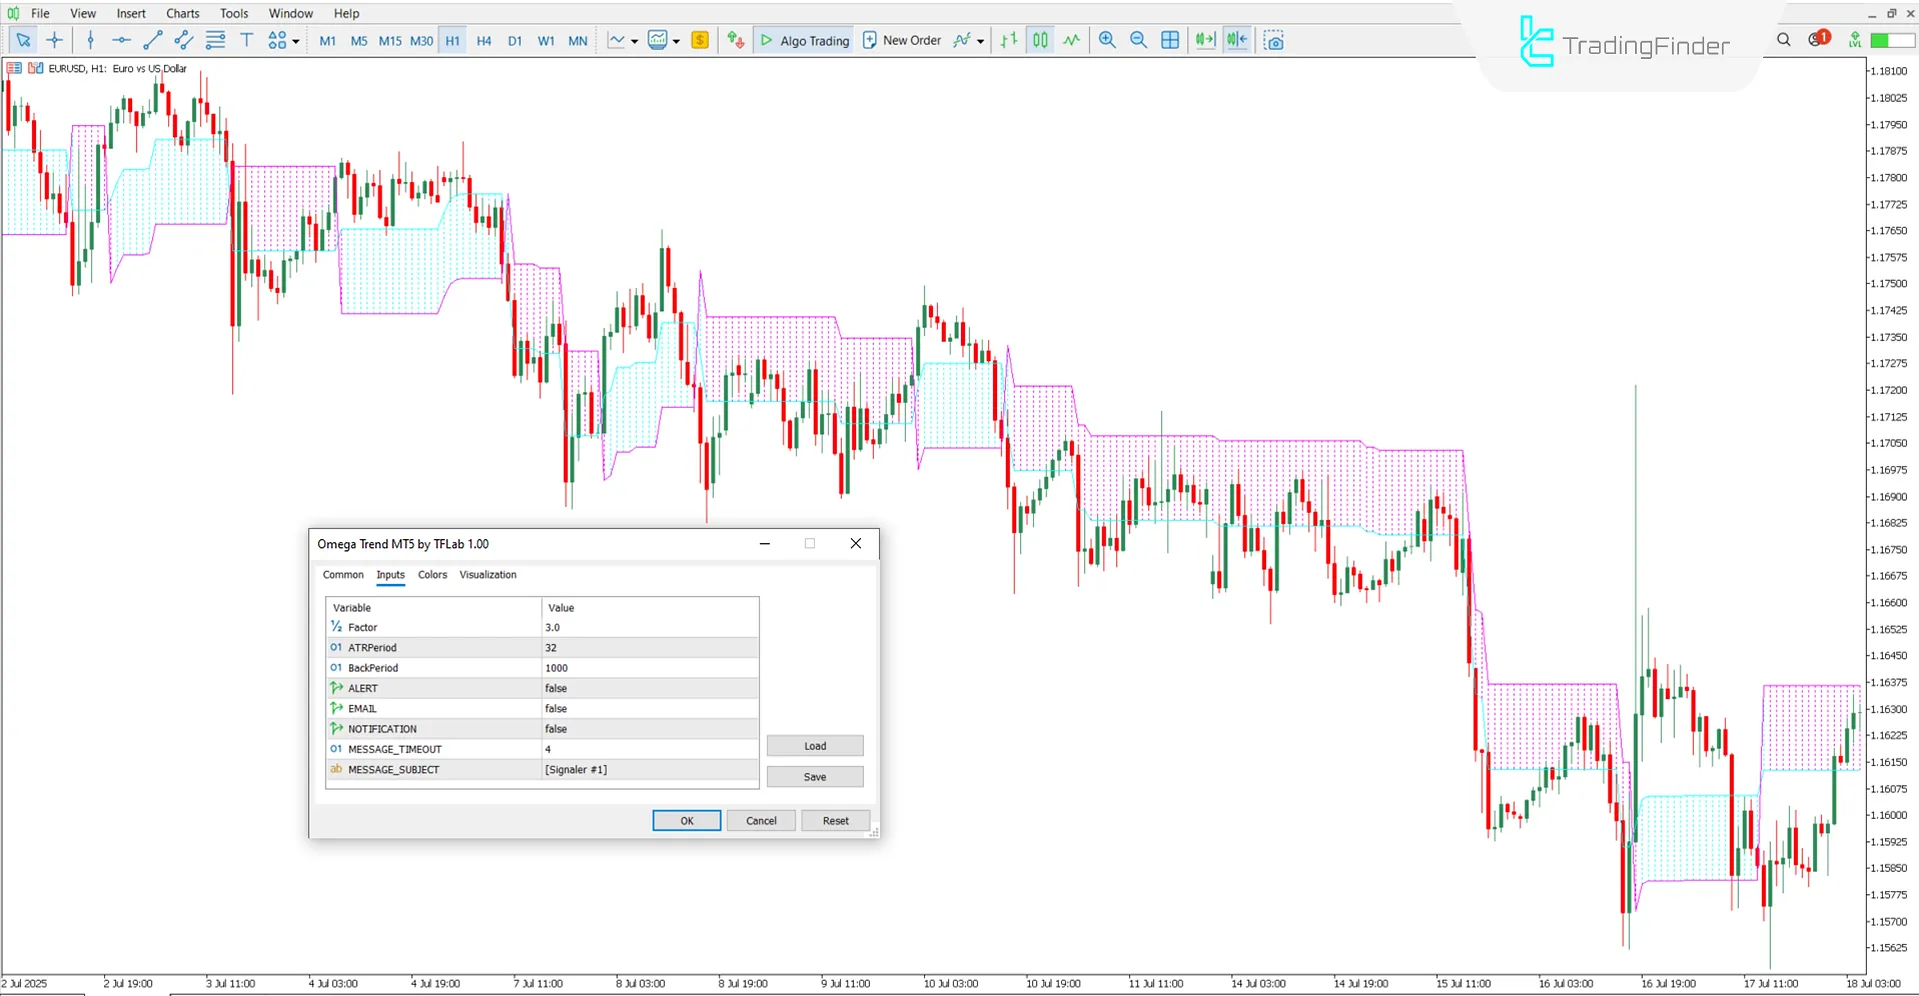
The settings of the Omega Trend Indicator are as follows:

- Factor: coefficient number for indicator sensitivity to price changes
- ATR period: number of candles for Average True Range calculation
- BackPeriod: number of past candles for trend analysis
- ALERT: alert activation
- EMAIL: alert via email
- NOTIFICATION: notification sending
- MESSAGE_TIMEOUT: time interval between two messages
- MESSAGE_SUBJECT: alert subject
Conclusion
The Omega Trend Indicator, by drawing blue and pink lines, clearly displays the bullish and bearish market directions.
This tool, using Average True Range (ATR) calculations and customizable settings, creates dynamic support and resistance levels on the chart.
Omega Trend Indicator for MT5 PDF
Omega Trend Indicator for MT5 PDF
Click to download Omega Trend Indicator for MT5 PDFCan this indicator also be used in the cryptocurrency market?
Yes, the Omega Trend Indicator can be applied in all markets.
What does the formation of a blue cloud mean?
The formation of a blue cloud indicates a bullish trend.


