


The Opening Gap + Void Indicator in MetaTrader 5 indicators is an efficient tool for identifying price gaps that occur when a new candlestick opens.
This indicator automatically displays price gap areas on the chart. If the price fills these gaps, the indicator removes those sections from the chart and highlights the remaining space.
By using this indicator, price gaps are identified and considered as support and resistance zones, which can influence price behavior.
Indicator Specifications Table
The table below displays the specifications of the Opening Gap + Void Indicator:
Indicator Categories: | Smart Money MT5 Indicators Liquidity Indicators MT5 Indicators ICT MT5 Indicators |
Platforms: | MetaTrader 5 Indicators |
Trading Skills: | Intermediate |
Indicator Types: | Reversal MT5 Indicators |
Timeframe: | Multi-Timeframe MT5 Indicators |
Trading Style: | Intraday MT5 Indicators |
Trading Instruments: | Forex MT5 Indicators Crypto MT5 Indicators Stock MT5 Indicators Commodity MT5 Indicators Forward MT5 Indicators Share Stock MT5 Indicators |
Overview of the Indicator
When a gap forms between two candles, it signals unexpected changes in the market. This indicator displays price gaps caused by factors such as major news, significant volatility, or shifts in trader sentiment. Gaps provide traders with valuable information about the current market status.
The gap initially appears green, and its color changes to red once broken.
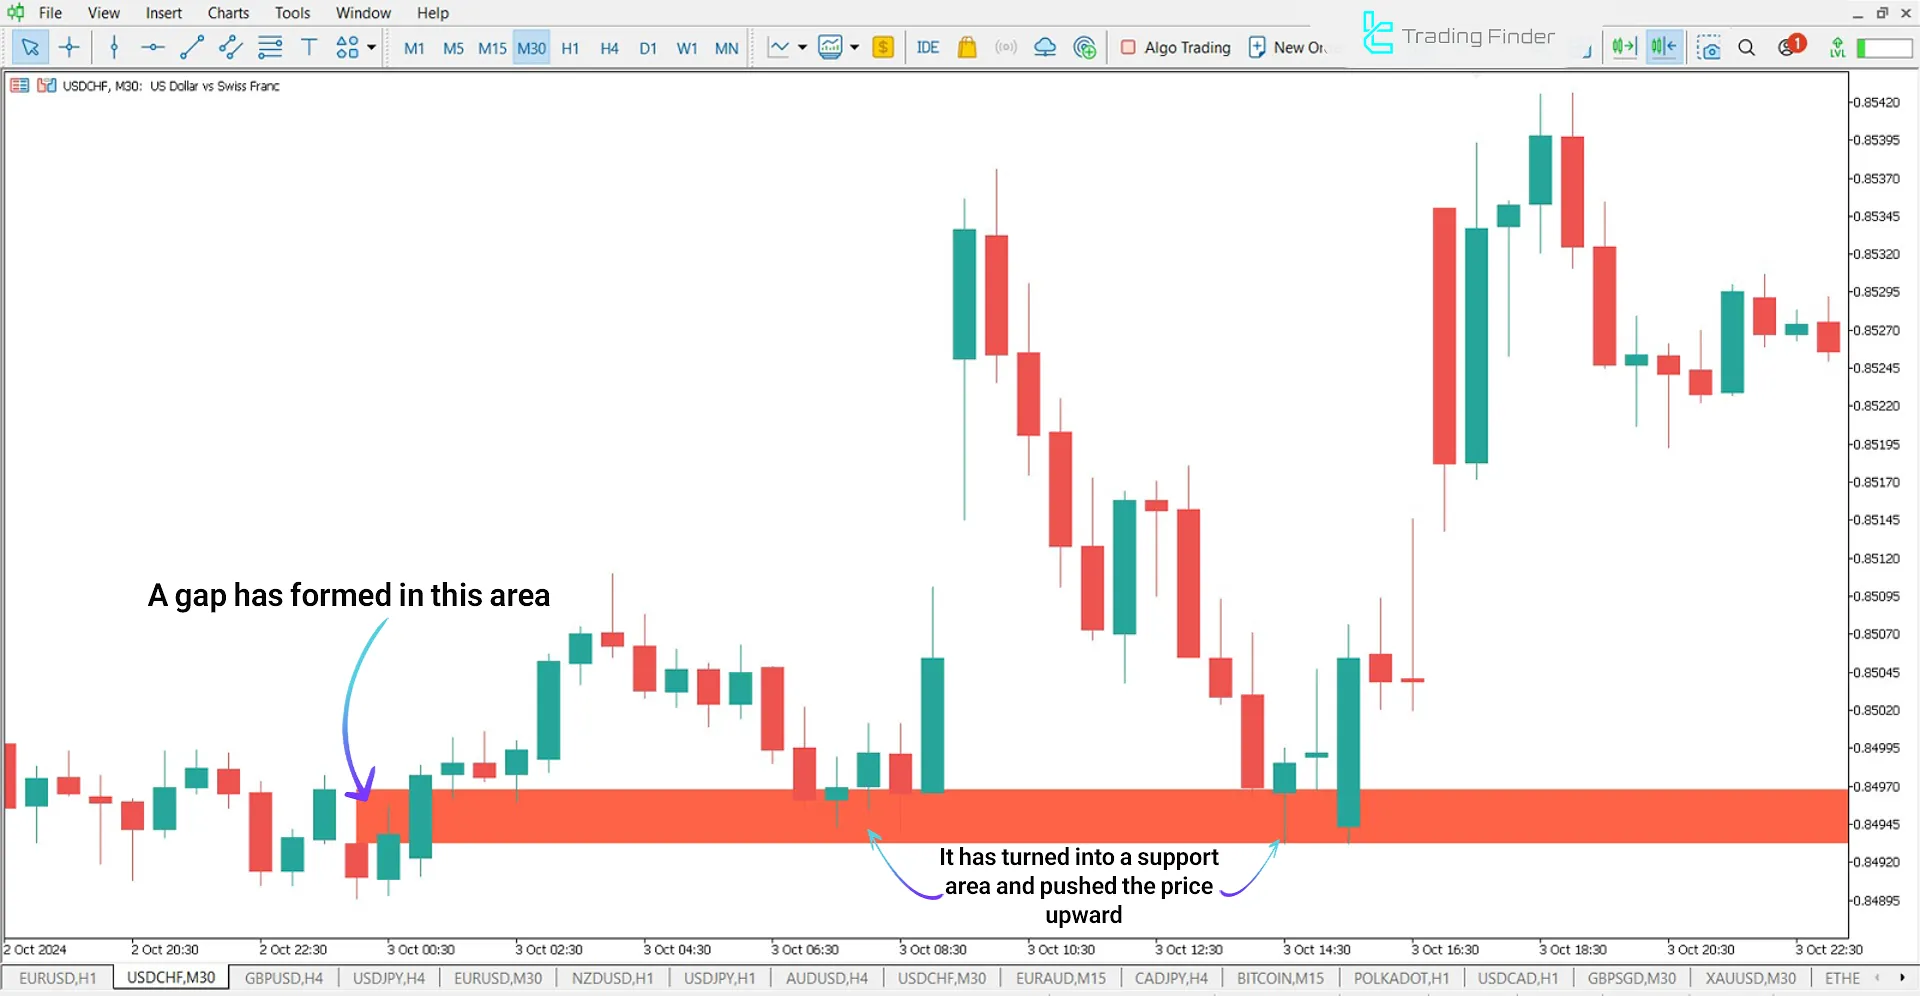
Opening Gap + Void Indicator in an Uptrend
According to the USD/CHF currency pair chart in the 30-minute timeframe, after the formation of a price gap, this area has acted as a support level. As the price returns to this zone, it prevents further decline and creates a suitable opportunity for entering a long (buy) trade.
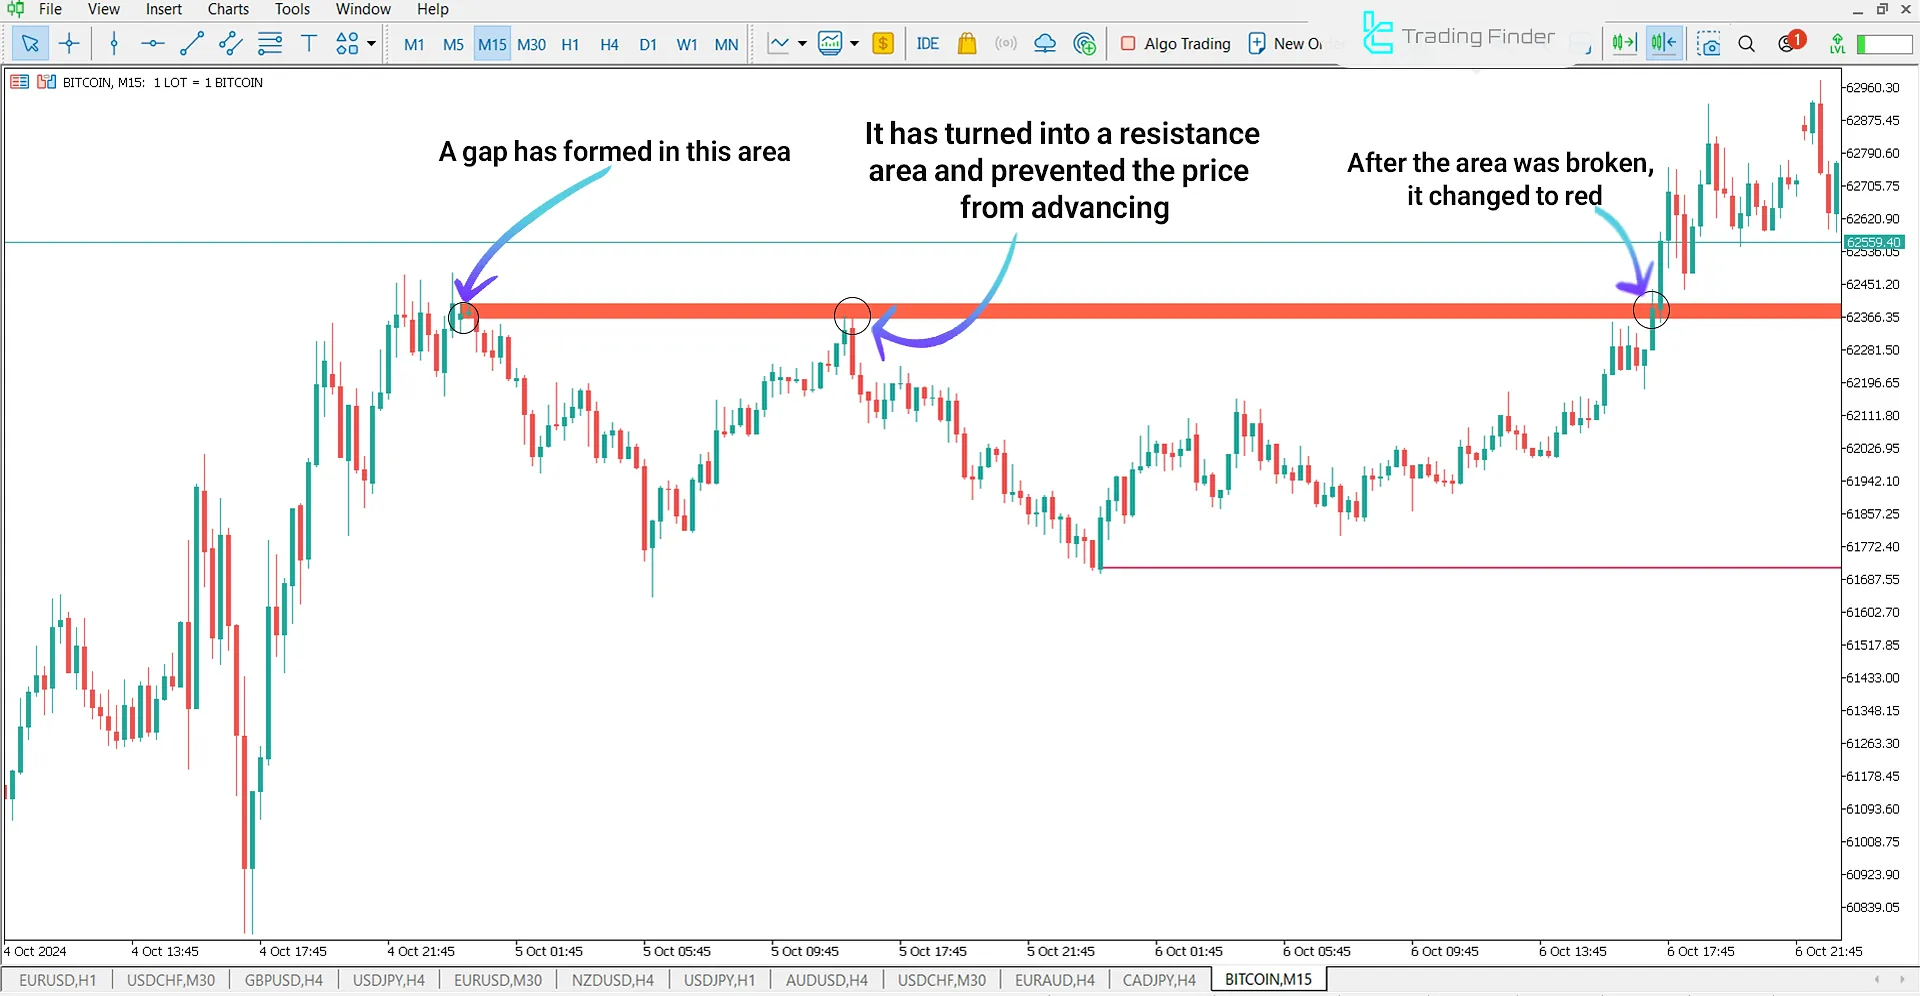
Opening Gap + Void Indicator in a Downtrend
When the price reaches these levels, the area acts as resistance (Resistance) and initiates a decline.
In the 15-minute chart of Bitcoin (BTC), after the formation of a gap, the price retraces to the gap zone in a corrective move, preventing further upward momentum.
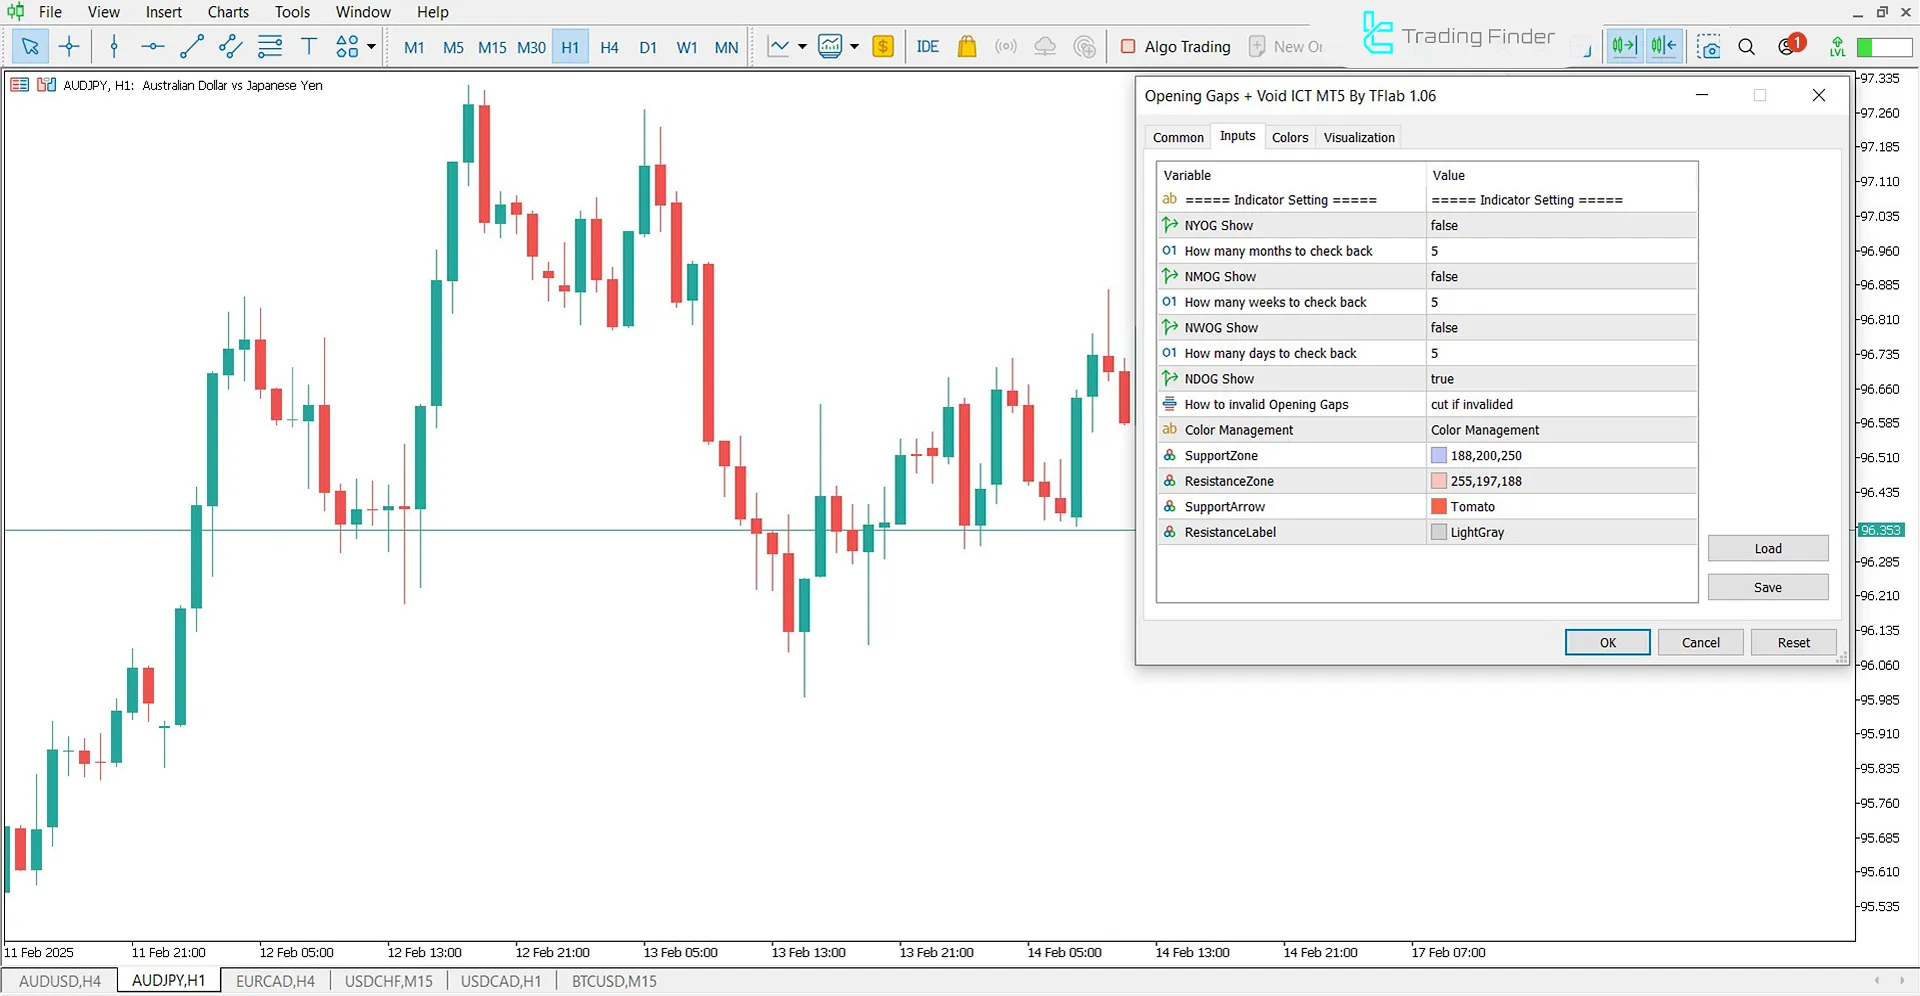
Indicator Settings
The details of the Gap + Void Indicator are displayed in the image below:
- NYOG_Show: Annual gap indicator
- NYOG_LookBack: Default period for displaying annual gap
- NMOG_Show: Monthly gap indicator
- NMOG_LookBack: Default period for displaying monthly gap
- NWOG_Show: Weekly gap indicator
- NWOG_LookBack: Default period for displaying weekly gap
- NDOG_Show: Daily gap indicator
- NDOG_LookBack: Default period for displaying daily gap
- NDOH_Show: Gap indicator
- Invalidation: Indicates previously broken levels
Conclusion
The Opening Gap + Void Indicator is a practical tool for detecting sudden price changes in financial markets. The gaps identified by this indicator function as support and resistance levels.
Traders utilizing the ICT style and Smart Money concepts can integrate this indicator into their strategies to enhance market analysis and refine trade execution.
Opening Gap Void ICT MT5 PDF
Opening Gap Void ICT MT5 PDF
Click to download Opening Gap Void ICT MT5 PDFWhat is the purpose of the Opening Gap + Void Indicator?
This indicator identifies price gaps and establishes support and resistance levels.
How are gaps displayed on the chart?
Gaps initially appear in green and turn red if broken.


