![OsMA Divergence Indicator for MetaTrader 5 Download – Free – [TFlab]](https://cdn.tradingfinder.com/image/384567/4-83-en-osma-divergence-indicator-mt5-1.webp)
![OsMA Divergence Indicator for MetaTrader 5 Download – Free – [TFlab] 0](https://cdn.tradingfinder.com/image/384567/4-83-en-osma-divergence-indicator-mt5-1.webp)
![OsMA Divergence Indicator for MetaTrader 5 Download – Free – [TFlab] 1](https://cdn.tradingfinder.com/image/384568/4-83-en-osma-divergence-indicator-mt5-2.webp)
![OsMA Divergence Indicator for MetaTrader 5 Download – Free – [TFlab] 2](https://cdn.tradingfinder.com/image/384566/4-83-en-osma-divergence-indicator-mt5-3.webp)
![OsMA Divergence Indicator for MetaTrader 5 Download – Free – [TFlab] 3](https://cdn.tradingfinder.com/image/384570/4-83-en-osma-divergence-indicator-mt5-4.webp)
The OsMA Divergence Indicator is a specialized tool for analyzing divergence structures in financial markets. It focuses on the difference between price movement and the OsMA values to accurately identify both regular and hidden divergences.
By drawing divergence lines on the chart, this indicator highlights potential price reversal zones, helping traders more precisely determine entry and exit points.
OsMA Divergence Indicator Specification Table
The table below summarizes the key features of the OsMA Divergence Oscillator.
Indicator Categories: | Oscillators MT5 Indicators Signal & Forecast MT5 Indicators Trading Assist MT5 Indicators |
Platforms: | MetaTrader 5 Indicators |
Trading Skills: | Intermediate |
Indicator Types: | Leading MT5 Indicators Reversal MT5 Indicators |
Timeframe: | Multi-Timeframe MT5 Indicators |
Trading Style: | Intraday MT5 Indicators |
Trading Instruments: | Forex MT5 Indicators Crypto MT5 Indicators Stock MT5 Indicators Forward MT5 Indicators |
Indicator at a Glance
The OsMA Divergence Oscillator intelligently analyzes price action versus OsMA fluctuations to detect both regular and hidden divergences, whether positive or negative.
By drawing colored divergence lines precisely at critical chart points, the indicator enables early detection of potential trend reversals.
Indicator in an Uptrend
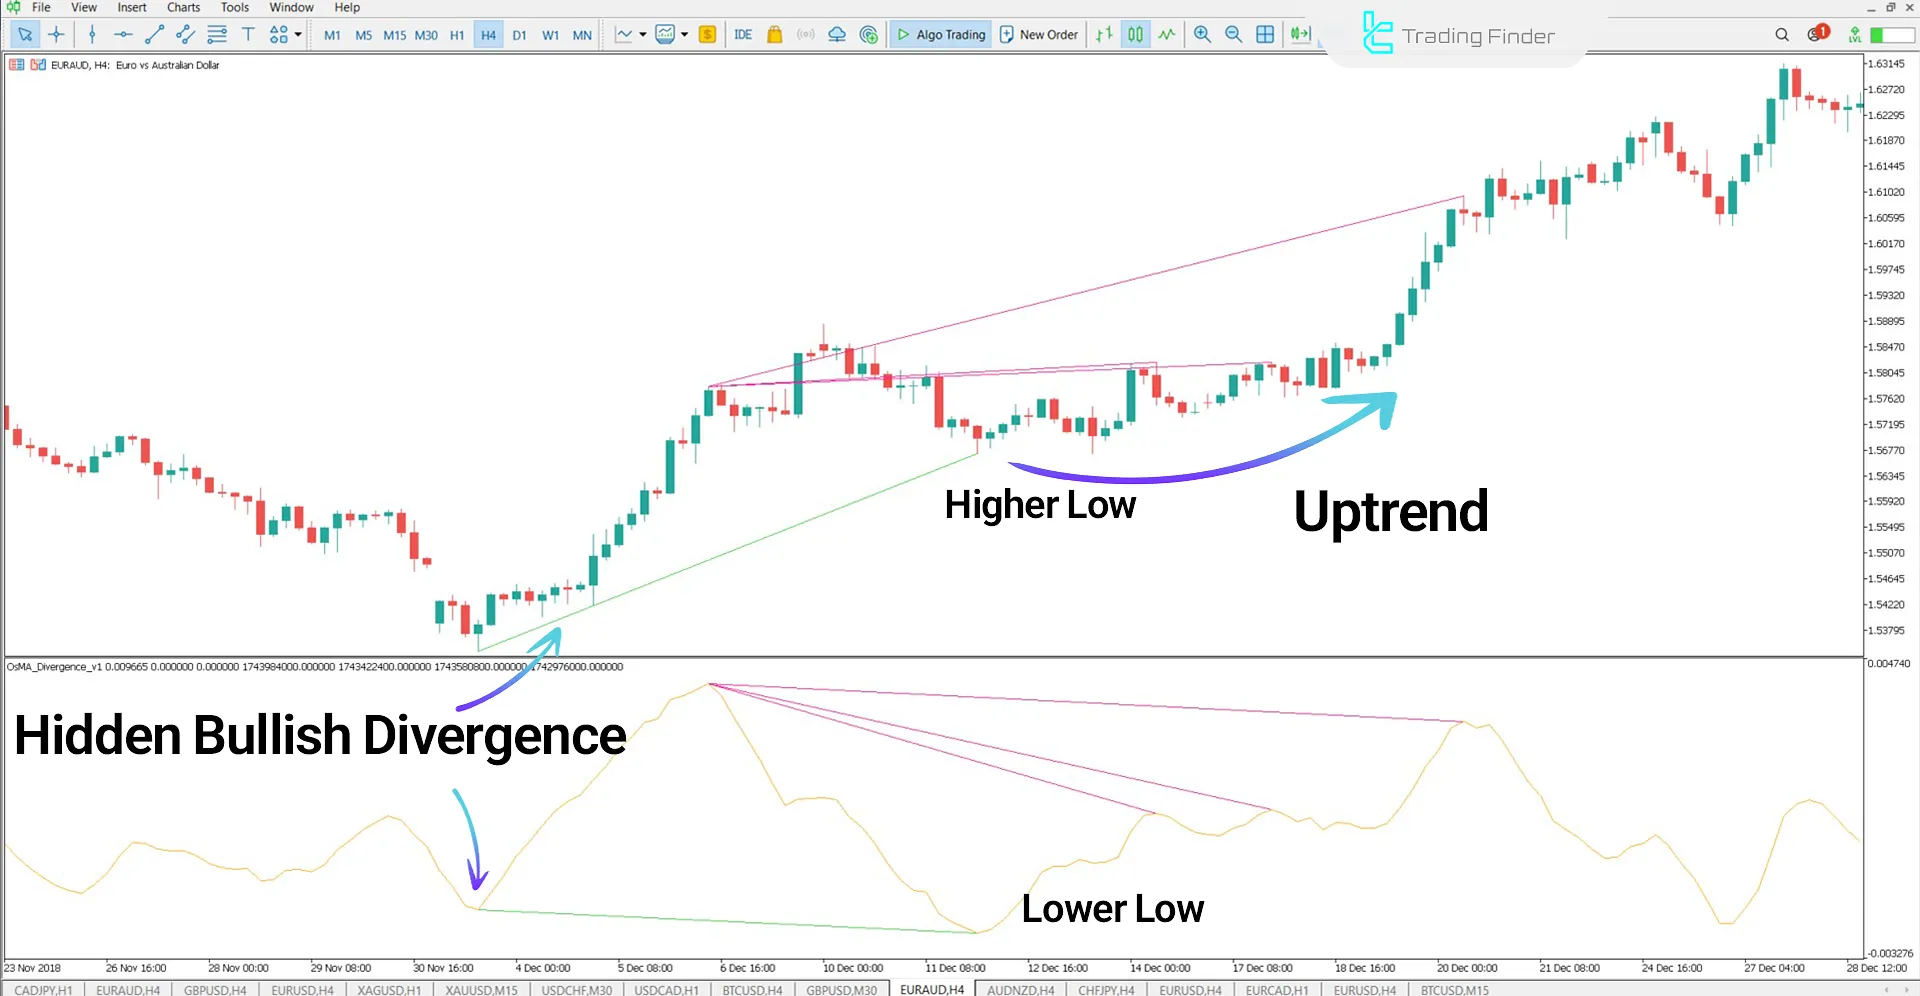
In the 4-hour chart of the EUR/AUD currency pair, the indicator identifies a hidden bullish divergence within an existing uptrend, suggesting the continuation of the upward move.
Following this signal, the price moves upward from the divergence zone, confirming the ongoing bullish trend. This type of divergence often appears during short-term corrections and reflects trend reinforcement.

Indicator in a Downtrend
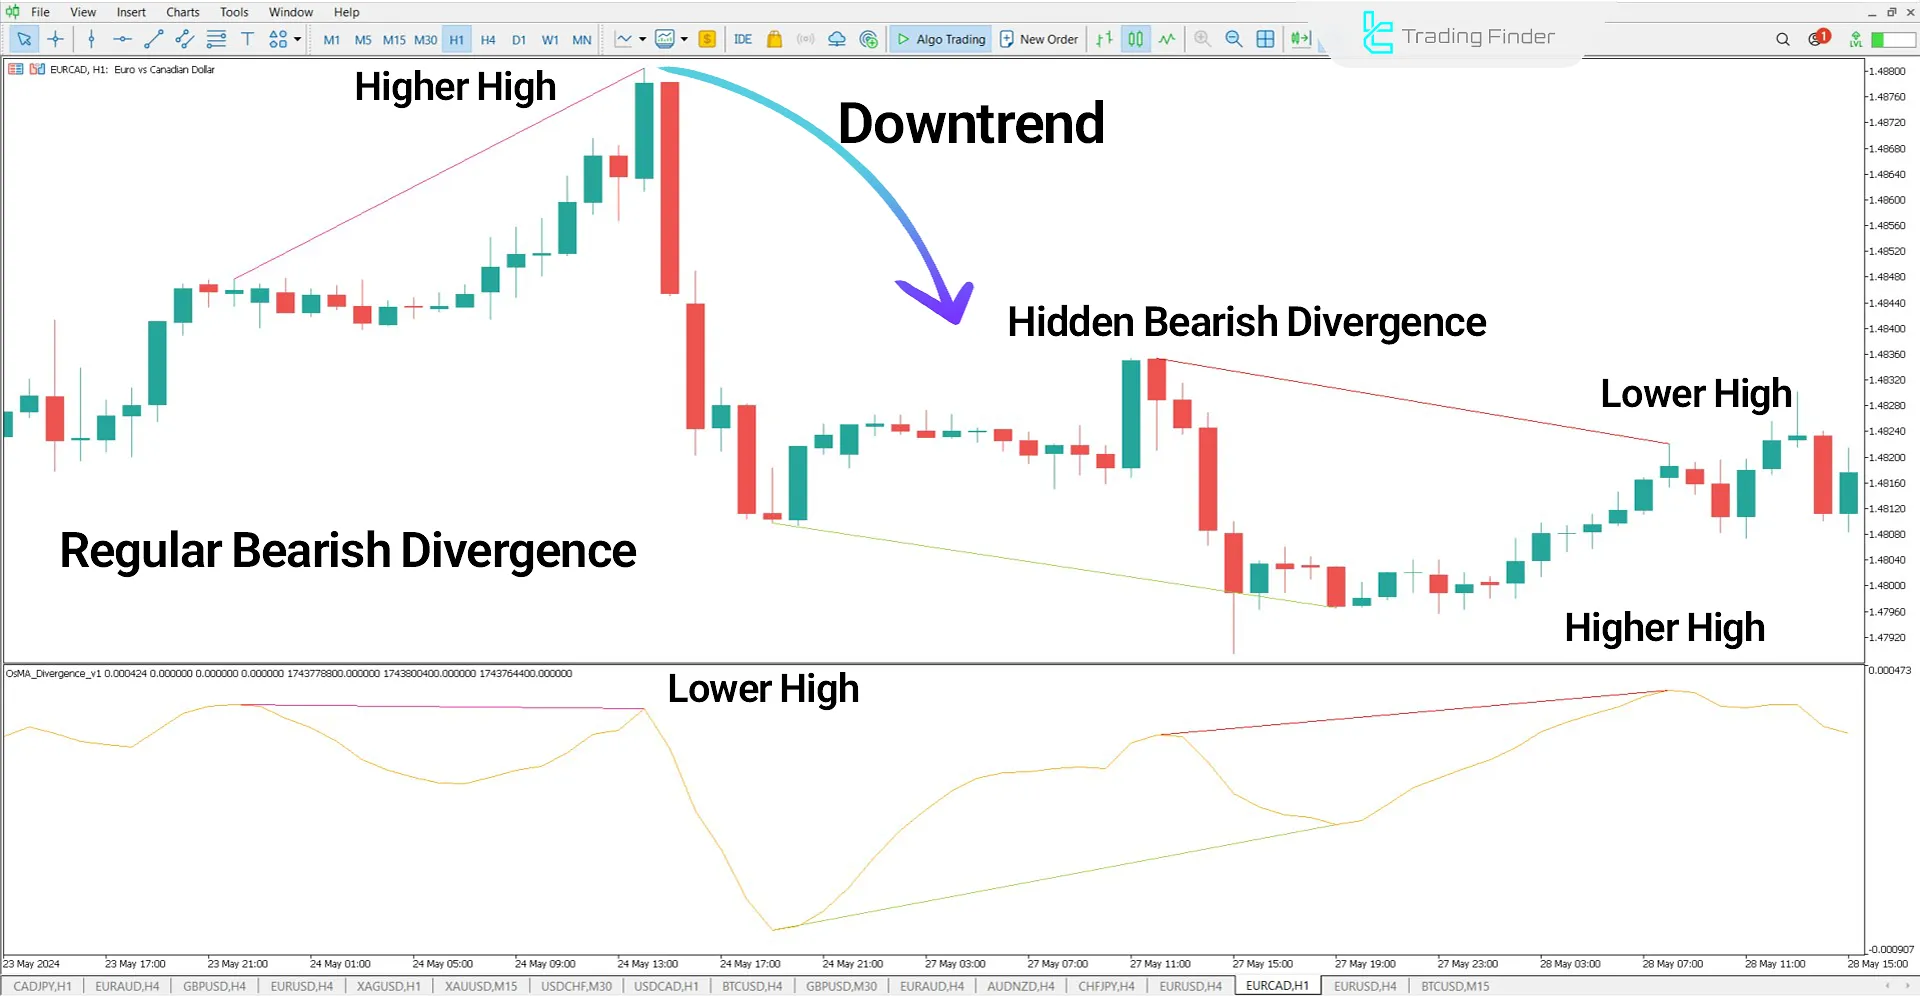
In the 1-hour chart of the EUR/CAD currency pair, the indicator simultaneously detects a regular bearish divergence and a hidden bearish divergence in a key area of the chart.
This convergence of signals presents strong evidence for the start of a downtrend, highlighting the loss of momentum in the prior bullish move.

OsMA Divergence Indicator Settings
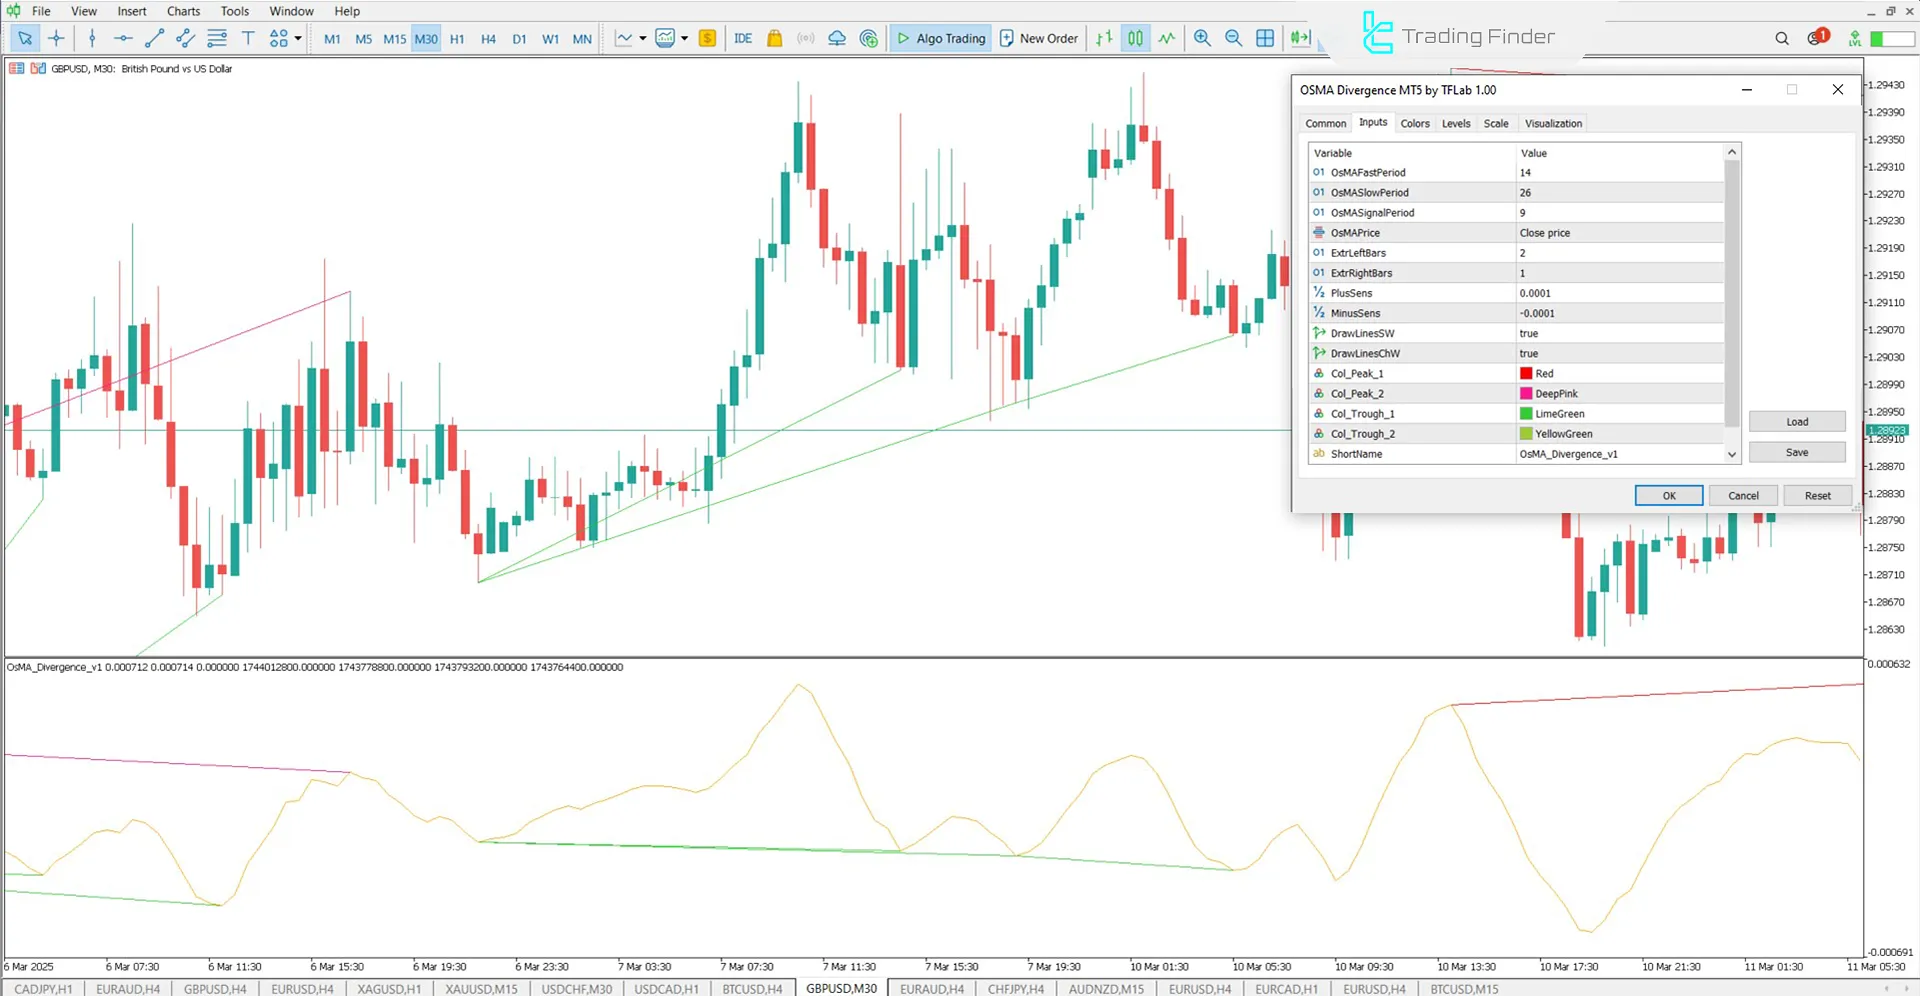
The image below displays the internal settings of the OsMA Divergence Indicator:

- OsMAFastPeriod: Period for the fast moving average
- OsMASlowPeriod: Period for the slow moving average
- OsMASignalPeriod: Period for the signal line
- OsMAPrice: Price calculation method for OsMA
- ExtrLeftBars: Number of bars to extend to the left of the chart
- ExtrRightBars: Number of bars to extend to the right of the chart
- PlusSens: Positive sensitivity for trend direction
- MinusSens: Negative sensitivity for opposite direction
- DrawLinesSW: Enable drawing of trend lines on chart
- DrawLinesCHW: Enable drawing of horizontal lines on chart
- Col_Peak_1: Color of first peak (highest point)
- Col_Peak_2: Color of second peak (second-highest point)
- Col_Trough_1: Color of first trough (lowest point)
- Col_Trough_2: Color of second trough (second-lowest point)
- ShortName: Short label for the indicator
Conclusion
The OsMA Divergence Oscillator is a practical tool in technical analysis that combines oscillatory logic with price action behavior to detect hidden and regular divergences with high accuracy.
By leveraging the difference between the MACD line and the signal line (which is the core of OsMA), this indicator exposes momentum inconsistencies at key market levels.
OsMA Divergence MT5 PDF
OsMA Divergence MT5 PDF
Click to download OsMA Divergence MT5 PDFWhat’s the difference between the OsMA Divergence Indicator and the MACD Indicator?
The OsMA indicator is derived from the difference between the MACD value and its signal line. In other words, it is a derivative of MACD but places greater emphasis on momentum strength.
What is the difference between regular and hidden divergences?
- Regular divergence typically indicates a potential trend reversal;
- Hidden divergence signals the continuation of the current trend;
The OsMA Indicator detects both and displays them using colored lines.


