![Pivot Points All-in-One Indicator for MetaTrader 5 Download - Free - [TradingFinder]](https://cdn.tradingfinder.com/image/143791/11-52-en-pivot-points-all-in-one-mt5-01.webp)
![Pivot Points All-in-One Indicator for MetaTrader 5 Download - Free - [TradingFinder] 0](https://cdn.tradingfinder.com/image/143791/11-52-en-pivot-points-all-in-one-mt5-01.webp)
![Pivot Points All-in-One Indicator for MetaTrader 5 Download - Free - [TradingFinder] 1](https://cdn.tradingfinder.com/image/143790/11-52-en-pivot-points-all-in-one-mt5-02.webp)
![Pivot Points All-in-One Indicator for MetaTrader 5 Download - Free - [TradingFinder] 2](https://cdn.tradingfinder.com/image/143788/11-52-en-pivot-points-all-in-one-mt5-03.webp)
![Pivot Points All-in-One Indicator for MetaTrader 5 Download - Free - [TradingFinder] 3](https://cdn.tradingfinder.com/image/143789/11-52-en-pivot-points-all-in-one-mt5-04.webp)
The Pivot Points All-in-One Indicator is a practical tool for identifying pivot points and key price reaction zones. Developed for the MetaTrader 5 (MT5) platform, it helps traders accurately identify market levels and use them to set take-profit (TP) and stop-loss (SL) levels.
This Support and Resistance calculates pivot points using the previous day's high, low, and close prices. It then plots the pivot level in blue while marking support levels in green and resistance levels in red. This graphical display lets traders easily identify potential price reaction areas and make better trading decisions.
This simple yet effective tool is ideal for traders to identify critical market levels and align their strategies accordingly.
Pivot Points Indicator Table
Indicator Categories: | Pivot Points & Fractals MT5 Indicators Support & Resistance MT5 Indicators Levels MT5 Indicators |
Platforms: | MetaTrader 5 Indicators |
Trading Skills: | Intermediate |
Indicator Types: | Leading MT5 Indicators Entry & Exit MT5 Indicators Reversal MT5 Indicators |
Trading Style: | Intraday MT5 Indicators Scalper MT5 Indicators Day Trading MT5 Indicators |
Trading Instruments: | Forex MT5 Indicators Crypto MT5 Indicators Indices MT5 Indicators |
Bullish Pivot Levels

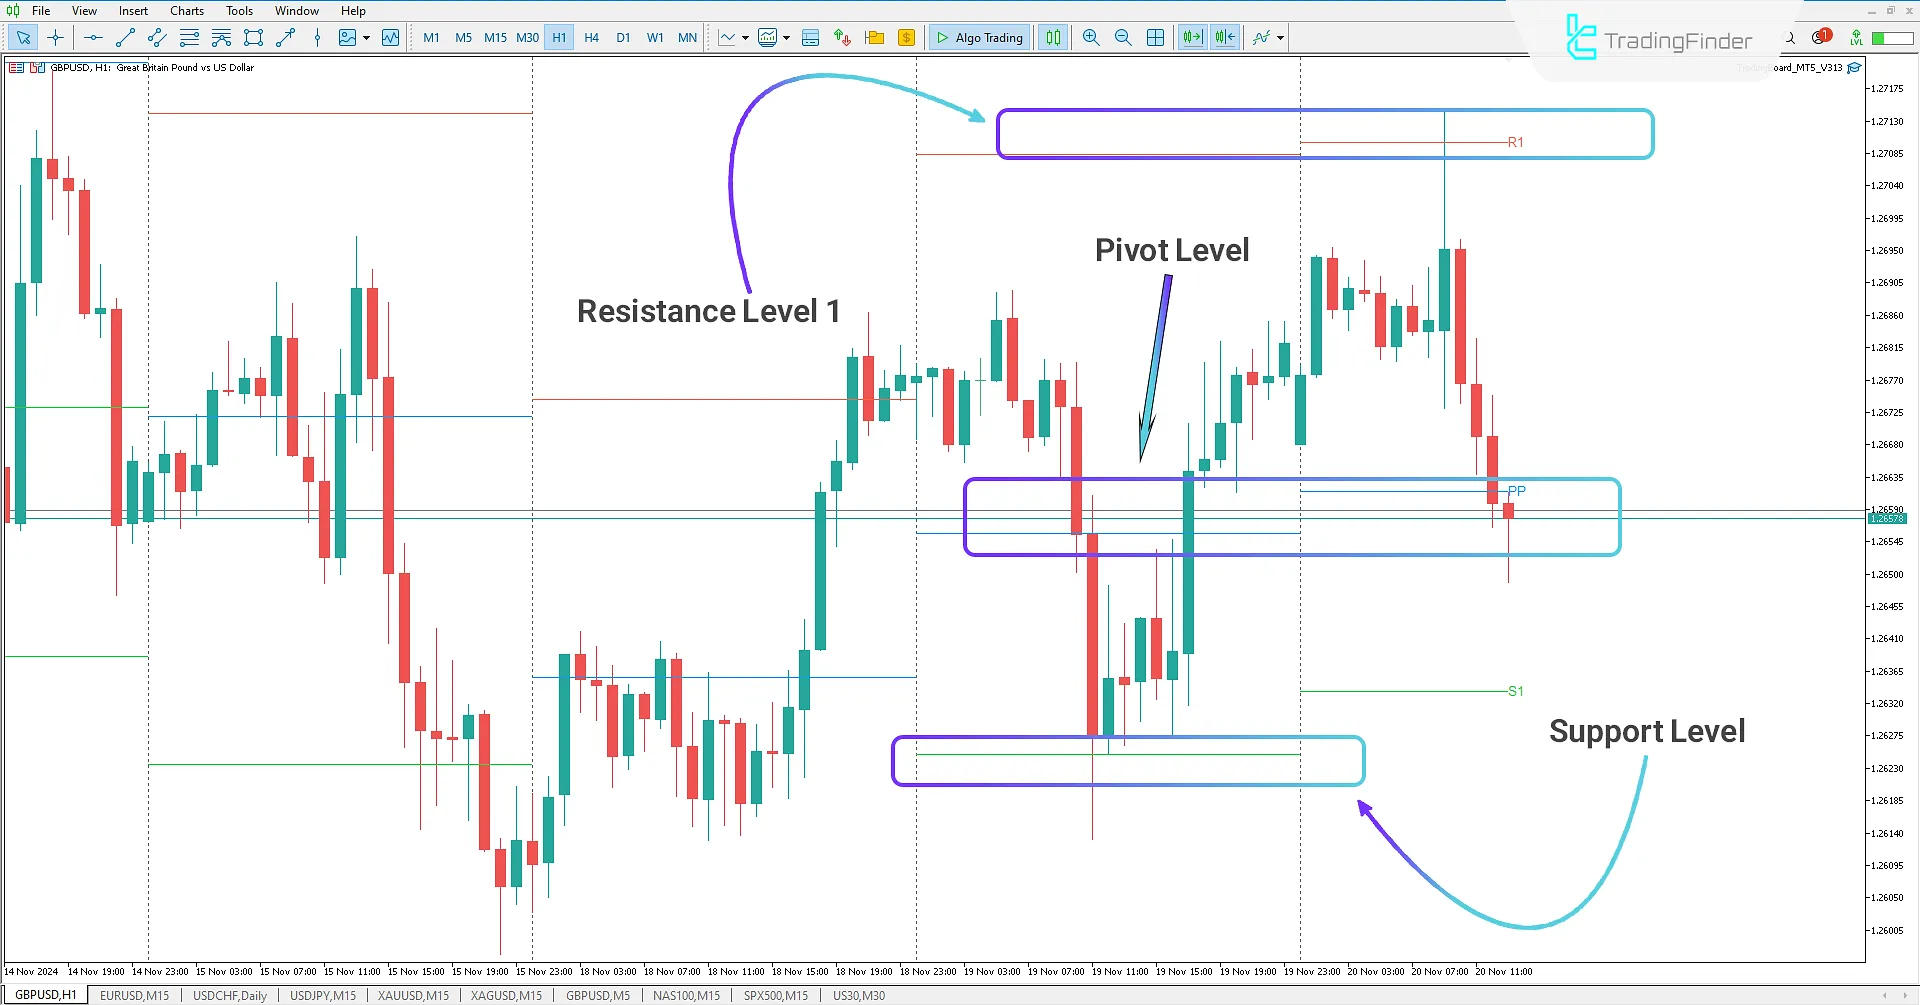
The GBP/USD 1-hour chart, the price increases after bouncing off a significant support level. The Pivot Points All-in-One Indicator identifies and plots these key price levels, helping traders anticipate price reactions.
After breaking above the pivot level, the price retraces downward and reacts to the pivot level again, confirming its strength as support.
Bearish Pivot Levels

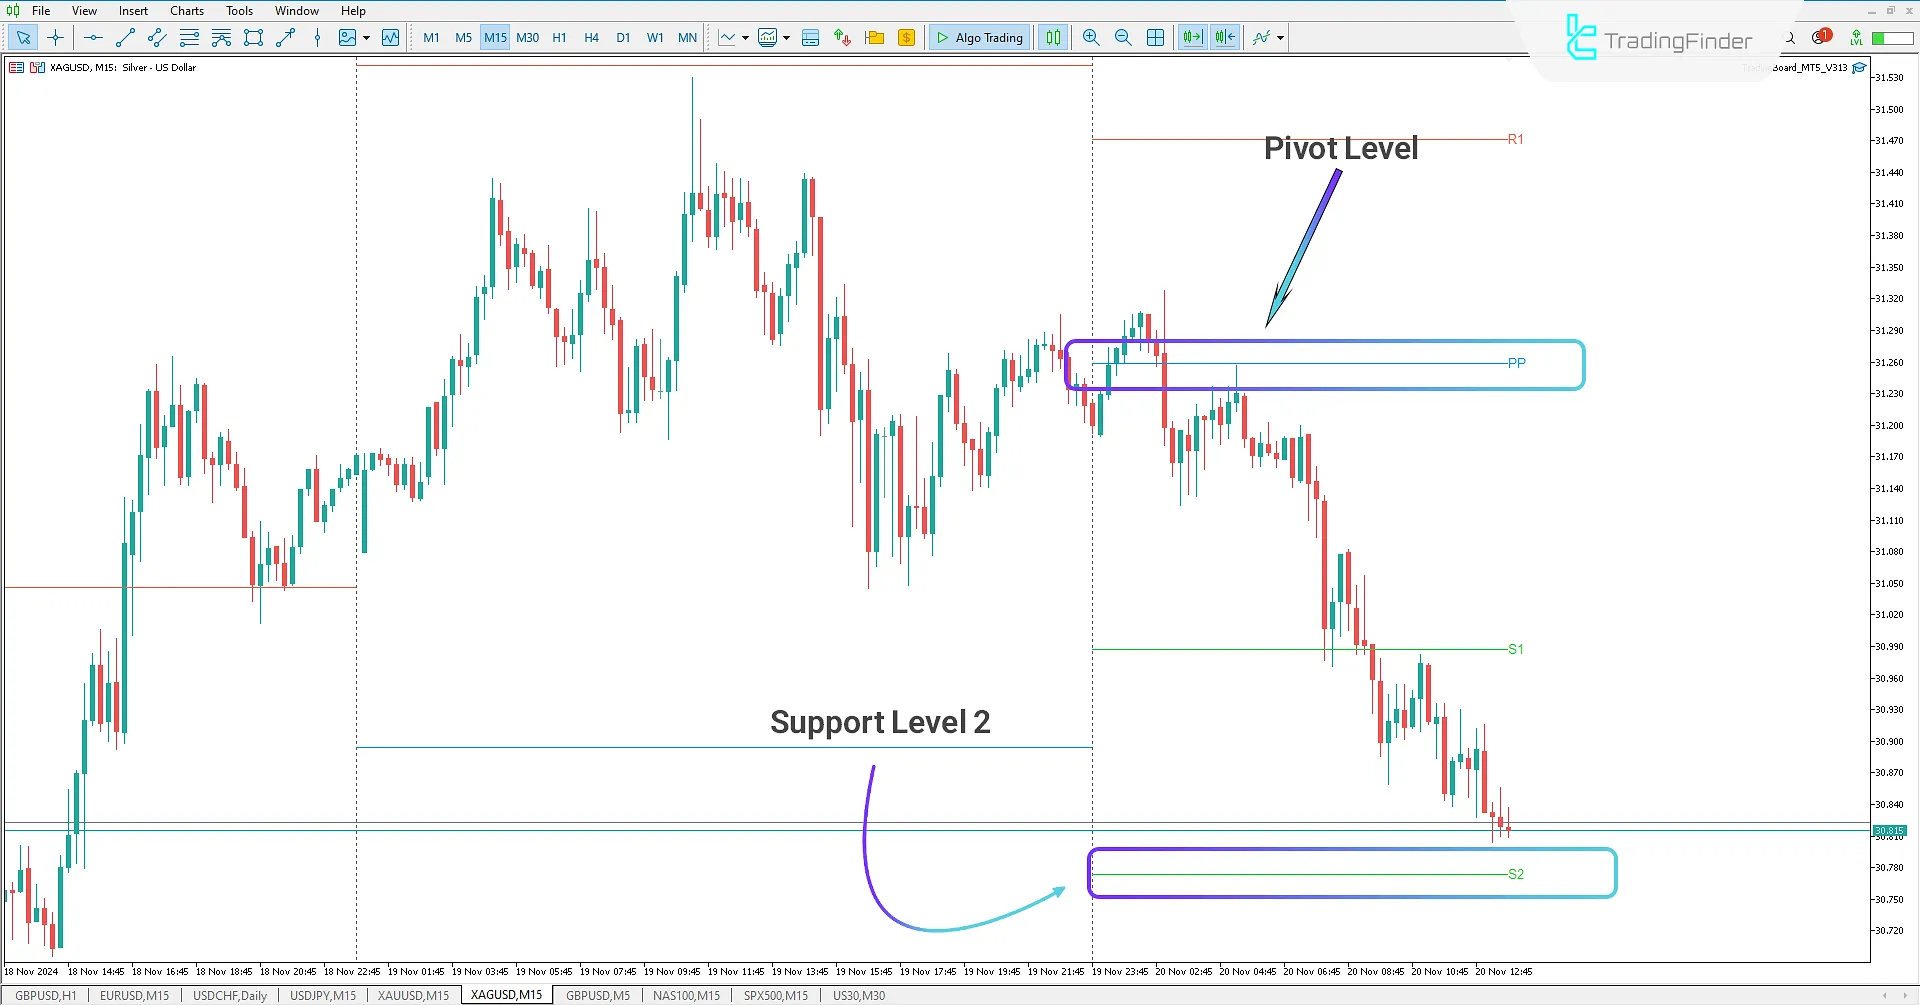
In the XAG/USD 15-minute chart, the Pivot Points All-in-One Indicator plots pivot and other vital levels to indicate potential price reversal zones. Traders can use this tool to identify significant levels and refine their trade analyses quickly.
Using this indicator, traders can set take-profit (TP) and stop-loss (SL) levels based on these critical areas and optimize their trading strategies.
Indicator Settings

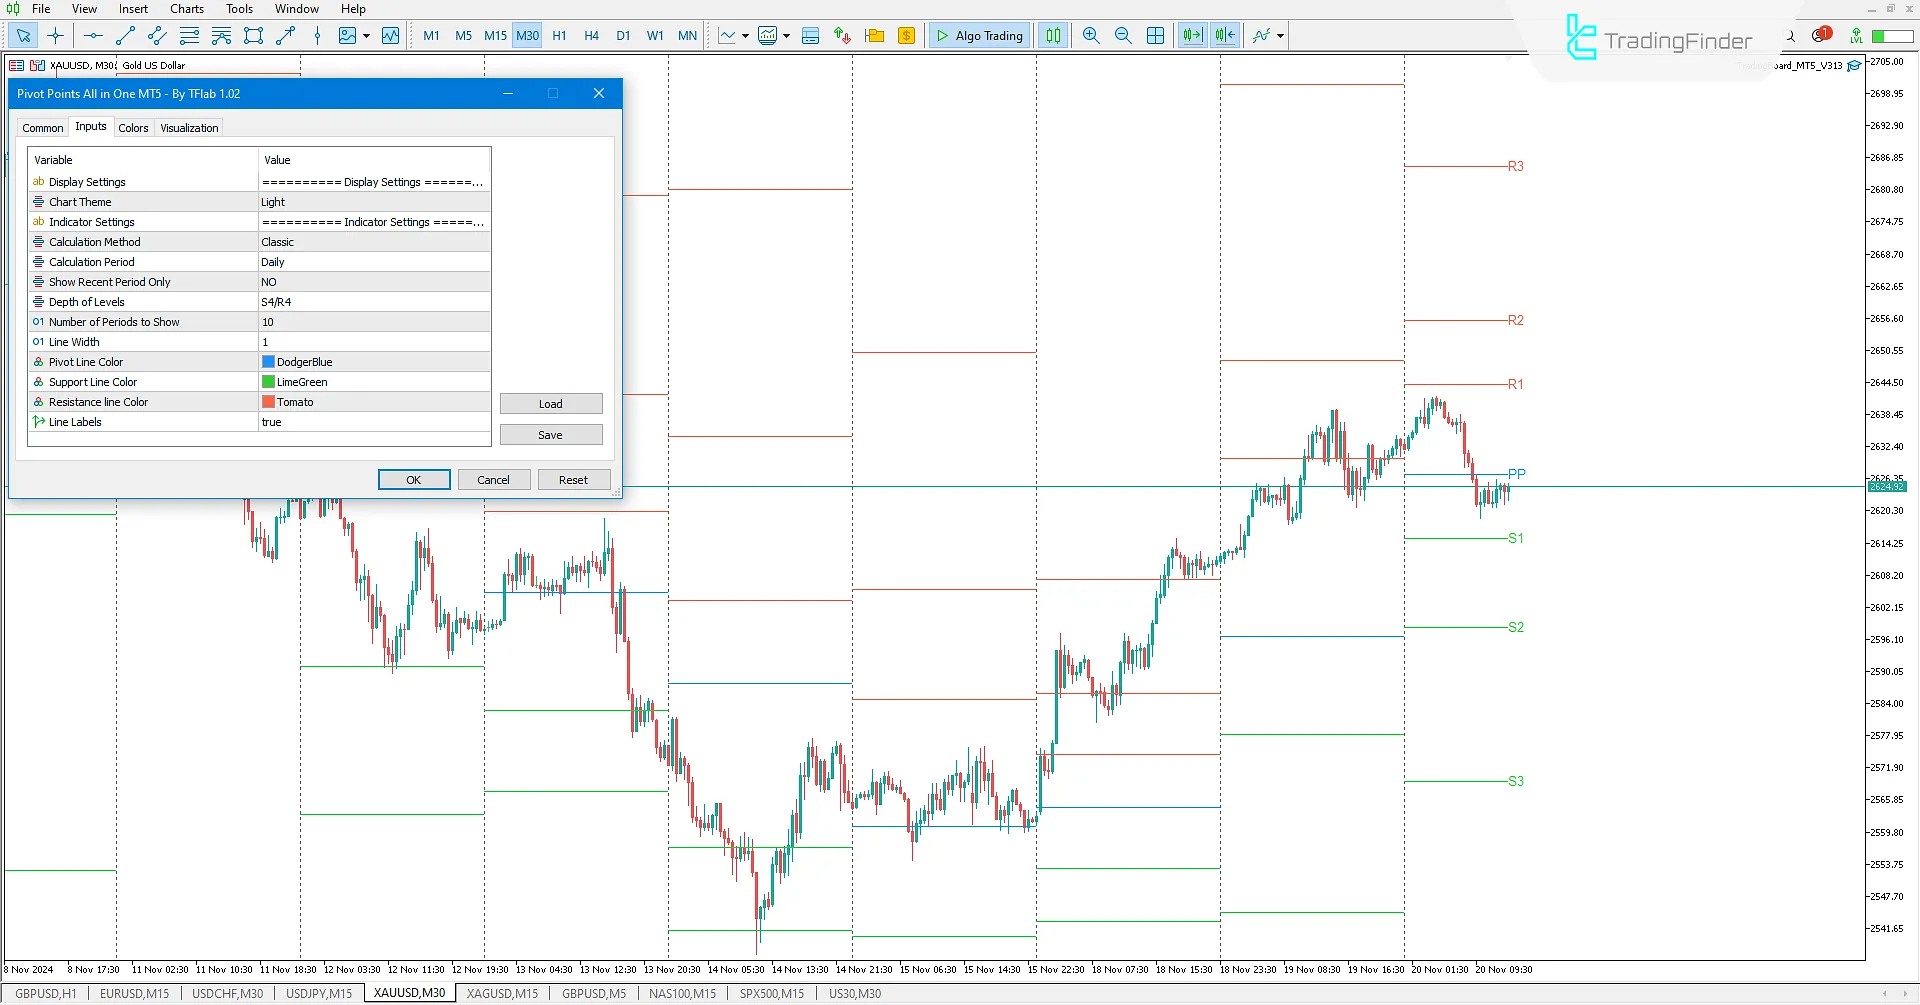
Display Settings: Customize display elements such as graphical line appearances;
- Chart Theme: Choose between light or dark themes;
Indicator Settings: Adjust the indicator's operational parameters;
- Calculation Method: Select the pivot point calculation method (e.g., Standard, Woodie, Fibonacci, etc.);
- Calculation Period: Define the calculation period (daily, weekly, or monthly);
- Show Recent Period Only: Display only recent periods;
- Depth of Levels: Set the depth of pivot levels and the number of support/resistance lines displayed;
- Number of Periods to Show: Configure the number of periods to display;
- Line Width: Adjust the thickness of the pivot, support, and resistance lines;
- Pivot Line Color: Change the pivot line color;
- Support Line Color: Set the color for support lines;
- Resistance Line Color: Set the color for resistance lines;
- Line Labels: Enable or turn off labels on lines.
Conclusion
The Pivot Points All-in-One Indicator is a practical and effective tool for traders to identify key market levels and price reactions. This Metatrader5 indicator calculates levels based on the previous period's data, plotting pivot points, support, and resistance levels for the current day as visible lines. These lines help traders pinpoint potential price reaction areas, accurately predict trade entries and exits, and set strategic take-profit and stop-loss levels for better decision-making.
Pivot Points All-in-One MT5 PDF
Pivot Points All-in-One MT5 PDF
Click to download Pivot Points All-in-One MT5 PDFHow can traders use this indicator?
Traders can use this tool to:
- Identify entry and exit points for trades.
- Analyze price behavior near support and resistance levels.
- Set take-profit (TP) and stop-loss (SL) levels.
Can this indicator be used to analyze price reversals?
Yes, traders can use the identified support and resistance levels to pinpoint potential price reversal points and adjust their strategies accordingly.
hello sir thank you for provide a great indicator but i have a one problem , Pivot Points All-in-One Indicator for MetaTrader 5 is not working why ? can you fixec it. thank you in advance
Hello, thank you for your kind words. The behavior of the Pivot Points All-in-One Indicator can depend on the market conditions, the selected symbol, and the chosen time frame. I recommend reviewing the usage guide and trying different settings to make sure you are applying it correctly.


