![Power Dynamite Areas Indicator MetaTrader 5 - Free Download [TradingFinder]](https://cdn.tradingfinder.com/image/583417/2-166-en-power-dynamite-areas-mt5-1.webp)
![Power Dynamite Areas Indicator MetaTrader 5 - Free Download [TradingFinder] 0](https://cdn.tradingfinder.com/image/583417/2-166-en-power-dynamite-areas-mt5-1.webp)
![Power Dynamite Areas Indicator MetaTrader 5 - Free Download [TradingFinder] 1](https://cdn.tradingfinder.com/image/583413/2-166-en-power-dynamite-areas-mt5-2.webp)
![Power Dynamite Areas Indicator MetaTrader 5 - Free Download [TradingFinder] 2](https://cdn.tradingfinder.com/image/583411/2-166-en-power-dynamite-areas-mt5-3.webp)
![Power Dynamite Areas Indicator MetaTrader 5 - Free Download [TradingFinder] 3](https://cdn.tradingfinder.com/image/583444/2-166-en-power-dynamite-areas-mt5-4.webp)
The Power Dynamite Areas Indicator, using advanced analytical algorithms, examines price history and identifies ranges that have repeatedly acted as price reaction points in the past.
These zones are dynamic supports and resistances that gain importance not only based on price position but also on the number of touches and the strength of reactions.
When the price has reacted multiple times to a specific level, the indicator marks that important level with colored lines on the chart.
Power Dynamite Areas Indicator Table
The general specifications of the Power Dynamite Areas Indicator are presented in the table below:
Indicator Categories: | Support & Resistance MT5 Indicators Trading Assist MT5 Indicators Levels MT5 Indicators |
Platforms: | MetaTrader 5 Indicators |
Trading Skills: | Intermediate |
Indicator Types: | Reversal MT5 Indicators |
Timeframe: | Multi-Timeframe MT5 Indicators |
Trading Style: | Day Trading MT5 Indicators |
Trading Instruments: | Forex MT5 Indicators Crypto MT5 Indicators Stock MT5 Indicators Commodity MT5 Indicators Indices MT5 Indicators Share Stock MT5 Indicators |
Power Dynamite Areas Indicator at a Glance
The Power Dynamite Areas Indicator is designed based on the principle of the “Market Memory Effect”, and identifies previous price reaction zones by displaying two lines, red and green.
These zones are shown on the chart as dynamic supports and resistances, and when these lines are broken, a Market Structure Shift occurs.
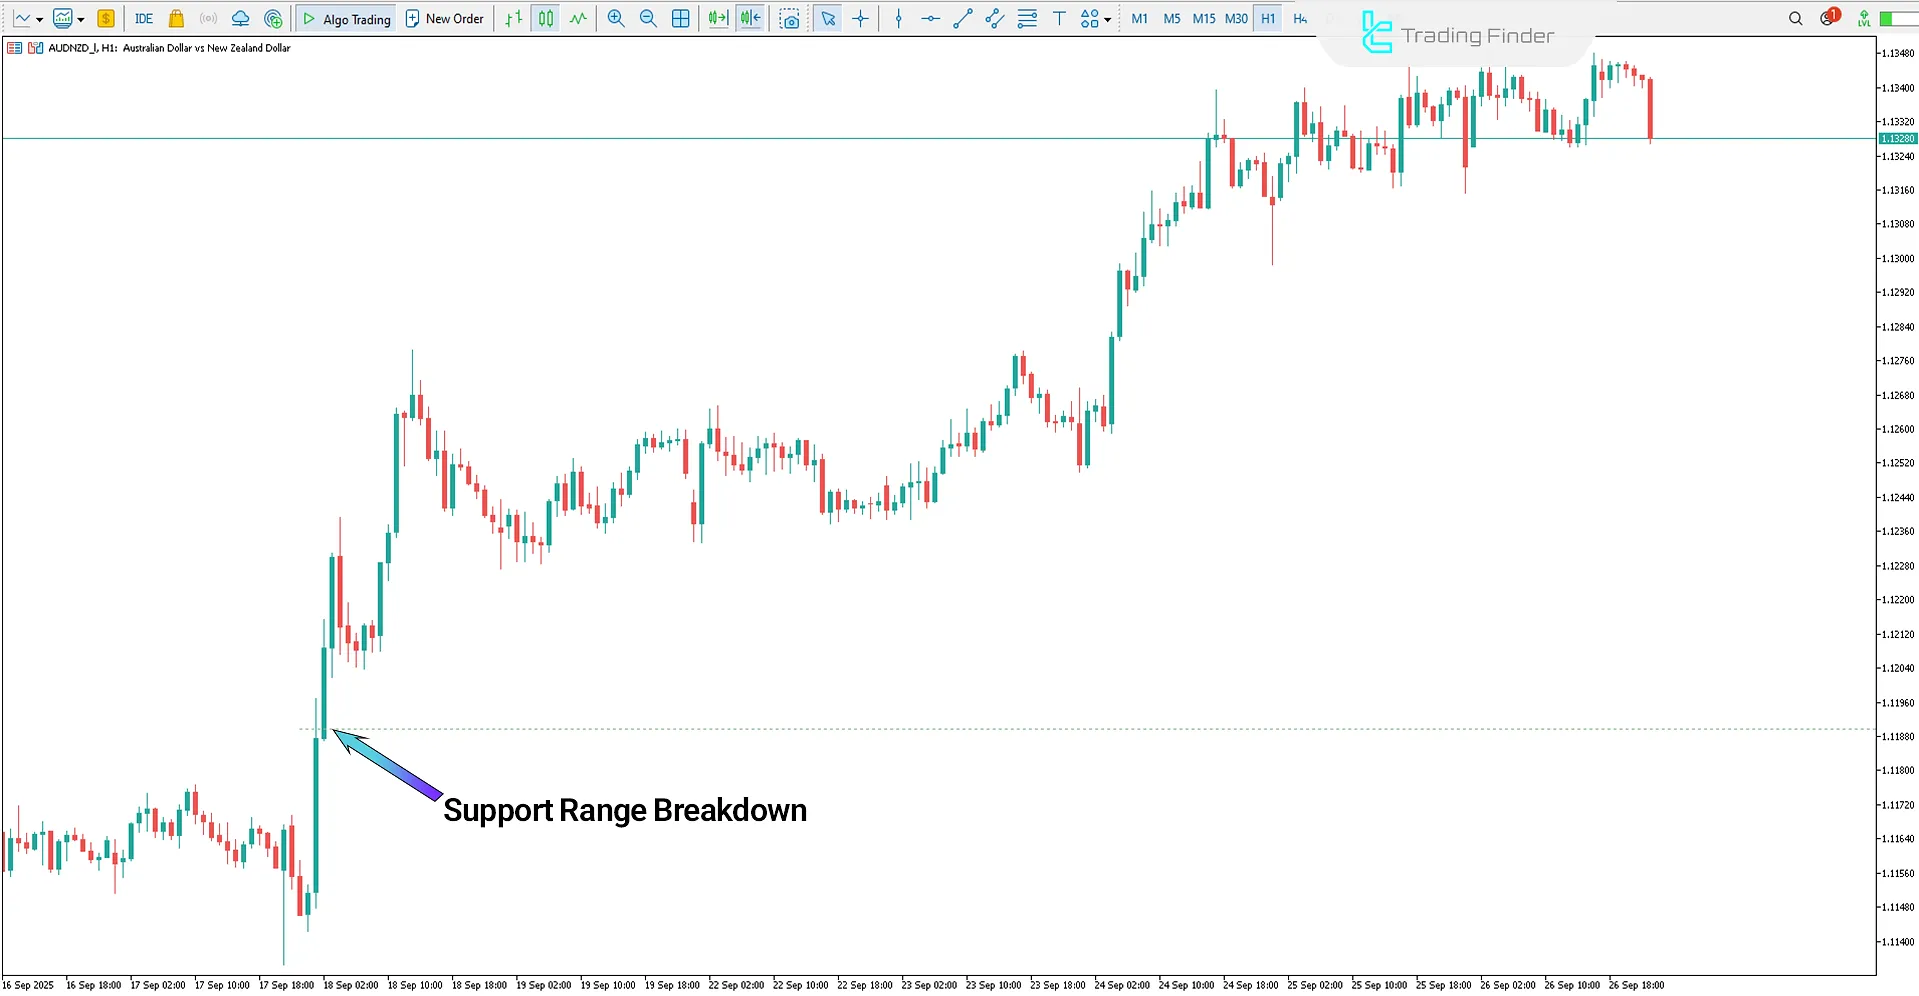
Indicator in an Uptrend
In an uptrend, the indicator highlights ranges that previously served as strong support levels and where the probability of repeated price reactions is high.
When the price approaches these zones along with the formation of confirming candlesticks such as a bullish Pin Bar or bullish Engulfing, the credibility of the level increases.
If the breakout of these ranges is accompanied by high trading volume, suitable zones for buy entries will be provided.

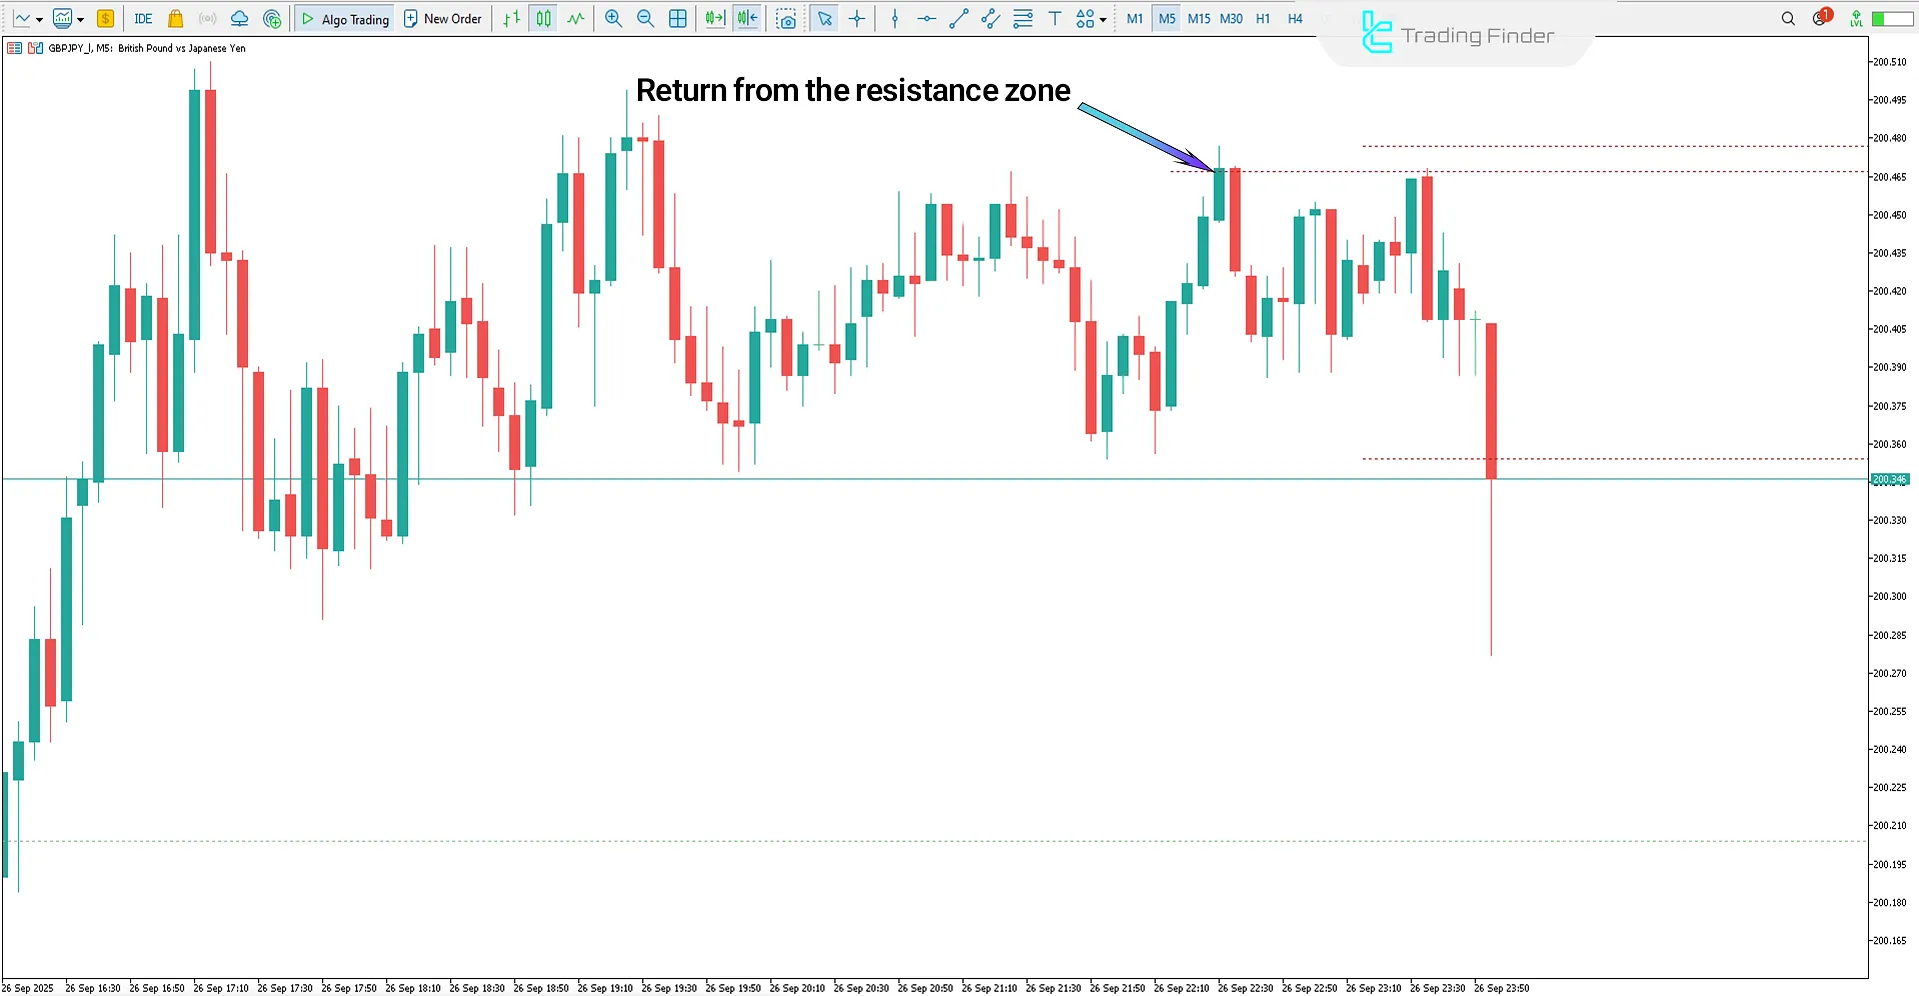
Indicator in a Downtrend
In a downtrend, when the price reaches a resistance zone and simultaneously bearish reversal candlesticks such as a Shooting Star or bearish Engulfing form, a trend reversal warning is triggered.
This reaction indicates that the strength of buyers has weakened while sellers’ dominance has increased. In this case, a suitable zone for sell entries is provided.

Power Dynamite Areas Indicator Settings
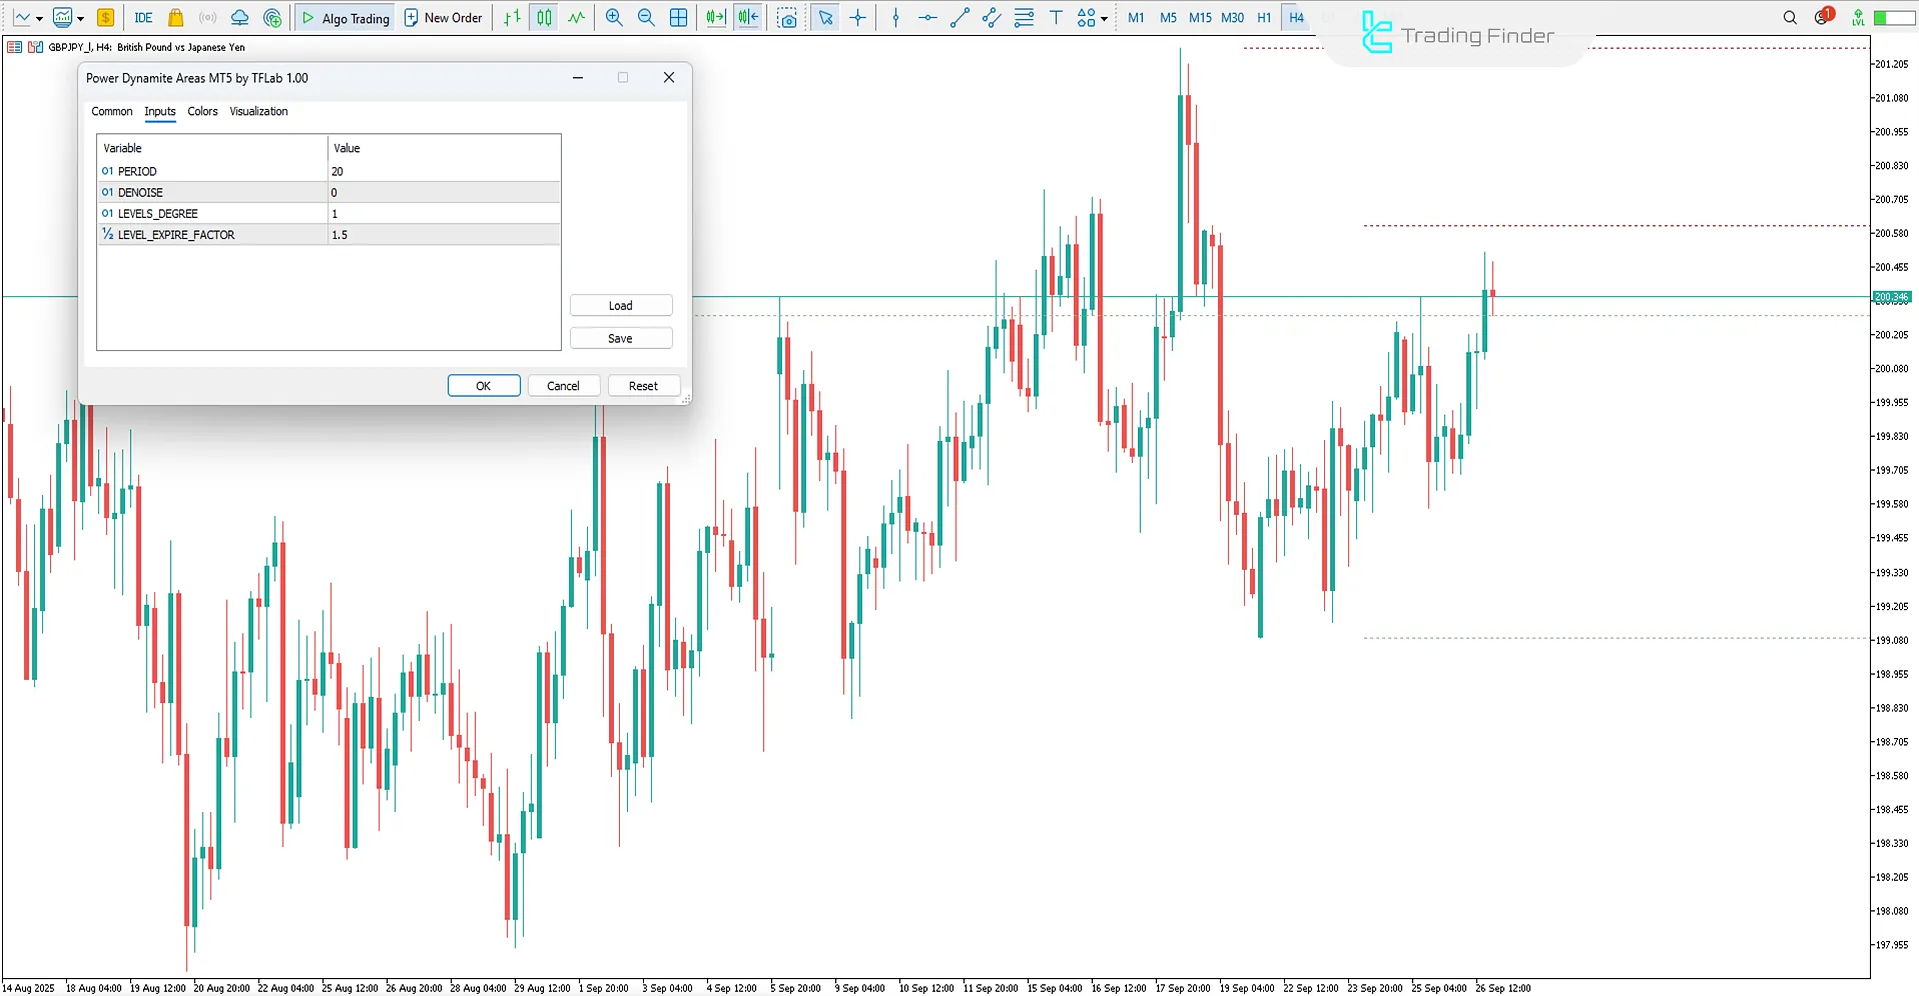
The image below shows the settings panel of the Power Dynamite Areas Indicator in MetaTrader 5:

- PERIOD: Defines the calculation period
- DENOISE: Sets noise filtering
- LEVELS_DEGREE: Determines indicator sensitivity in identifying and displaying levels
- LEVEL_EXPIRE_FACTOR: Defines the expiration factor of the level
Conclusion
The Power Dynamite Areas Indicator, by modeling the Market Memory Effect, identifies ranges that have shown significant price reactions in the past. These zones often act as liquidity pools and key points for structural trend changes.
The identification process of these zones is not limited to simple support and resistance lines; rather, the indicator determines dynamic supports and resistances by considering the strength of past reactions and the repetition of touches.
Power Dynamite Areas Indicator MetaTrader 5 PDF
Power Dynamite Areas Indicator MetaTrader 5 PDF
Click to download Power Dynamite Areas Indicator MetaTrader 5 PDFWhat is the main function of the Power Dynamite Areas Indicator?
This indicator works based on the principle of the Market Memory Effect and identifies specific zones that had significant price reactions in the past.
Which confirming candlesticks provide greater credibility in combination with the Power Dynamite Areas?
In this indicator, patterns such as bullish/bearish Pin Bar and bullish/bearish Engulfing have the highest credibility.


