![Power Trend Indicator for MetaTrader 5 Download - Free - from [Trading Finder]](https://cdn.tradingfinder.com/image/95296/12-2-en-power-trend-indicator-mt5-1.webp)
![Power Trend Indicator for MetaTrader 5 Download - Free - from [Trading Finder] 0](https://cdn.tradingfinder.com/image/95296/12-2-en-power-trend-indicator-mt5-1.webp)
![Power Trend Indicator for MetaTrader 5 Download - Free - from [Trading Finder] 1](https://cdn.tradingfinder.com/image/95318/12-2-en-power-trend-indicator-mt5-2.webp)
![Power Trend Indicator for MetaTrader 5 Download - Free - from [Trading Finder] 2](https://cdn.tradingfinder.com/image/95319/12-2-en-power-trend-indicator-mt5-3.webp)
![Power Trend Indicator for MetaTrader 5 Download - Free - from [Trading Finder] 3](https://cdn.tradingfinder.com/image/95307/12-2-en-power-trend-indicator-mt5-4.webp)
The Power Trend Indicator is a valuable tool for MetaTrader 5 that enables traders to detect the direction and strength of market trends.
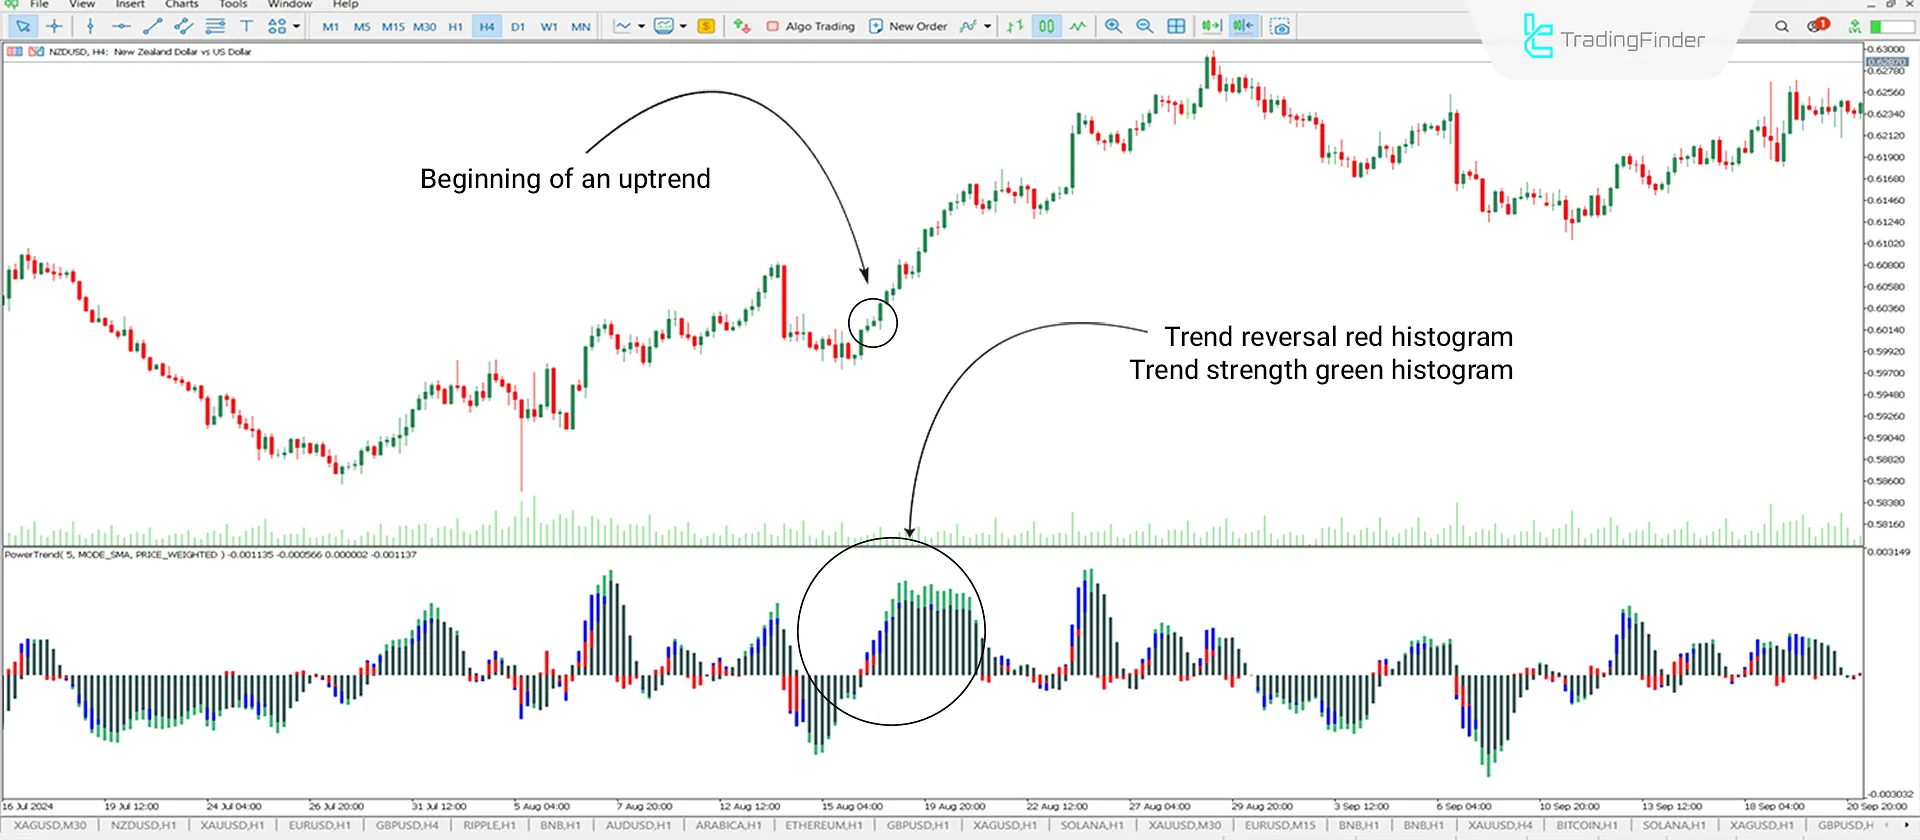
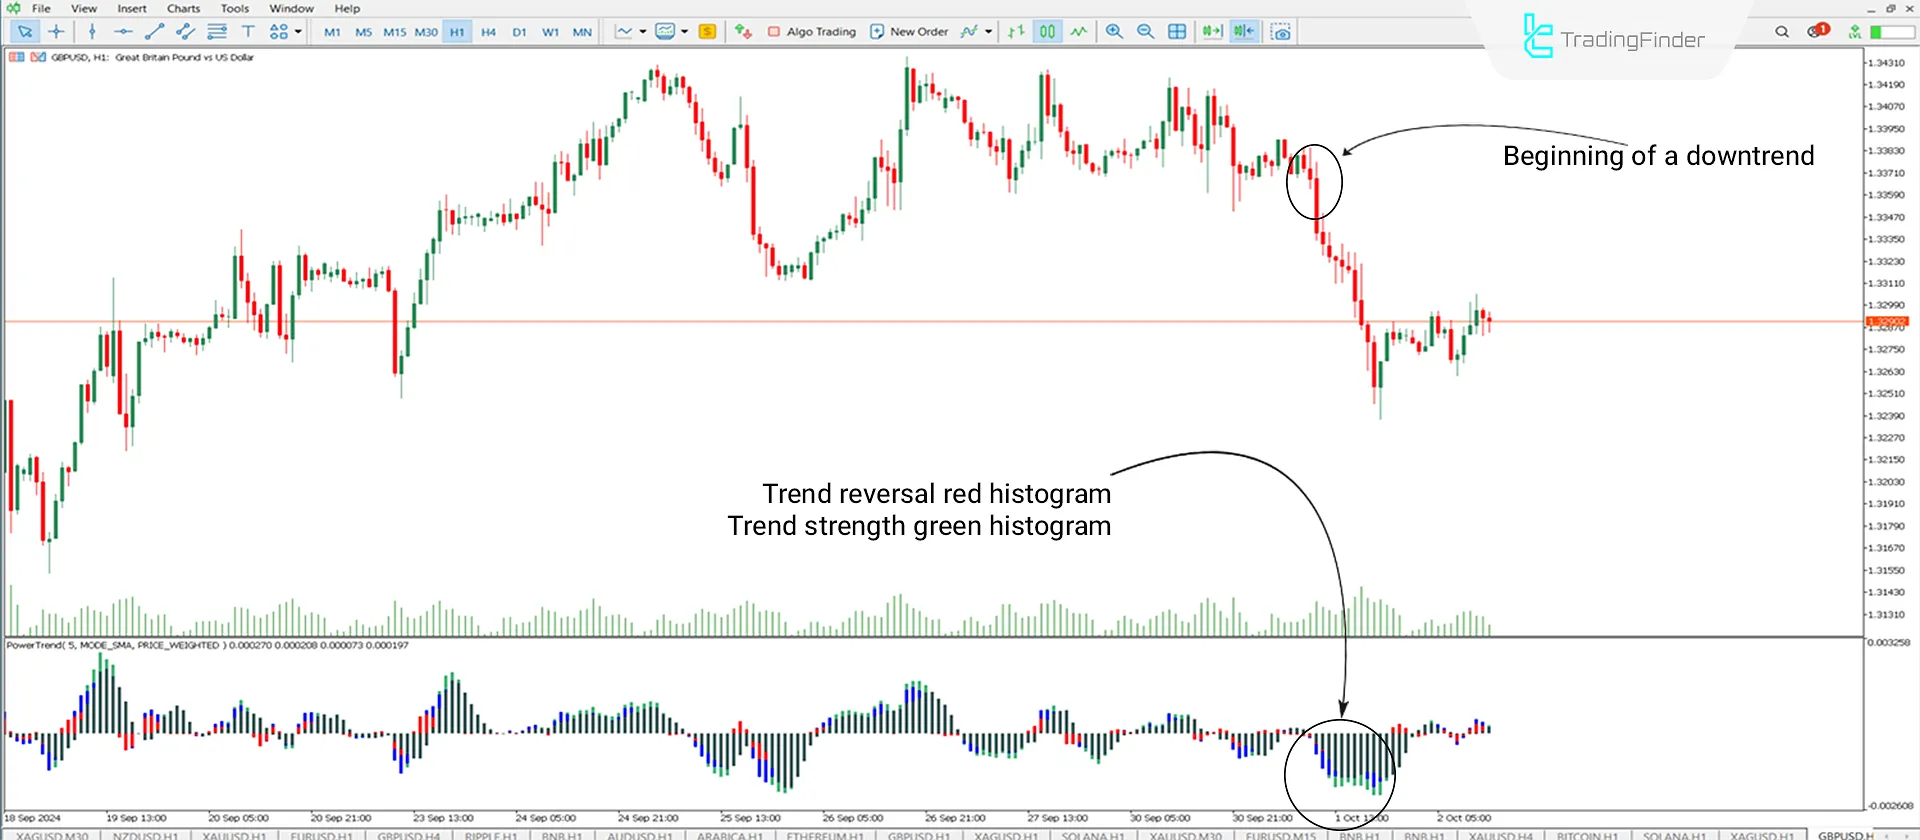
This oscillator displays trend strength using four colors. Red in the histogram indicates a trend change, blue represents a weak trend, green signifies a strong trend, and black denotes a neutral trend. This trading tool is ideal for detecting trend reversals and sudden trend changes.
Trend Power Oscillator Specifications
The specifications of the Trend Strength Detection Indicator are as follows:
Indicator Categories: | Oscillators MT5 Indicators Signal & Forecast MT5 Indicators Currency Strength MT5 Indicators |
Platforms: | MetaTrader 5 Indicators |
Trading Skills: | Intermediate |
Indicator Types: | Reversal MT5 Indicators |
Timeframe: | Multi-Timeframe MT5 Indicators |
Trading Style: | Swing Trading MT5 Indicators |
Trading Instruments: | Forex MT5 Indicators Crypto MT5 Indicators Stock MT5 Indicators Commodity MT5 Indicators Indices MT5 Indicators Forward MT5 Indicators Share Stock MT5 Indicators |
Overview of the Indicator
The Power Trend Oscillator is an effective tool for identifying both the direction (Trend) and strength of a trend, which traders can see through histograms in different colors.
The indicator features two phases: a positive phase (above the zero line) and a negative phase (below the zero line). It shows uptrends in the positive phase and downtrends in the negative phase.
The uptrend of the Indicator
The chart below shows the New Zealand Dollar to US Dollar (NZD/USD) pair in a 4-hour timeframe. In the highlighted area, the histograms shift from the negative to the positive phase, with the red histogram indicating a Change Of Trend. Additionally, green histograms provide a signal for a strong Bullish Trend.

Downtrend of the Indicator
The chart below shows the British Pound to US Dollar (GBP/USD) pair in a 1-hour timeframe. In the highlighted area, the histograms shift from the positive to the negative phase, with the red histogram indicating a Change Of Trend. Furthermore, green histograms signal a strong Bearish Trend.

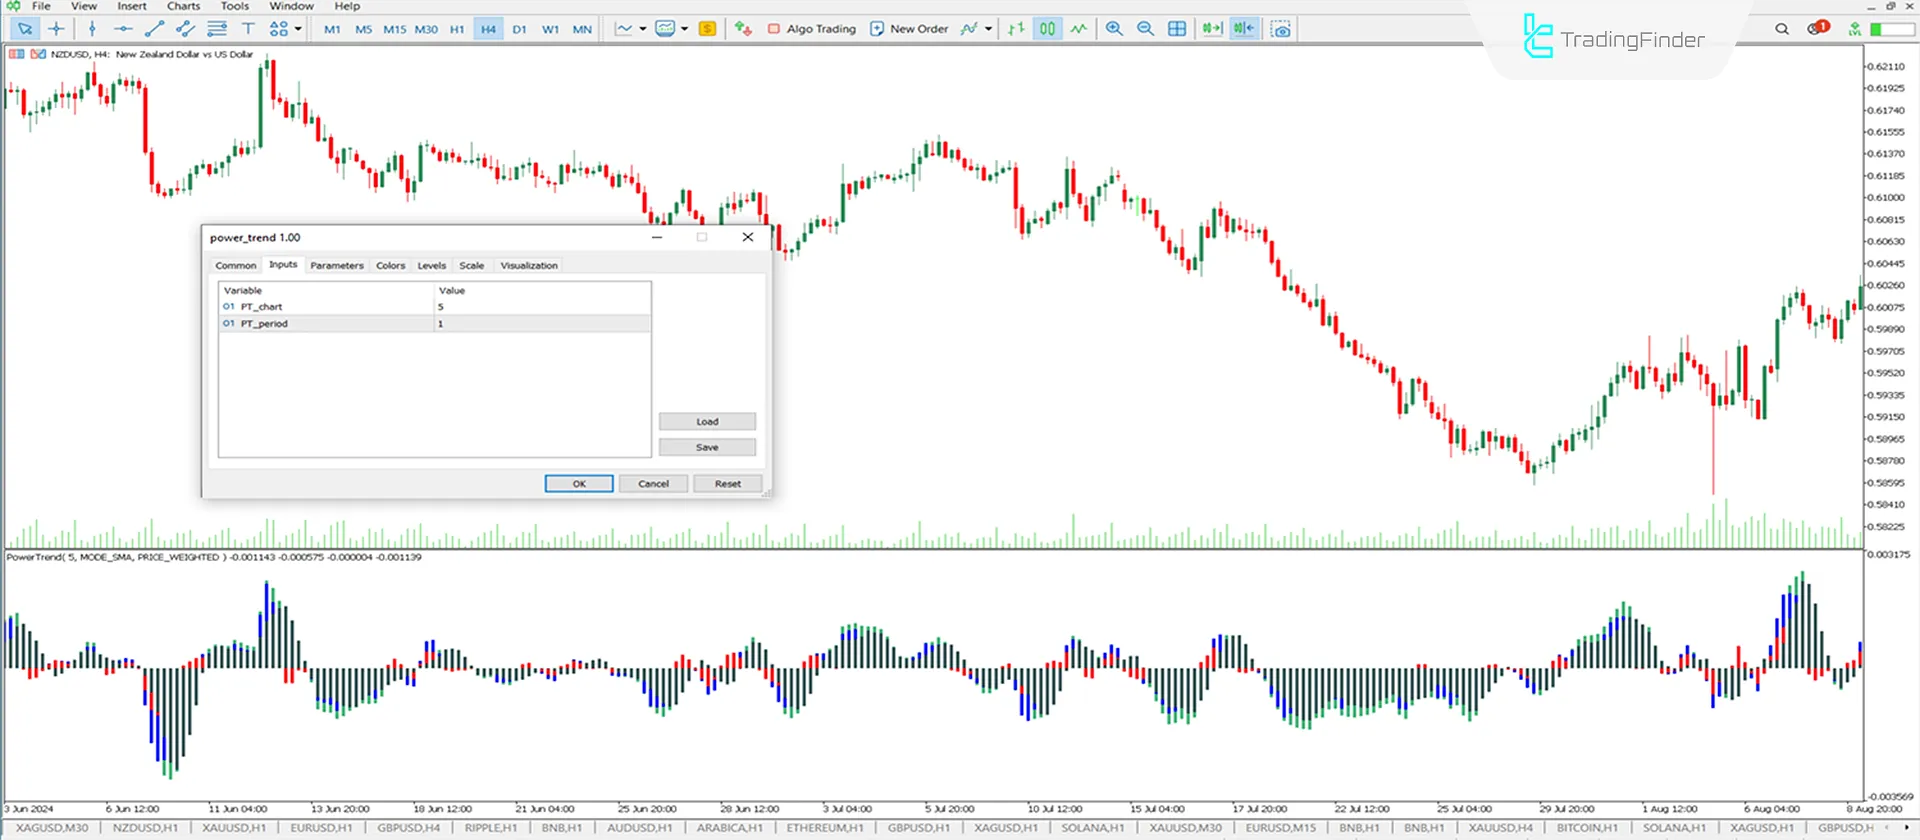
Trend Strength Detection Indicator Settings
The settings of the Trend Power Oscillator are as follows:

- PT_chart: Histogram candlestick integration equals 5
- PT_period: Indicator period equals 1
Conclusion
The Power Trend Indicator is an excellent tool for detecting changes and identifying strong or weak trends.
This oscillator can be used alongside various analytical styles and tools, such as support and resistance levels, price channels, and divergences, to further confirm trend direction and reversal points.
Power Trend MT5 PDF
Power Trend MT5 PDF
Click to download Power Trend MT5 PDFCan the Power Trend Indicator be used on its own?
To accurately determine trend direction, this indicator should be used alongside other analytical tools, such as support and resistance levels and divergences.
How does the Power Trend Indicator signal trend changes?
The indicator alerts traders to trend changes using red histograms.


